[ A L P H A X ] Bollinger/Keltner Volatility Pressure SystemAlphaX Volatility Pressure System — Bollinger/Keltner Squeeze Detection, Linear Regression Forecast, Multi-Confluence Band Touch Signals, Volatility Regime Classification & Institutional Dashboard
AlphaX Volatility Pressure System (VPS) is a professional-grade volatility analysis and signal system built on the interaction between Bollinger Bands and Keltner Channels — the foundation of squeeze-based trading. It combines a proprietary multi-layer squeeze engine, linear regression band forecasting, a six-factor confluence scoring system, and a comprehensive real-time dashboard into a single cohesive overlay. Designed and default-tuned for XAUUSD (Gold) on the 1-minute timeframe, fully adaptable to any instrument or timeframe.
━━━━━━━━━━━━━━━━━━━━━━━━━━━━━━━━━━━━━━━━
📸 Visual Overview
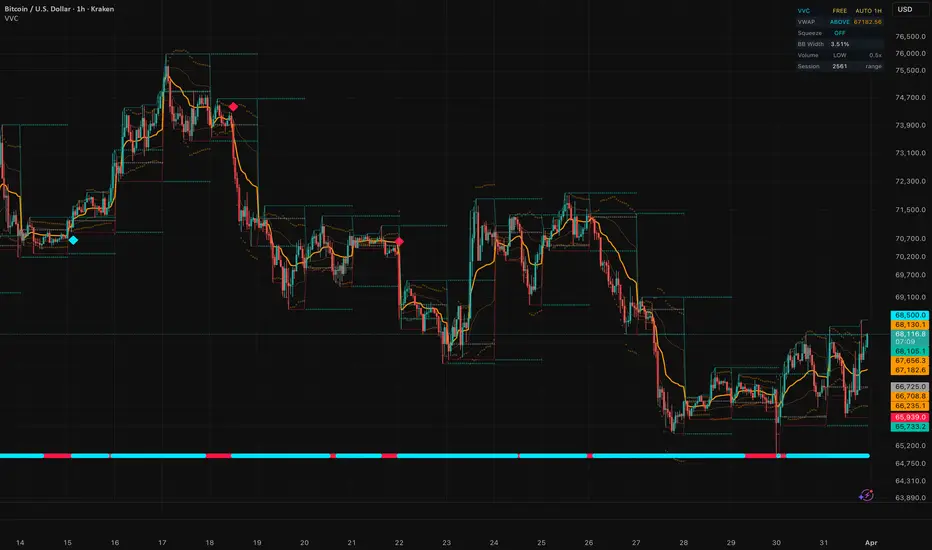
The indicator displays Bollinger Bands as a gradient cloud, Keltner Channel boundaries as dotted lines, squeeze status dots on the basis line, a projected forecast envelope extending into the future, confidence-scored entry signals at band touches, mean reversion exit markers, and a full diagnostic dashboard — all in a clean, non-cluttered layout with a consistent yellow-green / red / gray color theme.
━━━━━━━━━━━━━━━━━━━━━━━━━━━━━━━━━━━━━━━━
🔬 The Volatility Pressure Architecture — How It Works
At the core of AlphaX VPS is the principle that volatility is cyclical — periods of compression (low volatility) are followed by periods of expansion (high volatility), and vice versa. The system detects exactly where you are in this cycle and provides actionable intelligence at every stage.
The system operates through seven integrated layers:
Layer 1 — Bollinger Bands (Volatility Envelope)
A Simple Moving Average (SMA) basis line with standard deviation bands above and below
Default: 30-period SMA with 2.2x multiplier — tuned for gold's micro-noise on 1-minute charts
The bands expand during volatile moves and contract during consolidation
Price touching or piercing the outer bands represents statistical extremes — potential reversal zones
The space between upper and lower bands is rendered as a gradient cloud that shifts color based on price position relative to the basis — yellow-green when price is above basis (bullish pressure), red when below (bearish pressure)
Layer 2 — Keltner Channels (ATR Volatility Wrapper)
An Exponential Moving Average (EMA) center line with Average True Range (ATR) bands
Default: 30-period EMA with 1.8x ATR multiplier using 20-period ATR — calibrated for gold
Keltner Channels represent the "normal" volatility range based on true range, while Bollinger Bands represent statistical deviation — the relationship between them reveals compression and expansion states
Plotted as subtle dotted lines at the channel boundaries for clean visual reference without chart clutter
Layer 3 — Squeeze Engine
Squeeze ON — detected when Bollinger Bands contract inside the Keltner Channel (BB upper < KC upper AND BB lower > KC lower). This means volatility has compressed below normal levels — a spring is being loaded
Squeeze Release — the first bar where BB breaks back outside KC after a squeeze period. This is the explosive moment where the compressed energy releases into a directional move
Squeeze status is displayed as colored dots on the BB basis line: red dots during active squeeze, yellow-green dots on squeeze release, gray dots during normal conditions
Squeeze Momentum — a John Carter-style linear regression calculation determines the direction of the squeeze release: bullish momentum (price likely to break upward) or bearish momentum (price likely to break downward)
Squeeze release events generate flash markers on the chart: "⚡ SQ↑" for bullish releases, "⚡ SQ↓" for bearish releases
The dashboard tracks how many of the last 20 bars were in squeeze state — prolonged squeezes (12+ bars) tend to produce the most explosive releases
Layer 4 — Linear Regression Forecast
A forward-looking projection of the Bollinger Band envelope using linear regression slopes
The system calculates the current slope of both the BB basis and the BB deviation, then projects them forward by the configured number of bars (default: 20 bars = 20 minutes on 1-minute chart)
The projection is smoothed using a weighted blend from current values to forecasted values, preventing jarring visual jumps
Displayed as a projected envelope with upper, basis, and lower forecast lines, plus a filled forecast cloud
Forecast color reflects projected direction: yellow-green if the basis is projected to rise, red if projected to fall
Price labels at the forecast endpoints show the projected upper and lower band values — giving you concrete target levels
A minimum bandwidth floor prevents the forecast from collapsing to zero during extreme compression
Layer 5 — Trend EMA
A 100-period Exponential Moving Average provides macro trend context
Color-coded: yellow-green when price is above (bullish structure), red when below (bearish structure)
The EMA slope direction (rising vs. falling over 3 bars) is factored into the confluence scoring system
Acts as a structural filter — signals aligned with the EMA trend receive bonus confidence, signals against it receive penalties
Layer 6 — RSI Filter
A 14-period Relative Strength Index provides momentum confirmation
Oversold threshold at 30, overbought at 70 — stricter than typical settings to filter gold noise
RSI must be in a supportive zone for signals to fire: below 45 for bullish signals, above 55 for bearish signals
Deeply oversold or overbought RSI readings contribute up to 15 points to the confluence score
Layer 7 — Volatility Regime Classification
The system continuously classifies the current market state into one of five regimes:
SQUEEZE 🔴 — BB inside KC, volatility compressed, spring loading
RELEASE ⚡ — first bar after squeeze ends, explosive move initiating
EXPANSION 📈 — bandwidth increasing and price trending directionally
COMPRESSION — bandwidth decreasing, volatility contracting
RANGING — no clear volatility trend, sideways movement
The current regime is displayed prominently in the dashboard and influences signal generation — signals during active squeeze are blocked entirely
━━━━━━━━━━━━━━━━━━━━━━━━━━━━━━━━━━━━━━━━
📊 Signal System — Band Touch Signals
AlphaX VPS generates two types of chart signals: Entry Signals at band extremes and Exit Markers at mean reversion.
Entry Signals ( ⬆ / ⬇ )
Entry signals appear when price touches or pierces a Bollinger Band while multiple confluence factors align to confirm a high-probability reversal setup.
Bullish Entry (⬆) — a yellow-green label below the bar indicating a potential long opportunity:
Price touches or pierces the lower Bollinger Band
Confluence score meets the minimum confidence threshold (default: 60%)
RSI is below 45 (supportive of oversold bounce)
Volume is above average (institutional participation confirmed)
A swing low structure is present near the band (not just a random wick)
Candle shows bullish rejection — either a bullish close or a long lower wick (>50% of candle range)
Market is NOT in active squeeze (signals blocked during compression)
Cooldown period has elapsed since last bullish signal (default: 15 bars)
Bearish Entry (⬇) — a red label above the bar indicating a potential short opportunity:
Price touches or pierces the upper Bollinger Band
Confluence score meets the minimum confidence threshold
RSI is above 55 (supportive of overbought reversal)
Volume is above average
A swing high structure is present near the band
Candle shows bearish rejection — either a bearish close or a long upper wick
Market is NOT in active squeeze
Cooldown period has elapsed since last bearish signal
Each signal label displays the tier rating and confidence percentage :
S-Tier (80%+) — exceptional setup, maximum confluence — highest probability
A-Tier (70–79%) — strong setup, most factors aligned
B-Tier (60–69%) — decent setup, adequate confluence for a trade with proper risk management
Signals below B-Tier are automatically filtered out and never displayed.
━━━━━━━━━━━━━━━━━━━━━━━━━━━━━━━━━━━━━━━━
Exit Markers ( ✕ )
After an entry signal fires, the system tracks position direction and monitors for mean reversion to the BB basis line :
Long Exit ✕ — appears when price crosses back above the BB basis after a bullish entry, indicating the mean reversion target has been reached
Short Exit ✕ — appears when price crosses back below the BB basis after a bearish entry, indicating the mean reversion target has been reached
Exit markers serve as profit-taking signals — the statistical edge of a band touch trade is the reversion to the mean (basis line). Once price reaches the basis:
Take partial or full profit
Tighten stop loss to breakeven
Wait for the next band touch signal before re-entering
━━━━━━━━━━━━━━━━━━━━━━━━━━━━━━━━━━━━━━━━
🧠 Multi-Confluence Confidence Scoring System
Every entry signal is evaluated by a real-time scoring engine that produces a confidence percentage from 0% to 100%. This is not a simple threshold check — it is a weighted multi-factor assessment that rewards alignment and penalizes contradiction.
Scoring Factors — Bullish Signals:
Band Touch Quality (up to 20 points)
How deeply price pierced the lower Bollinger Band
Pierce depth >5% of band width = 20 points (strong penetration)
Any pierce = 15 points
Near-touch (within 0.1%) = 10 points
%B Position (up to 10 points)
Bollinger %B measures where price sits within the band range (0 = lower band, 1 = upper band)
%B below 0 (outside lower band) = 10 points
%B below 0.05 = 8 points
%B below 0.15 = 5 points
RSI Depth (up to 15 points)
RSI below 20 = 15 points (deeply oversold)
RSI below 25 = 12 points
RSI below 30 = 10 points
RSI below 40 = 3 points
EMA Trend Alignment (up to 10 points)
Price above 100 EMA AND EMA slope rising = 10 points (full alignment)
Price above 100 EMA only = 5 points
Squeeze Release Confluence (up to 10 points)
Squeeze just released with bullish momentum = 10 points (explosive setup)
Bullish squeeze momentum without active squeeze = 5 points
Candle Rejection Pattern (up to 10 points)
Long lower wick (>50% of range) + bullish close = 10 points (textbook rejection)
Long lower wick only = 7 points
Bullish close only = 3 points
Volume Confirmation (up to 10 points)
Above-average volume + bullish close = 10 points (institutional buying)
Above-average volume only = 5 points
MACD Momentum (up to 8 points)
MACD line above signal line OR histogram rising for 2+ bars = 8 points
200 SMA Structure (up to 7 points)
Price above 200 SMA = 7 points (macro trend support)
Penalty Deductions:
Price BELOW EMA trend = -15 points (counter-trend signal)
RSI above 55 = -12 points (momentum doesn't support reversal)
Active squeeze = -8 points (wait for release)
Expanding but directionless = -5 points
No volume spike when volume filter enabled = -5 points
Bearish candle rejection present = -10 points (wrong candle structure)
The same structure applies to bearish signals with inverted logic — upper band touch, overbought RSI, price below EMA, bearish rejection candles, etc.
━━━━━━━━━━━━━━━━━━━━━━━━━━━━━━━━━━━━━━━━
🛡 Signal Quality Gates — Why This Indicator Produces Clean Signals
Beyond the confidence score, every signal must pass through six independent quality gates before it can appear on the chart. If any single gate fails, the signal is blocked entirely — regardless of the confidence score:
Gate 1 — Band Touch Gate
Price must actually reach or pierce the Bollinger Band (within 0.1%)
Signals near the middle of the bands are impossible — only statistical extremes qualify
Gate 2 — RSI Zone Gate
Bullish signals require RSI below 45
Bearish signals require RSI above 55
This prevents signals when momentum is neutral or contradictory
Gate 3 — Volume Gate
Volume must exceed the 20-period volume moving average multiplied by 1.2x
Low-volume band touches are often noise — this gate requires institutional participation
Can be toggled off for instruments with unreliable volume data
Gate 4 — Swing Structure Gate
A swing low must be present within the last 3 bars for bullish signals (price formed a local bottom)
A swing high must be present within the last 3 bars for bearish signals (price formed a local top)
This prevents signals on through-band breakdowns where price is accelerating through the band, not bouncing off it
Can be toggled off for faster signal generation
Gate 5 — Candle Confirmation Gate
Bullish signals require either a bullish candle close (close > open) or a bullish rejection wick (lower wick > 50% of total range)
Bearish signals require either a bearish candle close or a bearish rejection wick
This confirms that price is actually rejecting the band level, not just touching it on the way through
Gate 6 — Squeeze Block Gate
No signals fire during active squeeze (BB inside KC)
During squeeze, volatility is compressed and band touches are unreliable — the bands themselves are artificially narrow
Signals resume after squeeze releases
Gate 7 — Cooldown Gate
A minimum of 15 bars (15 minutes on 1-minute chart) must elapse between signals of the same direction
Prevents signal spam during choppy band-walking conditions
This seven-gate architecture is why AlphaX VPS produces significantly fewer but higher-quality signals compared to basic Bollinger Band indicators.
━━━━━━━━━━━━━━━━━━━━━━━━━━━━━━━━━━━━━━━━
⚠ Identifying Choppy / Ranging Markets — When NOT to Trade
Knowing when to stay out is just as important as knowing when to enter. AlphaX VPS provides multiple visual cues for choppy, range-bound conditions:
How to identify choppy conditions:
BB Cloud is extremely narrow — when the Bollinger Bands contract tightly, the cloud between upper and lower bands becomes paper-thin. Narrow bands = low volatility = no clean directional moves.
Squeeze dots are RED for extended periods — prolonged red dots on the basis line mean BB is trapped inside KC. While this predicts an eventual explosive move, trading during the squeeze is a losing strategy. Wait for the yellow-green release dot.
Forecast cloud is flat and narrow — if the projected envelope shows no significant expansion or directional slope, the system expects continued compression. No expansion forecast = no trade.
Regime dashboard shows "COMPRESSION" or "RANGING" — the volatility regime classifier explicitly tells you the current state. These regimes have the lowest signal quality.
No signals appearing despite price touching bands — this means the quality gates are doing their job. If you see band touches but no labels, the confluence score is too low or a gate is blocking. Trust the filter.
EMA (100) is flat and price is oscillating around it — no trend, no edge.
Basis distance in dashboard shows very small percentage — price is hugging the basis line, meaning there is no stretched rubber band to snap back. Mean reversion trades need extension first.
What to do during choppy markets:
Do not force trades — wait for squeeze release (yellow-green dot + ⚡ marker)
Watch for the forecast cloud to start expanding and tilting directionally
Monitor the regime dashboard — wait for "RELEASE ⚡" or "EXPANSION 📈" to appear
Consider moving to a higher timeframe where structure may be clearer
Use the squeeze bar counter in the dashboard — once squeeze bars reach 12+/20, the release is likely imminent
━━━━━━━━━━━━━━━━━━━━━━━━━━━━━━━━━━━━━━━━
🚀 How to Trade with AlphaX VPS — Step by Step
Step 1 — Assess Market Regime
Check the dashboard REGIME field: Is it EXPANSION, COMPRESSION, SQUEEZE, or RANGING?
Check the Bollinger Band cloud width: Is it expanded or collapsed?
Check squeeze dots: Red = stay out. Gray = normal. Yellow-green = just released.
If the regime is SQUEEZE or COMPRESSION → do not trade. Wait for RELEASE or EXPANSION.
Step 2 — Monitor the Forecast
Look at the projected envelope ahead of current price
Is the forecast expanding or narrowing? What direction is the basis slope?
A widening forecast with a clear directional slope tells you where the bands are heading
The forecast upper and lower price labels give you concrete projected targets
Step 3 — Wait for a Band Touch Signal
Do not chase price in the middle of the bands — wait for price to reach an extreme
A ⬆ or ⬇ label will appear only when all seven quality gates pass and the confidence score meets your threshold
The label shows the tier (S/A/B) and exact confidence percentage — use this to size your position (higher confidence = larger size)
Step 4 — Enter the Trade
Enter on the signal bar's close (signals are confirmed on bar close, non-repainting)
Place your stop loss beyond the Bollinger Band that was touched (for bullish: below the lower band, for bearish: above the upper band)
Your profit target is the BB basis line (mean reversion target) — the system will mark this with a ✕ when reached
Step 5 — Manage and Exit
Watch for the ✕ exit marker — this appears when price crosses back to the BB basis
Take partial or full profit at the basis line
If price continues past the basis toward the opposite band, you can trail your stop using the basis line as your new stop level
If a new signal appears in the same direction before the exit triggers, it can be used to add to the position
Step 6 — Squeeze Release Trades (Advanced)
When you see the "⚡ SQ↑" or "⚡ SQ↓" release marker, this is a momentum breakout setup
The squeeze release direction (bull/bear) is determined by the squeeze momentum calculation
Enter in the direction of the release
These moves tend to be explosive — use wider stops and larger targets than mean reversion trades
The forecast projection will often show an expanding envelope in the direction of the release — use the forecast band endpoints as extended targets
━━━━━━━━━━━━━━━━━━━━━━━━━━━━━━━━━━━━━━━━
📋 Real-Time Dashboard — Complete Market Intelligence
The dashboard provides a comprehensive snapshot of every metric the system monitors, organized into five sections:
─── VOLATILITY ───
REGIME — Current volatility state (Squeeze / Release / Expansion / Compression / Ranging) with color-coded background
BANDWIDTH — Current BB width as percentage of basis, colored relative to its 50-period average (narrow = green/opportunity, wide = red/extended)
BB %B — Where price sits within the bands (0% = lower band, 100% = upper band). Extreme readings are color-highlighted
SQUEEZE BARS — How many of the last 20 bars were in squeeze (higher = more compressed = bigger expected release)
KC RELATION — Whether BB is inside KC (squeeze), above KC (expansion), or near KC (transition)
─── MOMENTUM ───
RSI — Current RSI value with zone label (OB/OS/HIGH/LOW/MID) and appropriate coloring
EMA — Trend direction based on price vs. 100 EMA and EMA slope (▲ BULL / ▲ RISING / ▼ BEAR / ▼ FALLING)
SQ MOMENTUM — Squeeze momentum direction and strength (▲▲ STRONG UP / ▲ RISING / ▼▼ STRONG DOWN / ▼ FALLING / — FLAT)
MACD — MACD momentum status (▲ BULLISH / ▼ BEARISH / — NEUTRAL)
VOLUME — Whether current volume exceeds the moving average threshold (▲ ABOVE AVG / — NORMAL)
─── CONFIDENCE ───
BULL CONF — Current bullish confluence score with tier rating (S-TIER / A-TIER / B-TIER / C-TIER / LOW)
BEAR CONF — Current bearish confluence score with tier rating
These update in real-time so you can see confluence building before a signal fires
─── FORECAST ───
BASIS SLOPE — Direction the BB basis is heading (▲ RISING / ▼ FALLING / — FLAT)
BAND FORECAST — Whether bands are projected to widen (▲ WIDENING) or narrow (▼ NARROWING) or remain stable
─── STRUCTURE ───
SMA 200 — Price position relative to 200 SMA (▲ ABOVE / ▼ BELOW) — macro trend context
─── TRADE STATE ───
POSITION — Current tracked position direction (▲ LONG / ▼ SHORT / — FLAT) with color-coded background
BASIS DISTANCE — How far price is from the BB basis as a percentage — measures extension and mean reversion potential
Dashboard position (Top Left / Top Right / Bottom Left / Bottom Right) and text size (Tiny / Small / Normal) are configurable.
━━━━━━━━━━━━━━━━━━━━━━━━━━━━━━━━━━━━━━━━
⚡ Key Features
📊 Bollinger Bands with gradient trend cloud — instant visual of price position within the volatility envelope
🔷 Keltner Channels with ATR-based boundaries — the volatility reference for squeeze detection
🔴 BB/KC Squeeze Engine — detects compression, tracks squeeze duration, classifies release direction
⚡ Squeeze Release Flash Markers — "⚡ SQ↑" and "⚡ SQ↓" labels mark the explosive moment
🔭 Linear Regression Forecast — projects the band envelope forward with directional slope and price targets
🎯 Multi-confluence band touch signals — six-factor scoring with seven independent quality gates
📐 Volume filter — requires above-average volume for signal confirmation (toggleable)
🏗 Swing structure filter — requires local swing formation near bands (toggleable)
🕯 Candle rejection analysis — wick ratio and close direction confirmation
📈 MACD momentum integration — histogram trend confirmation within the scoring system
📏 200 SMA macro structure — long-term trend context for scoring
📐 100 EMA trend filter — intermediate trend direction and slope analysis
✕ Mean reversion exit markers — automatic profit target detection at the BB basis
🏷 Tiered signal labels — S / A / B tier with confidence percentage for position sizing decisions
📋 22-row real-time dashboard — complete market intelligence across volatility, momentum, confidence, forecast, structure, and trade state
🎨 Cohesive dual-tone color theme — yellow-green for bullish, red for bearish, orange for neutral, gray for inactive
🔔 11 alert conditions — S-Tier, A-Tier, and any-tier for both bull and bear, plus squeeze releases and exits
⚙ Fully configurable — all periods, multipliers, thresholds, colors, gates, and dashboard settings adjustable from the settings panel
🚫 No candle coloring — clean chart by default, your candles remain untouched
📏 Non-repainting — all signals confirmed on bar close
━━━━━━━━━━━━━━━━━━━━━━━━━━━━━━━━━━━━━━━━
⚙ Settings Reference
📊 Bollinger Bands
BB Length — SMA period for the basis line (default: 30)
BB Multiplier — standard deviation multiplier for band width (default: 2.2)
Source — price source for calculations (default: close)
Show BB Cloud — toggle the gradient band fill
🔷 Keltner Channel
KC Length — EMA period for the center line (default: 30)
KC ATR Multiplier — ATR multiplier for channel width (default: 1.8)
KC ATR Length — ATR calculation period (default: 20)
Show KC Lines — toggle Keltner boundary display
⚡ Squeeze
Show Squeeze Dots — toggle colored dots on the basis line
Alert on Squeeze Release — enable squeeze release alerts
🔭 Forecast
Show Regression Forecast — toggle the projected envelope
Forecast Bars — how many bars forward to project (default: 20)
🎯 Signals
Show Band Touch Signals — master toggle for entry labels
Min Confidence % — minimum confluence score required (default: 60%)
Signal Cooldown — minimum bars between same-direction signals (default: 15)
Show Mean Reversion Exits — toggle ✕ exit markers
📈 RSI Filter
RSI Length — calculation period (default: 14)
RSI Oversold — threshold for oversold scoring bonus (default: 30)
RSI Overbought — threshold for overbought scoring bonus (default: 70)
📐 EMA Trend Filter
Show Trend EMA — toggle the 100 EMA display
EMA Length — EMA period (default: 100)
📊 Volume Filter
Use Volume Confirmation — enable/disable volume gate (default: ON)
Volume Threshold Multiplier — how far above average volume must be (default: 1.2x)
Volume MA Length — period for volume moving average (default: 20)
🏗 Structure Filter
Use Swing Structure Filter — enable/disable swing gate (default: ON)
Swing Lookback — bars to check for swing formation (default: 3)
🎨 Colors
Bull Primary — yellow-green family for all bullish elements
Bear Primary — red family for all bearish elements
Basis / Neutral — orange for basis and neutral elements
Squeeze ON / OFF / Neutral — dot colors for squeeze states
Forecast Bull / Bear — projection envelope colors
Dashboard BG / Text / Neutral — dashboard styling
📋 Dashboard
Show Dashboard — master toggle
Position — corner placement (default: Top Right)
Text Size — Tiny / Small / Normal (default: Small)
━━━━━━━━━━━━━━━━━━━━━━━━━━━━━━━━━━━━━━━━
🔔 Alert Conditions
S-Tier Bull Band Touch — fires when a bullish signal with 80%+ confidence appears
A-Tier Bull Band Touch — fires when a bullish signal with 70–79% confidence appears
Any Bull Band Touch — fires on any bullish signal meeting minimum threshold
S-Tier Bear Band Touch — fires when a bearish signal with 80%+ confidence appears
A-Tier Bear Band Touch — fires when a bearish signal with 70–79% confidence appears
Any Bear Band Touch — fires on any bearish signal meeting minimum threshold
Any Band Touch Signal — fires on any entry signal regardless of direction
Squeeze Release — Bullish — fires on bullish squeeze release
Squeeze Release — Bearish — fires on bearish squeeze release
Any Squeeze Release — fires on any squeeze release
Long Exit — Mean Reversion — fires when a long position reaches the BB basis
Short Exit — Mean Reversion — fires when a short position reaches the BB basis
All alert messages include {{ticker}}, {{interval}}, and {{close}} placeholders for webhook integration.
━━━━━━━━━━━━━━━━━━━━━━━━━━━━━━━━━━━━━━━━
🎯 Default Settings — Optimized For
The default configuration is specifically tuned for XAUUSD (Gold) on the 1-minute timeframe :
BB Length 30 and Multiplier 2.2 — smooths gold's micro-noise and widens bands to reduce false touches
KC Length 30 and ATR Multiplier 1.8 — matched to BB for proper squeeze detection on gold
Confidence threshold at 30% — aggressively filters low-quality signals while keeping genuine setups
Cooldown at 4 bars (4 minutes) — prevents signal spam during volatile gold transitions
Volume filter enabled with 1.2x threshold — confirms institutional participation
Swing structure filter enabled — requires actual price structure, not random wicks
100 EMA provides ~1.5 hours of trend context on 1-minute
20-bar forecast projects 20 minutes ahead — practical for scalping decisions
For other instruments or timeframes, adjust:
Higher timeframes (5m, 15m, 1H) — reduce BB Length to 20–25, reduce confidence to 45–55%, increase forecast bars to 30–50
Forex majors (EURUSD, GBPUSD) — reduce BB Multiplier to 2.0, reduce KC ATR Multiplier to 1.5, keep confidence at 50–60%
Indices (NAS100, US30, SPX500) — use defaults or increase BB Length to 35–40 for broader structure
Crypto (BTCUSD, ETHUSD) — increase BB Multiplier to 2.5, increase cooldown to 20–25 bars due to higher volatility
Less noise / fewer signals — increase Min Confidence to 70%+, increase Cooldown, enable all gates
More signals / aggressive scalping — decrease Min Confidence to 40–50%, reduce Cooldown to 8–10, disable Swing Structure gate
━━━━━━━━━━━━━━━━━━━━━━━━━━━━━━━━━━━━━━━━
👥 Who This Is For
🥇 Gold (XAUUSD) scalpers and intraday traders — built and default-tuned specifically for gold's volatility, noise profile, and session structure
📊 Bollinger Band traders — if you trade band touches and mean reversion, this system adds institutional-grade filtering to your existing strategy
⚡ Squeeze traders — the BB/KC squeeze engine with momentum direction and release markers provides a complete squeeze trading system
📉 Forex and index traders — applicable to all major instruments with minor setting adjustments
🧠 Systematic traders — the confidence scoring system provides a quantitative framework for position sizing and trade selection
📈 Traders who value clean charts — no indicator clutter, no candle painting, no overlapping signals. One cohesive system with consistent color coding
⚠ Traders who struggle with overtrading — the seven quality gates physically prevent low-quality signals from appearing. You cannot overtrade what you cannot see
🔭 Forward-looking traders — the regression forecast gives you a projected roadmap that most indicators do not provide
━━━━━━━━━━━━━━━━━━━━━━━━━━━━━━━━━━━━━━━━
📝 Notes
All calculations are non-repainting — signals are confirmed on bar close only
The linear regression forecast updates on each new bar — the projection is a mathematical estimate, not a guarantee of future price action
Volume filter uses the volume data provided by your broker/data feed — for instruments or exchanges with unreliable volume, consider disabling the volume gate
The 200 SMA used in scoring requires 200 bars of history to calculate — on very short chart histories, this factor may not contribute to early signals
Maximum 500 labels per chart are supported by TradingView — on very low timeframes with extended history, oldest labels may be automatically removed
The forecast polyline uses TradingView's polyline drawing objects — a maximum of 100 polylines are allocated
Dashboard uses a table object that updates on the last bar — it reflects real-time values on live charts
Squeeze momentum calculation uses the John Carter method — linear regression of the midline-basis deviation over the BB length
━━━━━━━━━━━━━━━━━━━━━━━━━━━━━━━━━━━━━━━━
⚠ Disclaimer
This indicator is a technical analysis and visualization tool intended for educational and informational purposes only. It does not constitute financial advice or a recommendation to buy or sell any financial instrument. All signals are generated from historical and real-time price data using mathematical calculations — their accuracy or profitability is not guaranteed. Past performance of any signal type does not guarantee future results. Always conduct your own analysis, use proper risk management, and consult a licensed financial advisor before making any trading decisions. The author accepts no responsibility for any losses incurred from the use of this indicator.
━━━━━━━━━━━━━━━━━━━━━━━━━━━━━━━━━━━━━━━━
Built for traders who demand clarity, precision, and institutional-grade filtering from their volatility analysis.
Chỉ báo