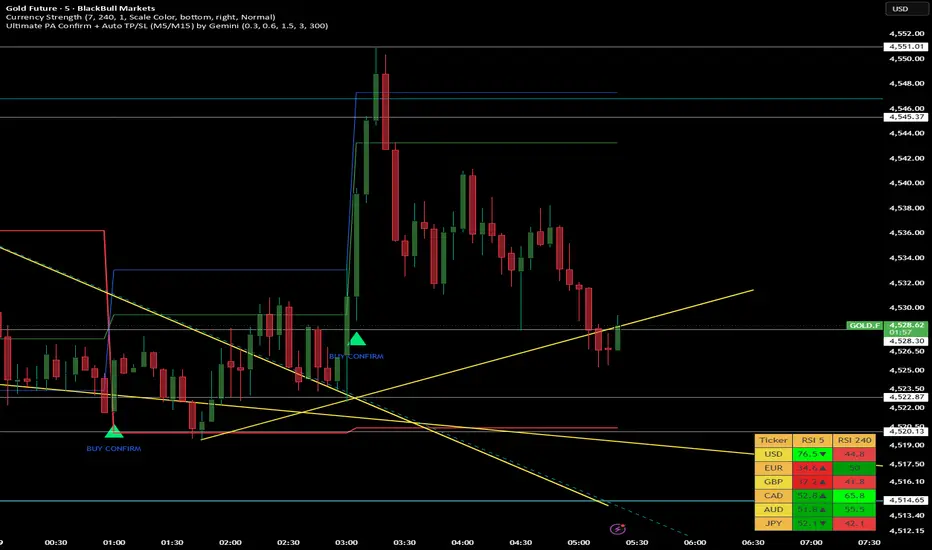
TBT TEST Zesto es un script de prueba para probar si funciona y hacer mas adelatne una version fginal Chỉ báocủa TwoBrosTrade9
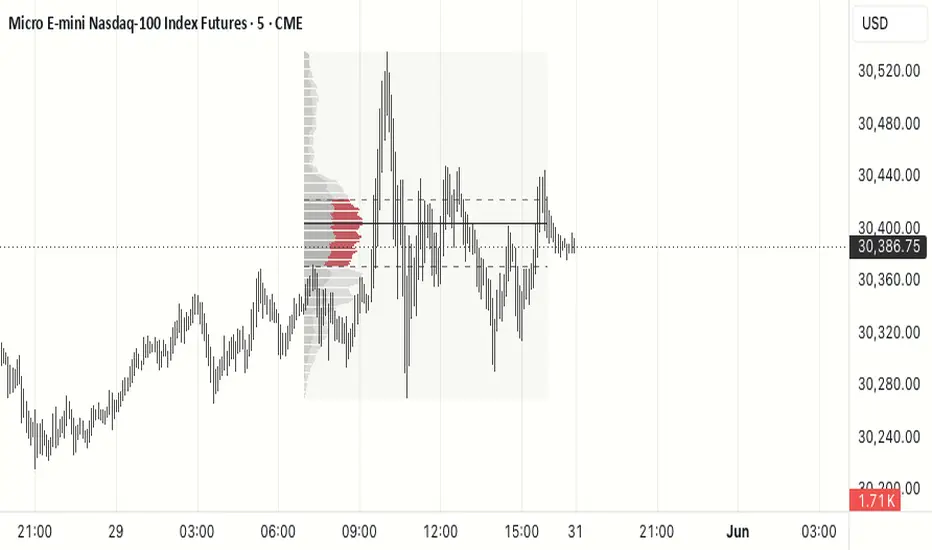
Volume Suite: Bubbles + Profile + VWAP/ORBHere's a full-length description written for futures/NQ traders. Volume Suite: Bubbles + Profile + VWAP/ORB An all-in-one volume and market-structure toolkit built for intraday futures traders. Volume Suite combines three professional-grade volume analysis tools into a single indicator, each with its own master on/off toggle so you can run all three together or isolate exactly the one you need. It was built with index futures like NQ (E-mini Nasdaq-100) and ES in mind, where session timing, volume distribution, and the opening range carry real predictive weight. Instead of cluttering your chart with three separate scripts that each eat into TradingView's indicator limit, this consolidates everything into one efficient package. Module ① — Volume Bubbles Volume Bubbles surfaces the bars where real money is moving. Rather than relying on a single fixed volume threshold, it ranks each bar against recent history using percentile analysis across three independent lookback windows (short, medium, and long—20, 50, and 100 bars by default). A bar only gets flagged when it clears your chosen percentile, and you control how strict that confirmation is: require just one window to agree, a majority of two, or all three for the highest-conviction signals. Detected bars are drawn as circular bubbles whose size reflects the magnitude of the event—Small (top 25%), Medium (top 10%), and Big (top 3%)—so a glance tells you whether you're looking at routine participation or a genuine volume spike. Each bubble is colored by direction: buy, sell, or mixed. You decide how direction is determined, choosing between simple candle direction, volume delta (net buying versus selling pressure pulled from a lower-timeframe scan), or "Both," which only commits to a direction when candle and delta agree, labeling everything else as mixed. The detection engine itself is flexible. You can trigger on volume only, delta only, both together (strictest), or either one (most inclusive). When delta data isn't available for a symbol, the module automatically falls back to volume-only mode so it never silently breaks. Optional in-bubble text and detailed tooltips display the underlying volume, delta, and volume ratio, along with which lookback windows confirmed the signal—useful when you want to understand why a bar was flagged rather than just that it was. Built-in alert conditions let you get notified on big clusters, medium-or-bigger clusters, or any cluster at all. Module ② — Volume Profile The Volume Profile module answers the question that matters most for futures traders: where did the trading actually happen? It distributes traded volume horizontally across price levels over a lookback range you define—either a fixed number of bars or the currently visible range—and uses a smart lower-timeframe engine that dynamically selects the optimal granularity to maximize accuracy within that range. From this distribution it derives the key reference levels professionals trade around. The Point of Control (POC) marks the single most-traded price, available as a developing line that updates bar by bar or as a static last-value line. The Value Area (68% of volume by default, fully adjustable) is bounded by the Value Area High and Value Area Low, the levels that so often act as intraday support and resistance on NQ. The module also identifies supply and demand zones from low-volume nodes, highlights profile gaps where activity drops sharply between price levels, and overlays a sentiment profile showing the dominant side—bullish or bearish—at each level, classified either by bar polarity or by buying/selling pressure within each bar. Supporting features round it out: a volume histogram that can sit at the top or bottom of your chart with an optional moving average, volume-weighted bar coloring that tints price bars by how their volume compares to the average (with separate upper and lower thresholds), and a profile stats table summarizing profile high and low, the value area levels, total and average volume, the volume MA, the bar count, and which lower timeframe the data was sourced from. Price-level labels can be aligned directly to the profile rows. The module also fires alerts when price crosses the POC, the Value Area High, or the Value Area Low, when high volume is detected, and when an extreme volume spike suggests possible exhaustion. Module ③ — NY VWAP + Opening Range The third module is purpose-built around the New York session, the window where NQ does the bulk of its meaningful work. It plots a session-anchored VWAP that resets at the start of each NY session (9:30–16:00 ET by default, configurable) and can optionally extend its final value past the close so you can see where the session settled. Because it's volume-weighted and session-reset rather than a rolling average, it gives you a clean read on the day's true average traded price—the level institutions and algos lean on. Alongside the VWAP it tracks the Opening Range (ORB): the high and low established during the first X minutes after the open (15 by default, adjustable up to two hours). Once that window closes, the module draws horizontal lines at the opening range high and low and labels them ORB-H and ORB-L. These lines extend through the rest of the session, giving you a persistent visual frame for one of the most-traded setups in index futures—the opening range breakout and breakdown. The range automatically resets each new trading day, so every session starts clean. Why use it together Each module is powerful alone, but they reinforce each other. A Big buy bubble printing right at the Value Area Low, with price reclaiming the opening range high and pushing above session VWAP, is a far stronger signal than any one of those events in isolation. Running all three on one chart gives you volume conviction, structural context, and session timing in a single glance—without burning three indicator slots or forcing you to mentally stitch together separate tools. Everything is organized under clearly labeled input groups with extensive tooltips, so you can tune the behavior to your symbol, timeframe, and trading style. Toggle off what you don't need, dial in the thresholds that match how NQ trades on your timeframe, and keep your workspace focused.Chỉ báocủa navbanga197
BLUR Fibonacci Pro💡 Why Traders Choose BLUR Fibonacci Pro "It's like having a professional analyst draw your Fibonacci levels 24/7 — but better, faster, and with zero effort." ✅ Saves hours of manual chart work ✅ Removes emotional bias from your analysis ✅ Reveals hidden price targets most traders miss ✅ Works seamlessly on any market & any timeframe ✅ Clean, beautiful, and fully customizable Chỉ báocủa zakariasafri471919801
Margin Debt to M2 Ratio█ OVERVIEW Plots customer margin debt divided by the M2 money stock, expressed as a percent, in a separate pane, with a standard deviation band around its mean. Normalizing margin debt by the broad money supply removes the secular growth the raw series accrues through inflation and monetary expansion, so leverage readings are comparable across decades rather than trending upward by construction. █ HISTORY / BACKGROUND Aggregate customer margin debt has long been followed as a gauge of speculative leverage and risk appetite. The statistic is published monthly by FINRA, and previously by the NYSE for member firms. Reading the raw dollar figure across long spans is misleading because it rises with the size of the economy and the money supply regardless of relative leverage. Dividing margin debt by M2 is a normalization that expresses borrowing against the monetary base, isolating changes in leverage intensity from growth in the quantity of money. The approach is a normalization technique rather than a named proprietary system. Its conceptual basis is that relative leverage, not the nominal dollar level, carries the sentiment information. █ HOW IT WORKS The script requests two series at monthly resolution, forms their ratio, and derives a mean and a standard deviation band from the monthly history. 1. Margin debt is requested with request.security at the 1M timeframe using the closing value of the symbol set in the first input. M2 is requested the same way from the second input. 2. The ratio is computed as margin debt divided by the quantity (M2 multiplied by 1000), then multiplied by 100. The factor of 1000 reconciles units, because the default margin debt series is reported in millions of dollars and M2 in billions. The factor of 100 expresses the result as a percent. When either series is na, or when M2 is zero, the ratio is na. 3. One ratio observation is appended to a persistent array on each new calendar month, detected with a change in the monthly time value. Computing the statistics from this array rather than from chart bars keeps them correct on any chart resolution, because forward filled monthly values on a lower timeframe do not inflate the sample. 4. On each new month the band statistics are recomputed. The window is the entire array in full sample mode, or the trailing number of months given by the lookback input in rolling mode. The mean is the arithmetic average over the window. The standard deviation is the sample deviation, computed as the square root of the summed squared deviations from the mean divided by the window length minus one, and is na until at least two observations exist. 5. The upper and lower band lines are the mean plus and minus the sigma multiplier times the standard deviation. █ HOW TO USE The script is built for the monthly timeframe. The underlying data is monthly for M2 and quarterly for the margin debt proxy, and the statistics are accumulated per calendar month, so 1M is the resolution at which the display matches the data cadence. On an intraday chart the script draws a warning label and the band should not be read at that resolution. Visual elements: • The blue line is the margin debt to M2 ratio in percent. • The shaded band spans the mean plus and minus the chosen sigma multiple. • The gray midline is the mean, when enabled. • The label at the last bar prints the current ratio to two decimals. Readings above the upper band indicate leverage that is high relative to the money supply. Readings below the lower band indicate depressed leverage, typically following a deleveraging episode. This is a slow moving macro context series, not a timing trigger. An alert condition fires when the ratio reaches or exceeds the upper band. █ SETTINGS • Margin debt series : the symbol used as the numerator. Default FRED:BOGZ1FL663067003Q. • M2 money stock : the symbol used as the denominator. Default FRED:M2SL. • Band mode : selects Rolling (point-in-time), which uses a trailing window, or Full sample (lookahead), which uses the entire history. Default Rolling (point-in-time). • Rolling lookback (months) : the trailing window length used in rolling mode. Default 180, minimum 12. • Sigma multiplier : the number of standard deviations for the band width. Default 1.0, minimum 0.25, step 0.25. • Show mean midline : toggles the mean line. Default on. • Show current value label : toggles the last bar value label. Default on. █ WHAT MAKES IT ORIGINAL The script normalizes margin debt by M2 and presents the result in a dedicated pane with an explicit standard deviation band, rather than overlaying a rate of change or a z score of the raw series on price. Two design choices distinguish the implementation. First, the band can be computed either as a trailing point-in-time window or as a fixed full sample band, and the full sample option is labeled as containing lookahead, so the distinction is explicit rather than hidden in the output. Second, the band statistics are accumulated from one observation per calendar month held in an array, which makes the mean and standard deviation independent of the chart timeframe and avoids the understated deviation that results when forward filled monthly values are sampled on a lower timeframe. █ NOTES / LIMITATIONS • Symbol resolution : both inputs ignore invalid symbols. If a symbol does not resolve or returns na, or if M2 is zero, the ratio is na and neither the line nor the band renders. No runtime error is raised. • Unit assumption : the ratio applies a fixed factor of 1000 to reconcile a numerator in millions against a denominator in billions. Replacing the default symbols with series in other units breaks the percent scaling. • Data cadence : the default margin debt proxy is quarterly and M2 is monthly, so the ratio holds the most recent quarterly margin debt value across the intervening months. • Provenance : TradingView does not carry the FINRA monthly margin debt statistic as a native symbol. The default numerator is the Federal Reserve Z.1 series for margin accounts at brokers and dealers, a close substitute that differs in level and cadence from the FINRA figure. • Lookahead : only the Full sample band mode uses future observations in its statistics and is therefore not point-in-time. Rolling mode does not. The request.security calls use the default non lookahead behavior. • Timeframe : the logic is intended for 1M. On intraday charts a warning label is drawn and the band should not be read. • History dependence : the band requires accumulated monthly observations to populate. Early in available history, or on symbols with short history, the standard deviation is na until at least two monthly observations exist and stabilizes only after the lookback window fills. █ THANKS Chart concept surfaced by the Stacked Insights YouTube channel. Margin debt data originates with FINRA and the Federal Reserve. M2 originates with the Board of Governors of the Federal Reserve System.Chỉ báocủa BY_Tse14
A/D Crossing Trend PRO (Indian Day Trading)Trend Calculation Trend Identifier Cross - over TrendChỉ báocủa amanrajpc1001
Single Candle Footprint v2 - EngineSingle Candle Footprint Delta Pro Single Candle Footprint Delta Pro is an order flow inspired indicator designed to visualize intrabar buying and selling pressure directly on each candle. Unlike traditional volume indicators that only show total volume, this script breaks each candle into multiple price levels and estimates the distribution of aggressive buying and selling activity using lower timeframe data. Features • Bid / Ask Footprint Visualization Displays a footprint-style ladder beside each candle: Left side: estimated selling volume (Bid) Right side: estimated buying volume (Ask) Each row represents a price level inside the candle range This allows traders to analyze how volume is distributed at different prices. • Delta Calculation The script calculates: Delta = Ask Volume - Bid Volume Positive delta indicates stronger buying pressure, while negative delta indicates stronger selling pressure. Delta helps identify: Aggressive buyers Aggressive sellers Momentum strength Potential exhaustion • Volume Point of Control (POC) Highlights the price level where the highest amount of volume occurred inside the candle. POC can act as: A short-term equilibrium level A reaction zone A potential retest area • Imbalance Detection Detects abnormal volume differences between buyers and sellers. Example: Ask: 3000 Bid: 500 The strong ratio suggests buyer imbalance. This helps identify areas where one side is dominating the auction. • Stacked Imbalance Identifies multiple consecutive price levels with strong imbalance. A stacked imbalance may indicate: Strong directional participation Institutional activity Aggressive order flow continuation • Absorption Detection Highlights situations where price movement and delta disagree. Examples: Bullish absorption: Price moves down Delta remains positive Meaning: Sellers are aggressive, but buyers absorb their selling pressure. Bearish absorption: Price moves up Delta turns negative Meaning: Buyers are aggressive, but sellers absorb the demand. • Unfinished Auction (UA) Detects extreme price levels where one side dominates without sufficient opposing volume. This can indicate an incomplete auction process and possible future price revisit. How It Works The indicator uses lower timeframe candles to estimate intrabar order flow: Lower timeframe bullish candles → estimated buying volume Lower timeframe bearish candles → estimated selling volume Because TradingView does not provide true exchange Bid/Ask volume data, this is an approximation of footprint behavior. For true order flow data, platforms with exchange-level market data may provide more precise Bid/Ask footprints. Recommended Use Combine with: Volume Profile VWAP Market Structure Liquidity zones Support / Resistance Best used to analyze: Absorption Breakout confirmation Failed breakouts Liquidity reactions Entry timing Note: This indicator is designed as an order flow visualization tool, not a standalone trading system. It should be interpreted together with price action and market context.Chỉ báocủa phailamsaonana45
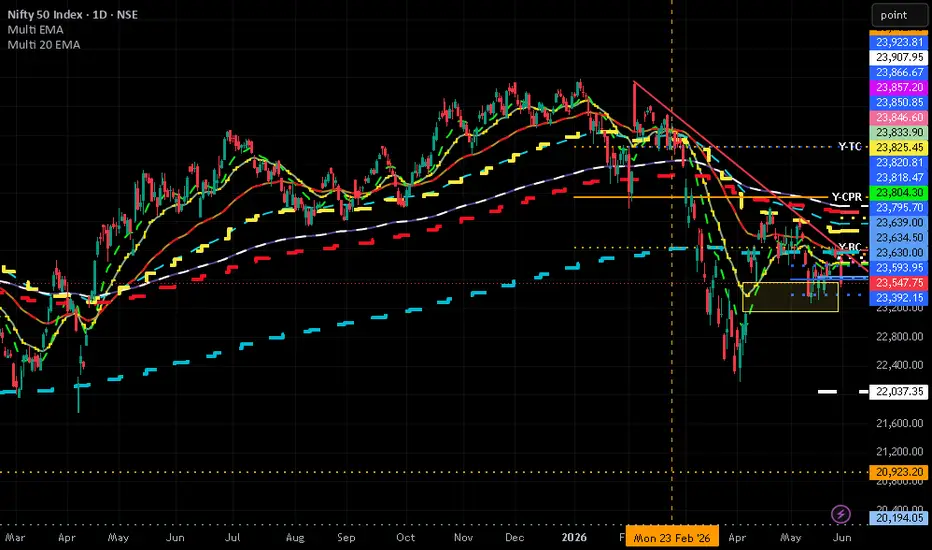
EEM Equal Weight 10Y/2Y Yield Curve - TV Confirmed SymbolsEqual weighted basket of Emerging market 10s n 2s Yield Curve with 20D MA (purple), 50D MA (blue), and 200D MA (yellow)Chỉ báocủa jacksonwarrenfenton0
Equal Weight EM FX Basket vs USD - All Time Fixed TFEqual weighted basket of Emerging market currencies with 20D MA (purple), 50D MA (blue), and 200D MA (yellow)Chỉ báocủa jacksonwarrenfenton0
Equal Weight EM 10Y Yield BasketEqual weighted basket of Emerging market 10Y Yields with 20D MA (purple), 50D MA (blue), and 200D MA (yellow)Chỉ báocủa jacksonwarrenfenton0
BTC Mayer Multiple Pro - Viewer ModeThis idea has always found the bottoms and tops for bitcoin. The table will adjust as price moves up or down. It provides fair value avg, projected bottom, and projected top based on overheated or oversold conditions.Chỉ báocủa bike4sail15
BTC Mayer Dashboard OverlayThis idea has always found the bottoms and tops for bitcoin. The table will adjust as price moves up or down. It provides fair value avg, projected bottom, and projected top based on overheated or oversold conditions.Chỉ báocủa bike4sailCập nhật 7
PI Band# PI Band PI ATR Compression Breakout is a volatility expansion and breakout detection tool built around a custom PI-powered energy model. Unlike traditional squeeze indicators that rely solely on price volatility, this script combines **ATR (volatility)**, **OBV momentum (volume flow)** and a **PI-based energy calculation** to identify compression phases before potential directional breakouts. --- ## How The Energy Engine Works The core of the indicator is the proprietary PI ATR OBV Energy Model. The calculation starts by measuring: * ATR volatility * OBV rate of change * PI-scaled volatility area ATR is transformed into a circular energy representation using: PI × ATR² This value is then combined with the square root of OBV momentum, creating an energy stream that reflects both volatility expansion and volume participation. The resulting energy is normalized and smoothed to produce a dynamic market pressure score ranging between 0 and 100. --- ## PI Power The normalized energy drives a variable called **PI Power**. Higher energy levels increase PI Power. Lower energy levels reduce PI Power. Instead of using a fixed ATR channel, the indicator dynamically adjusts channel width according to the current market energy state. This allows the bands to expand during strong directional moves and contract during low-energy environments. --- ## Compression Detection The script continuously compares the active PI ATR value against its historical average. When PI ATR falls significantly below its own average, a compression state is detected. Compression represents: * Reduced volatility * Contracting market activity * Energy accumulation * Potential breakout preparation Compression zones are highlighted in purple to make them easy to identify. --- ## Dynamic PI ATR Channel The indicator builds a volatility channel around a Center EMA. Components: * Center EMA * Dynamic PI ATR Upper Band * Dynamic PI ATR Lower Band Because channel width is driven by PI Power, the structure automatically adapts to changing market conditions. This creates a responsive framework that behaves differently from static volatility bands. --- ## Breakout Logic A breakout is only considered valid when price escapes a previously compressed structure. ### Long Break A LONG BREAK is generated when: * Previous bar was in compression * Price closes above the upper PI ATR band * Price remains above the center trend line ### Short Break A SHORT BREAK is generated when: * Previous bar was in compression * Price closes below the lower PI ATR band * Price remains below the center trend line This approach attempts to focus on expansion moves that emerge directly from volatility contraction. --- ## Release Signal The indicator also identifies compression releases. A release occurs when: * Compression ends * PI ATR begins expanding again These events are marked with purple release markers and can be used as early warnings that market conditions are changing. --- ## Visual Features ✔ Dynamic PI ATR volatility channel ✔ Compression highlighting ✔ Long and Short breakout signals ✔ Release markers ✔ Adaptive bar coloring ✔ Real-time information panel ✔ Alert conditions for breakout and release events --- ## Information Panel The panel displays: * Current Energy Value * PI Power * Active PI ATR * Historical PI ATR Average * Current Market State Possible states: * COMPRESS * BULL * BEAR * NORMAL * LONG BREAK * SHORT BREAK --- ## Intended Use PI ATR Compression Breakout is designed for traders who want to monitor: * Volatility contractions * Energy accumulation phases * Expansion breakouts * Trend continuation opportunities The indicator is not intended to predict future price movement. Instead, it aims to visualize when market energy shifts from compression into expansion and to highlight potential breakout environments. Chỉ báocủa onderarslantas10720
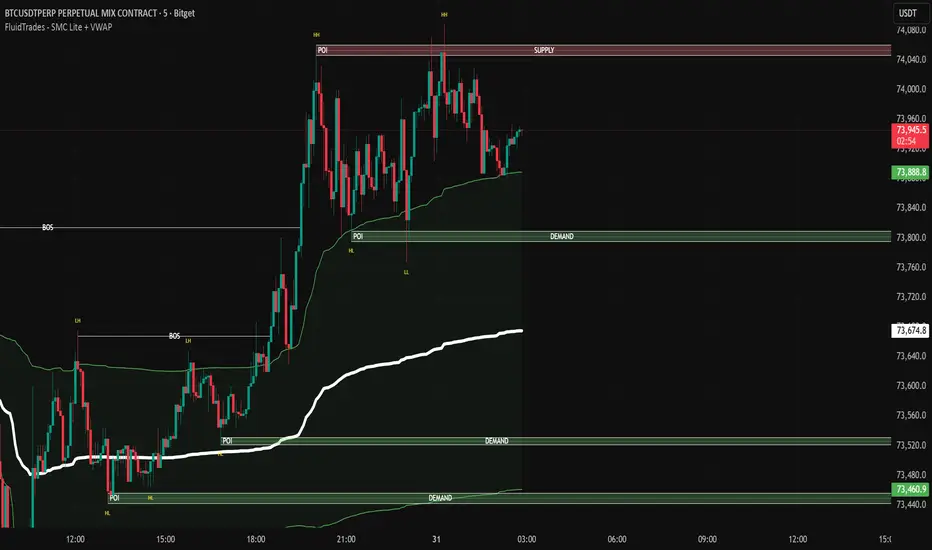
Full Trendline + SMC System [Golden_WolfAI]Full Trendline + SMC System This indicator is built for traders who want to see the market structure clearly, without manually marking every swing, trendline, liquidity zone and imbalance. Full Trendline + SMC System combines classic trendline logic with Smart Money Concepts, helping you read the chart with more confidence and structure. It highlights key market events such as BOS, CHOCH, liquidity sweeps, equal highs/lows, order blocks, fair value gaps and trendline breaks directly on the chart. The goal of this tool is simple: reduce noise and show where the real battle between buyers and sellers may be happening. Main features: • Automatic trendlines based on swing highs and swing lows • Bullish and bearish trendline break detection • BOS and CHOCH market structure labels • Buy-side and sell-side liquidity sweep detection • Equal highs and equal lows detection • Bullish and bearish order block zones • Fair Value Gap zones with optional auto-removal after fill • 50% equilibrium level for premium/discount context • Optional EMA trend filter • BUY and SELL signal labels • Built-in alerts for signals, BOS, CHOCH, trendline breaks, sweeps and FVGs This indicator is not designed to replace your trading plan. It is designed to give you a structured view of the market, so you can make cleaner decisions, avoid random entries and understand where price may be reacting from. Use it to identify structure, liquidity, imbalance and possible continuation or reversal areas. Recommended use: 1. Start from higher timeframes to define market direction. 2. Watch BOS and CHOCH to understand structure shifts. 3. Use liquidity sweeps to detect possible traps. 4. Use order blocks and FVGs as reaction zones. 5. Use BUY/SELL signals only as confirmation, not as blind entries. No indicator can predict the market with certainty. Always use proper risk management and test the tool on your own market, timeframe and trading style before making decisions. Chỉ báocủa Golden_WolfAI1134
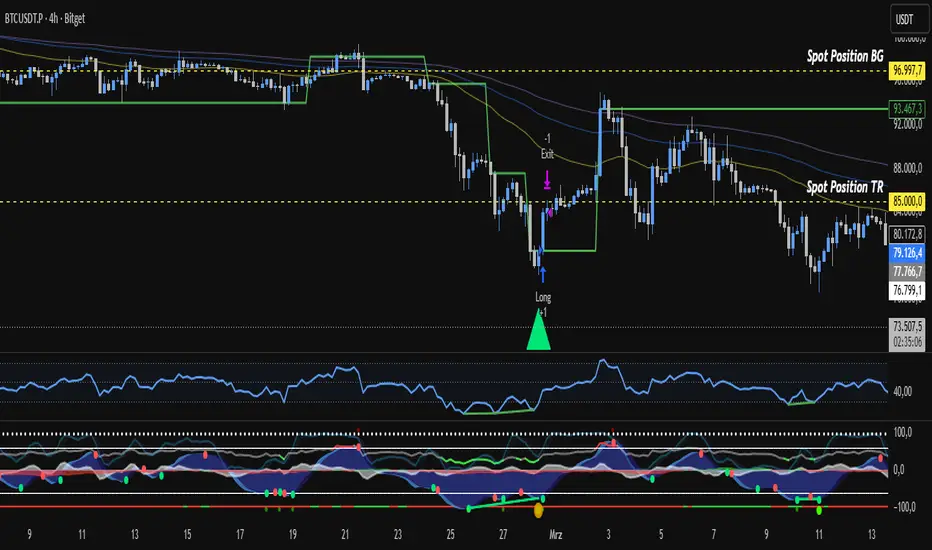
BTC 5m Scalper Pro V4.2 [SAFE STRATEGY] DescriptionBTC 5m Scalper Pro V4.2 is a trend-following, high-probability scalping script meticulously optimized for volatile assets like Bitcoin (BTC) and Gold (XAU/USD). It is designed to capture quick intraday impulses while heavily filtering out market noise, choppy consolidations, and fakeouts. The core philosophy of this script is SAFETY FIRST. It enforces strict mechanical rules combining momentum, trend synchronization, and trend strength before printing any signal.Key Features🛡️ Multi-Filter Safety EngineThe script will only trigger a signal if three independent conditions align perfectly:Trend Alignment (Supertrend + 200 EMA): Longs are strictly allowed only above the 200 EMA, and Shorts only below the 200 EMA.Momentum Confirmation (RSI): Filters out weak moves. Longs require NYSE:RSI > 50$, and Shorts require NYSE:RSI < 50$.Trend Strength (ADX): An adjustable ADX threshold ensures the script remains completely silent during low-volume, sideways ranges.⏱️ Zero Repainting & Signal ProtectionSignals are strictly calculated and confirmed on the close of the previous bar . The script highlights the candle in bright green (Long) or bright pink (Short) and places a clean "GO" label. Once printed on a closed bar, the signal never disappears or changes.📊 Advanced Risk Management & Automatic PlottingAnti-Wick Stop Loss: Automatically scans the lowest low (for Longs) or highest high (for Shorts) of the last 3 candles and adds an ATR-based padding to prevent sudden market sweeps from stopping you out early.Dynamic Target Lines: Automatically draws your dynamic Stop Loss (Red) and Take Profit (Blue) lines right on your chart with precise price figures.Manual R:R or Fibonacci Target: Choose between a steady manual Reward-to-Risk ratio (default 1.5) or a Fibonacci 1.618 extension target.🎛️ Fully Customizable Mini DashboardIncludes a sleek, real-time table at the bottom-right of your screen showing critical data from your last trade (Execution Price, exact SL/TP, Entry RSI, and ADX strength). The dashboard can be shrunk to "Ultra-Small" or completely disabled in the settings for a clean chart layout.How to Set Up Your Real-Time Alerts 🔔This script uses the modern alert() function call system to prevent any sync delays. To get instant alerts with your exact entry price, SL, and TP sent straight to your phone or PC:Click on the Create Alert clock icon (Alt + A).Condition: Select Stratégie SÉCURISÉE: BTC 5m Scalper Pro V4.2.Sub-Condition (Crucial): Select Any alert() function call (or Appels de fonction alert()).Trigger: Leave it on Only Once. Note: The code automatically resets itself and manages the bar-close frequency internally, so it will trigger on every valid setup!Click Create.Disclaimer: Scalping involves financial risk. Always test this script on historical data and apply proper position sizing.Chỉ báocủa manolodes18
NY Session Conviction DashboardOverview The NY Session Conviction Dashboard is a comprehensive market-state engine designed specifically for intraday futures traders (ES/NQ) executing during the New York session. Rather than generating lagging, automated buy/sell signals, this tool functions as a professional tape-reading companion. It provides a real-time, statistical framework to assess institutional conviction, market efficiency, and volume participation when price tests critical structural levels like Prior Day High/Low (PDH/PDL), Overnight High/Low (ONH/ONL), and Session VWAP. By applying a Wyckoff-inspired Effort vs. Result model, the script evaluates whether current order flow supports a structural breakout/continuation or a structural fading/rejection. Core Architecture & Components 1. Intraday Effort (Market Internals Engine) Dual Index VOLD Ratios: Tracks institutional volume deployment by calculating the dynamic ratio of advancing vs. declining volume for both the NYSE (USI:UVOL/USI:DVOL) and NASDAQ (USI:UVOLQ/USI:DVOLQ). NYSE TICK Integration: Samples centralized order flow momentum to confirm whether sudden price spikes are supported by broad market buying/selling. 2. Intraday Result (Structural Efficiency & Pressure) Kaufman-Driven Adaptive KAMA: Uses an Efficiency Ratio (ER) lookback to dynamically adjust its smoothing factor. It remains flat during erratic, noisy balance areas and turns sharply directional when true algorithmic expansion occurs. Session VWAP with ER Stabilization: Resets precisely at the NY Open (0930 EST). Features a unique initial-hour "Stabilization Event Box" based on Early Session efficiency to protect against choppy opening balancing behaviors. Candle Pressure Index (CPI): Measures the precision of close location relative to a bar's total range, filtered through an ATR noise gate to eliminate low-liquidity anomalies. 3. Institutional Absorption Detection Plots discrete, real-time exhaustion markers (X) directly on the chart when high-effort internal signatures (VOLD extremes/TICK spikes) fail to yield a directional result—classically signaling institutional absorption or passive resting liquidity behavior. Understanding the Tape Reading States The dashboard dynamically computes and displays the mathematical harmony between broad market internals and current price action, classifying the market into distinct behavioral regimes: BULL ALIGN / BEAR ALIGN (Golden State): Full harmony. Internals, Volume Ratios, TICK, CPI, and Trend Efficiency are aligned aggressively in one direction. High-conviction expansion. BULL DIV / BEAR DIV (Price Divergence): Price is flat or declining, but broad market internals are heavily positive (or vice-versa). Often leads to a sudden catch-up expansion or rotational reversal. BULL ABSORB / BEAR ABSORB: High internal volume effort is actively hitting the market, but the price trend efficiency is exceptionally low (ER < 0.30). This points to major passive limit orders blocking further progression. LEAD DIV (Leadership Divergence): NYSE and NASDAQ volume structures are actively opposing one another, indicating a split, rotation-heavy market profile. How to Use This Tool This indicator is built for discretionary execution support. Identify Your Levels Manually: Map out your key price boundaries (PDH, PDL, Daily VWAP, or high-volume nodes). Watch the Test: As price approaches a level, look down at the Tape Dashboard. Verify Conviction: * A breakout past PDH accompanied by a BULL ALIGN state implies high-probability continuation. A test of PDH accompanied by a BEAR ABSORB or BEAR DIV state indicates a structural failure, offering a high-probability mean-reversion setup back to VWAP.Chỉ báocủa immediatePerso4477316
MTF SMC Suite [FVG | Liquidity | Swings | Signals]This indicator is going to give you all the liquidity, when you can buy and when you can sell. it is going to give you also all the high and all the lows. it will be the best indicator to be able to winn on every trade. Chỉ báocủa Rwilliams_012334
5 Major Signal Strategy / 7 Candlestick Patterns ## 5 Major Signal Strategy / 7 Candlestick Patterns This strategy is based on the `HanJinSignals26` signal library and is designed to detect multiple independent candlestick reversal and momentum patterns on the chart. The strategy currently supports the following signal groups: 1. Pinbar 2. Engulfing Pattern 3. Fractal Top 4. Fractal Bottom 5. Single Harami 6. Double Harami 7. Big Body Candle Each signal can be enabled or disabled independently from the input panel. When a signal is disabled, the related library function will not be called, keeping the detection flow clean and modular. ## Core Design The main design goal of this strategy is signal independence. Each enabled signal has: * Its own detection logic * Its own chart marker * Its own strategy entry ID * Its own webhook alert tag This means that different signal types can trigger independently without depending on one shared signal result. ## Webhook Bridge The strategy also includes a webhook payload generator. When a confirmed signal appears at bar close, the strategy sends a structured JSON payload containing: * Secret key * Unique signal ID * Timestamp * Symbol * Trade side * Signal comment/tag This makes the script suitable for connecting TradingView alerts to external automation systems, bridge services, or execution engines. ## Important Notes This script is designed for signal research, automation testing, and strategy development. It is not financial advice and does not guarantee profitability. Users should always perform their own backtesting, forward testing, risk control, and parameter adjustment before using any signal in a real trading environment. ## Author Created by richardgong1988. Chiến lượccủa richardgong198813
HyperWave Trend Catcher + HTF Market StructureTest :) für meinen tollen Indikator bitte lade jetzt einfach hoch :) Chỉ báocủa AKABAO12
Smart Market Structure ProDescription: This indicator automatically detects and marks significant swing highs and swing lows using pivot-based market structure analysis. Features: Identifies Swing Highs and Swing Lows. Labels market structure as: HH (Higher High) HL (Higher Low) LH (Lower High) LL (Lower Low) Draws structure lines connecting consecutive highs and lows. Helps traders visualize trend direction and market structure. Suitable for Forex, Gold, Indices, Stocks, and Cryptocurrencies. Works on all timeframes, including 1-minute charts. How to Use: A sequence of HH and HL indicates an uptrend. A sequence of LH and LL indicates a downtrend. Use market structure breaks as potential trend reversal signals. Combine with support/resistance, moving averages, or supply and demand zones for better trade confirmation. Recommended Settings: Aggressive: Left Bars = 3, Right Bars = 3 Balanced: Left Bars = 5, Right Bars = 5 Conservative: Left Bars = 8, Right Bars = 8 Disclaimer: This indicator is for educational and analytical purposes only and should not be considered financial advice. Always use proper risk management when trading.Chỉ báocủa hamad_hamad628222751
Tableau Technique Multi-TFThe table is displayed in the top right corner. It updates in real-time at each candle close on your current chart. Colors: Bright green: Strong Buy Light green: Buy Bright red: Strong Sell Light red: Sell Gray: Neutral Note: The script uses request.security, meaning it fetches data from other timeframes even if you remain on the 1-minute chart.Chỉ báocủa MARKETYA3
MTF RSIMTF RSI Momentum Dashboard Logic: RSI > 60 → Green RSI < 40 → Red RSI 40–60 → White STATUS: CROSS UP = RSI just crossed above RSI MA(14 SMA) CROSS DOWN = RSI just crossed below RSI MA(14 SMA) ABOVE = RSI above MA BELOW = RSI below MAChỉ báocủa griffinxdigital3