Trend Momentum Confluence🇷🇺 На русском
High WR Signal — высоковероятные сигналы по тренду
Краткое описание
Индикатор для поиска точек входа с высокой вероятностью отработки. Подаёт сигнал только когда совпадают четыре независимых условия: глобальный тренд, краткосрочный тренд, разворот импульса и подтверждение момента. Работает на любом таймфрейме и любом активе.
Как работает
В основе — комбинация трёх классических инструментов: трёх EMA, RSI и MACD. Сигнал появляется только тогда, когда все они согласованы.
🟢 Сигнал ЛОНГ — выполняются одновременно:
EMA 50 > EMA 200 — глобальный тренд направлен вверх
Close > EMA 21 — цена выше краткосрочной скользящей
RSI пересекает 50 снизу вверх — импульс разворачивается в сторону покупателей
MACD гистограмма > 0 — подтверждение бычьего момента
🔴 Сигнал ШОРТ — зеркальные условия:
EMA 50 < EMA 200 — глобальный тренд вниз
Close < EMA 21 — цена ниже краткосрочной скользящей
RSI пересекает 50 сверху вниз — импульс уходит к продавцам
MACD гистограмма < 0 — подтверждение медвежьего момента
Почему высокий Win Rate
Входы только по тренду — никаких контртрендовых сделок
Сигнал требует одновременного совпадения 4 условий, что отсекает шум
RSI cross 50 ловит точку перелома силы, а не перекупленность/перепроданность
MACD служит фильтром: даже при разворотах RSI ложные сигналы отсеиваются
Возможности
⚙️ Настраиваемые периоды EMA и RSI
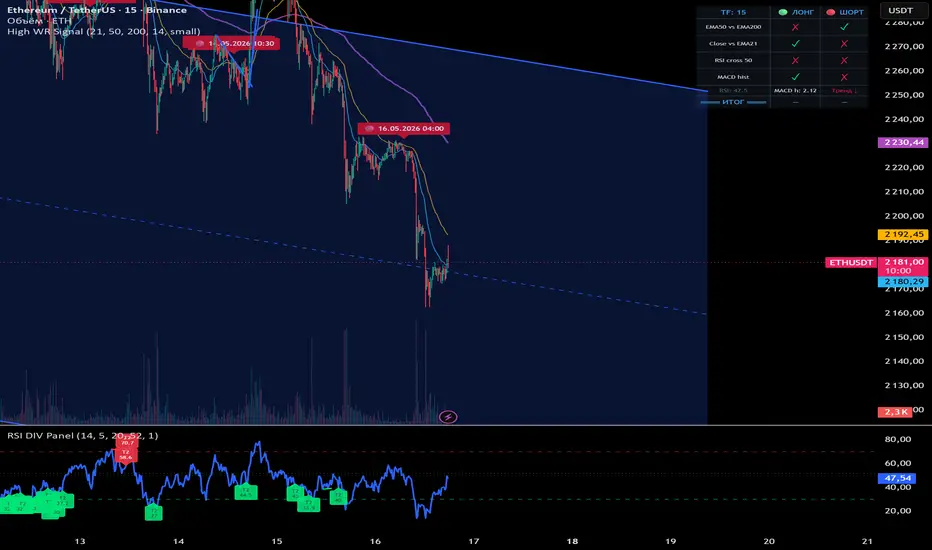
📊 Таблица текущего состояния всех условий в реальном времени
🏷️ Метки сигналов с датой и временем прямо на графике
🔔 Три типа алертов: ЛОНГ, ШОРТ и универсальный
🤖 Поддержка alert() с webhook для автоматизации (боты, биржи)
🛡️ Опция «только на закрытии свечи» — защита от repaint
🎨 Настройка размера меток и отображения EMA
Как использовать
Добавьте индикатор на график любого таймфрейма
Дождитесь появления зелёной или красной метки
Сверьтесь с таблицей в правом верхнем углу — все 4 галочки должны стоять
Для алертов: Alt+A → выберите High WR Signal → нужный сигнал → Once Per Bar Close
Алерты автоматически привязываются к таймфрейму графика: создали на 15m — будут срабатывать по 15-минутным свечам, создали на 1H — по часовым. Можно создавать сколько угодно алертов на разных ТФ параллельно.
Рекомендуемые таймфреймы: 30m, 1H, 2H, 4H. На младших ТФ возможен повышенный шум.
⚠️ Индикатор не является финансовой рекомендацией. Используйте вместе с риск-менеджментом и собственным анализом.
🇬🇧 In English
High WR Signal — High-Probability Trend Signals
Short description
An indicator that finds high-probability entry points by combining four independent confirmations: global trend, short-term trend, momentum reversal and momentum confirmation. Works on any timeframe and any asset.
How it works
Based on a combination of three classic tools: three EMAs, RSI and MACD. A signal is generated only when all of them agree.
🟢 LONG signal — all conditions met simultaneously:
EMA 50 > EMA 200 — global uptrend
Close > EMA 21 — price above short-term moving average
RSI crosses 50 upward — momentum shifts to buyers
MACD histogram > 0 — bullish momentum confirmation
🔴 SHORT signal — mirrored conditions:
EMA 50 < EMA 200 — global downtrend
Close < EMA 21 — price below short-term moving average
RSI crosses 50 downward — momentum shifts to sellers
MACD histogram < 0 — bearish momentum confirmation
Why high Win Rate
Entries are trend-aligned only — no counter-trend trades
Signal requires 4 simultaneous conditions to filter out noise
RSI crossing 50 catches the momentum shift, not overbought/oversold extremes
MACD acts as an additional filter against false RSI signals
Features
⚙️ Configurable EMA and RSI periods
📊 Real-time conditions dashboard
🏷️ Signal labels with timestamp directly on the chart
🔔 Three alert types: LONG, SHORT, and Any Signal
🤖 alert() support with webhook for automation (bots, exchanges)
🛡️ "Bar close only" option — repaint protection
🎨 Customizable label sizes and EMA display
How to use
Add the indicator to any chart and any timeframe
Wait for a green or red label to appear
Check the dashboard in the top-right corner — all 4 conditions should be ✓
For alerts: Alt+A → select High WR Signal → choose alert type → Once Per Bar Close
Alerts are automatically tied to the chart's timeframe: an alert created on 15m fires on 15-minute candles, one created on 1H fires on hourly candles. You can run multiple alerts across different timeframes in parallel.
Recommended timeframes: 30m, 1H, 2H, 4H. Lower timeframes may produce more noise.
⚠️ This indicator is not financial advice. Use together with proper risk management and your own analysis.
Chỉ báo