Multi-Indicator Screener: 30 Assets🎯 Multi-Indicator Screener: 30 Assets
Catagories:
Stocks & ETFs (default), Cryptocurrency, Commodities, Global Indices, or Custom.
Indicators:
RSI, MACD, EMA Slope, OBV Trend, Supertrend, VWAP, ADX/DMI, BB %B, Stoch RSI, Vol Delta
OVERVIEW
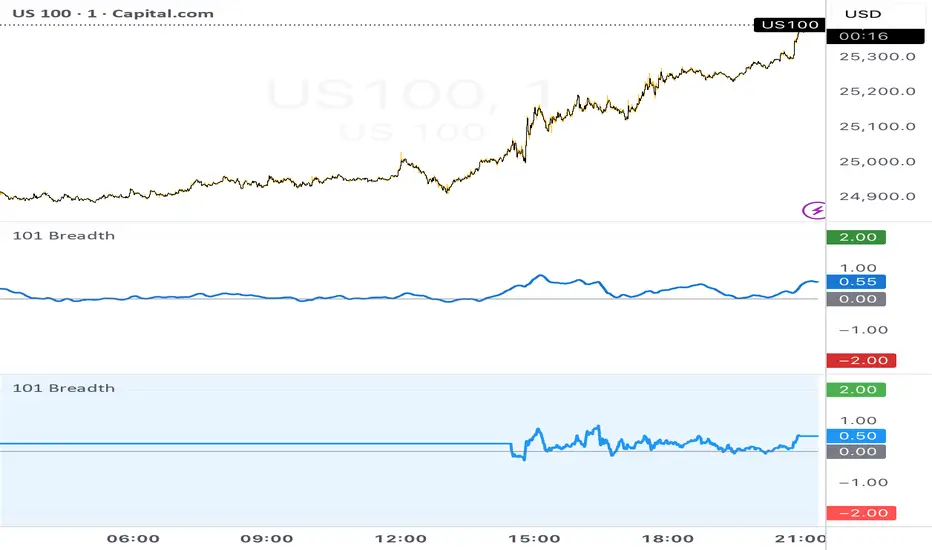
This indicator simultaneously monitors 30 customizable assets across a single chart panel, classifying each asset's momentum as Strong Bullish, Weak Bullish, Weak Bearish, or Strong Bearish — updated bar by bar. It does this across 10 selectable technical indicators, giving you a real-time breadth map of the entire market without switching charts.
Every asset is displayed as a horizontal color-coded zone stacked vertically, so you can read the mood of the full market in a single glance.
The screener is designed for traders who want to understand market-wide momentum — not just one symbol — so they can make higher-conviction decisions based on whether the broader market is confirming or diverging from their trade thesis.
Asset Categories & Watchlists
The screener includes 4 built-in asset categories that you can switch between instantly: Stocks & ETFs (default), Cryptocurrency, Commodities, and Global Indices. Each category loads a carefully curated list of 30 relevant tickers with meaningful group breakdowns in the detailed table (e.g., Mega Cap / Large Cap for crypto, Energy / Precious Metals for commodities, USA / Europe / Asia for global indices). You can also select Custom mode to manually enter any 30 symbols you want to monitor. This makes the indicator extremely versatile whether you trade stocks, crypto, futures, or international markets.
THE 10 INDICATOR MODES
You select one active indicator from the settings panel. That indicator is applied identically to all 30 assets simultaneously. The following describes exactly how each indicator classifies an asset into its four states:
RSI (Relative Strength Index)
The RSI is calculated using a user-defined length (default: 14 periods) and then compared against its own Simple Moving Average (default: 14-period SMA of the RSI).
Strong Bull — RSI is above both the 50 midline and its SMA
Weak Bull — RSI is above only one of those conditions
Strong Bear — RSI is below both the 50 midline and its SMA
Weak Bear — RSI is below only one of those conditions
This two-condition filter removes many of the false signals that a raw RSI threshold produces.
MACD (Moving Average Convergence Divergence)
Uses the standard MACD histogram (default 12/26/9).
Strong Bull — histogram is positive and increasing bar-over-bar (accelerating bullish momentum)
Weak Bull — histogram is positive but flat or declining
Strong Bear — histogram is negative and decreasing bar-over-bar (accelerating bearish momentum)
Weak Bear — histogram is negative but flat or recovering
The directional change of the histogram is the key differentiator here.
EMA Slope
Calculates a 20-period EMA and measures the actual geometric slope angle (in degrees), normalized against the asset’s 200-bar price range.
Formula: atan(ema_change / (pts_per_bar × slope_period)) × 180 / π
Strong Bull — slope angle ≥ Reference Angle (default: 45°)
Weak Bull — slope angle positive but below the threshold
Strong Bear — slope angle ≤ -Reference Angle
Weak Bear — slope angle negative but above the negative threshold
Tip: The default 45° is aggressive. Lower it to 10–15° for more frequent Strong signals. Includes division-by-zero protection for flat markets.
OBV Trend (On-Balance Volume)
Applies short and long moving averages to raw OBV (default Short=2, Long=14). MA type is user-selectable (SMA, EMA, SMMA, WMA, VWMA).
Strong Bull — short OBV MA > long OBV MA and long MA is rising
Weak Bull — short > long, but long MA is flat or declining
Strong Bear — short < long and long MA is declining
Weak Bear — short < long, but long MA is flat or rising
Pure volume-flow based momentum detection.
Supertrend
Uses Pine’s built-in Supertrend (default Factor=3.0, ATR Length=10).
Strong Bull — price above Supertrend line and rising (moving away)
Weak Bull — price above line but falling (drifting toward it)
Strong Bear — price below line and falling
Weak Bear — price below line but rising
VWAP (Volume Weighted Average Price)
Uses session VWAP (resets daily).
Best on intraday charts (1min–4H). On daily+ charts it only reflects that session’s VWAP.
Strong Bull — price > VWAP and rising
Weak Bull — price > VWAP but falling
Strong Bear — price < VWAP and falling
Weak Bear — price < VWAP but rising
ADX / DMI
Manual Wilder's calculation for independent ADX per asset (default threshold 25).
Strong Bull — +DI > -DI and ADX ≥ 25
Weak Bull — +DI > -DI but ADX < 25
Strong Bear — -DI > +DI and ADX ≥ 25
Weak Bear — -DI > +DI but ADX < 25
BB %B (Bollinger Band Percent B)
Shows where price sits inside the Bollinger Bands (default 20,2).
Strong Bull — %B ≥ 1.0 (above upper band)
Weak Bull — %B between 0.5 and 1.0
Strong Bear — %B ≤ 0.0 (below lower band)
Weak Bear — %B between 0.0 and 0.5
Stochastic RSI
Stochastic applied to RSI (defaults: RSI 14, Stoch 14, Smooth K=3, D=3).
Strong Bull — K > D and K > 50
Weak Bull — K > D or K > 50
Strong Bear — K < D and K < 50
Weak Bear — K < D or K < 50
Vol Delta
A bar-level volume delta approximation: normalized delta = (2×close − high − low) / (high − low). This value is smoothed with an EMA (default length 3) and ranges roughly from -1 to +1.
Strong Bull — smoothed delta > threshold (default 0.3) and accelerating upward
Weak Bull — smoothed delta > 0 but below threshold or decelerating
Strong Bear — smoothed delta < -threshold and accelerating downward
Weak Bear — smoothed delta < 0 but above -threshold or decelerating
This mode approximates institutional buying/selling pressure within each bar and becomes more accurate on higher-resolution charts.
THE VISUAL SYSTEM
Stacked Zone Layout: 30 horizontal step-lines with adjustable height and gap.
Streak-Based Color Intensity: Color strength reflects how many consecutive closed bars an asset has stayed in its current state.
4 Color Palettes: Classic, Colorblind Safe, Ice & Fire, Monochrome.
3 Color Styles: Standard, Traffic Light, Hue Shift.
Divergence Highlighting: Assets moving against the overall market are highlighted in gold (solid for strong, semi-transparent for weak).
Total Market Line: Thick line at the top showing aggregate market momentum.
Dashboard Table: Momentum score (0–100), market status (including true “MIXED”), counts with delta arrows, and optional detailed sector/group breakdown.
Mini Heatmap: Compact 30-cell color strip at the bottom with ticker labels.
ALERTS
Four configurable alerts (all individually togglable):
Strong Bullish momentum (minimum number of assets)
Strong Bearish momentum
Market sentiment shift
Extreme conditions (≥60% assets in Strong Bull or Strong Bear)
Alerts fire only on confirmed bars.
DEFAULT ASSETS
The built-in presets include Stocks & ETFs (default), Cryptocurrency, Commodities, and Global Indices. In “Stocks & ETFs” mode you get a balanced mix of broad market, sectors, Magnificent 7, key stocks, thematic, and macro assets. All 30 tickers are fully customizable.
INTENDED USE
This is a market breadth and momentum classification tool, not a direct signal generator. Use it to:
Confirm broad market support for your trade direction
Spot early sector rotation
Identify diverging assets
Compare how different indicators are reading the same market
Time entries/exits based on momentum score and delta changes
Works on any timeframe. For best results with VWAP and Vol Delta, prefer intraday charts.
Chỉ báo