Dashboard Pro | RSI - Fib - S/R - VolumeOverview
MTF Dashboard Pro is a multi-timeframe confluence engine that scans four timeframes simultaneously — 15-minute, 1-hour, 4-hour, and daily — and evaluates four independent technical conditions on each one. When all conditions align in the same direction, the dashboard issues a high-conviction LONG or SHORT signal. Everything is displayed inside a professional color-coded table directly on your chart, with optional S/R lines and a projected Golden Zone overlay.
What makes this different
Most multi-timeframe dashboards simply display RSI or MACD values across timeframes and leave interpretation to you. This indicator goes further: it defines explicit bullish and bearish conditions for each metric, scores them per timeframe, and only triggers a signal when a configurable number of conditions agree. The result is a systematic, rules-based directional bias — not a subjective reading of scattered numbers.
The four conditions
Each timeframe is scored on these four independent tests:
1 — RSI Momentum (Default: 14-period)
RSI above 50 registers as bullish. RSI below 50 registers as bearish. This captures the underlying momentum direction without relying on overbought/oversold extremes, which lag in trending markets.
🟢 Bullish: RSI > 50
🔴 Bearish: RSI < 50
2 — Fibonacci Golden Zone (0.618 – 0.786)
Calculated from the highest high and lowest low of the last N candles (default: 20 bars). The Golden Zone sits between the 0.618 and 0.786 Fibonacci retracement levels of that range. Price position relative to this zone determines the condition:
🟢 Bullish: Price at or above the 0.618 level (inside or above the Golden Zone)
🔴 Bearish: Price below the 0.618 level (rejected from the zone)
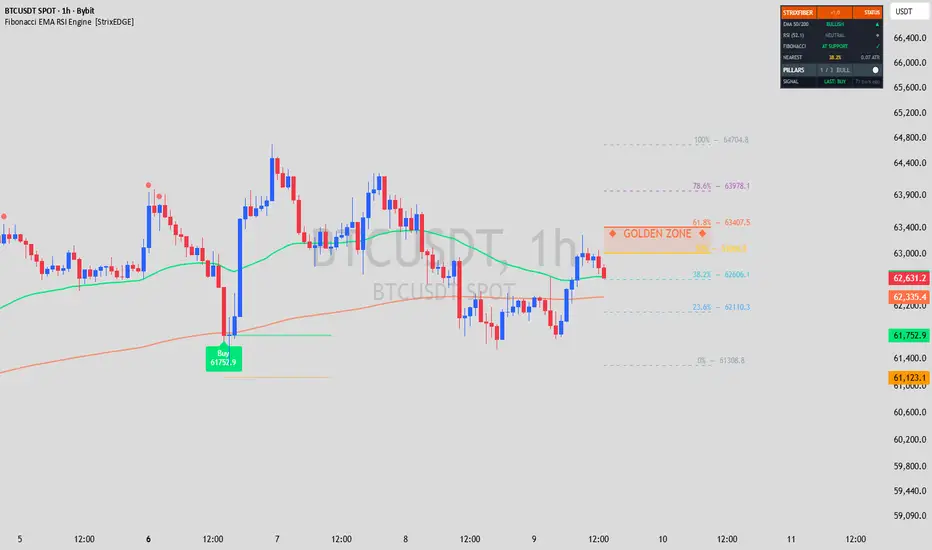
The Golden Zone is drawn on the chart as a projected box extending 20 bars to the right of the current candle, with dashed borders at 0.618 and 0.786, and a dotted midline at 0.702.
3 — Support / Resistance Positioning
Strong Support is the lowest low of the lookback period. Strong Resistance is the highest high. The midpoint between them defines the range center.
🟢 Bullish: Price above the midpoint (upper half of range — strength)
🔴 Bearish: Price below the midpoint (lower half of range — weakness)
Support and Resistance lines are drawn on the chart starting from the exact candle where the high or low occurred, extending to the right of the current bar. A subtle zone band (ATR-based) highlights each level as a zone rather than a single line.
4 — Volume Confirmation (USDT-denominated)
Volume is calculated as volume × close to approximate USDT-denominated volume. This is compared against a simple moving average (default: 20 periods).
🟢 Confirmed: Current volume above the average
🔴 Not confirmed: Current volume below the average
Volume confirmation applies equally to both LONG and SHORT signals — high volume validates the move regardless of direction.
Signal logic
For each timeframe, the indicator counts how many of the four conditions are bullish and how many are bearish.
LONG ▲ — Triggered when the bullish count reaches the minimum threshold (default: 4 out of 4)
SHORT ▼ — Triggered when the bearish count reaches the minimum threshold
NEUTRAL — Mixed conditions, no clear directional consensus
You can lower the threshold to 3 for more frequent signals with slightly less conviction, or keep it at 4 for maximum confluence.
Dashboard table
The on-chart table displays 13 rows across 5 columns (one label column + four timeframe columns):
Row 1 — RSI value with color-coded background (green > 50, red < 50)
Row 2 — Golden Zone status: ABOVE, IN ZONE, or BELOW
Row 3 — Golden Zone price range (0.618 and 0.786 levels)
Row 4 — Strong Support price (green text)
Row 5 — Strong Resistance price (red text)
Row 6 — S/R Position: BULLISH or BEARISH
Row 7 — Volume USDT with formatted K/M/B suffix
Row 8 — Individual condition checklist (✓ or ✗ for each of the 4 conditions)
Row 9 — Score (e.g. "4/4 BULL" or "3/4 BEAR")
Row 10 — Final signal: LONG ▲ / SHORT ▼ / NEUTRAL
Every data cell is background-colored to show its directional bias at a glance. Hover over any label cell to see a tooltip explaining the logic.
Chart overlay
Strong Support and Strong Resistance are drawn as horizontal lines originating from the exact candle where the extreme price occurred within the lookback period. Each line includes a subtle zone band for visual clarity and price labels at the right edge.
The Golden Zone is projected as a filled box extending 20 bars to the right of the current candle. The box includes dashed borders at 0.618 and 0.786, a dotted midline at 0.702, and a centered "GOLDEN ZONE" label.
You can choose which timeframe's levels to display on the chart — Current, 15M, 1H, 4H, or Daily. When plotting a higher timeframe on a lower timeframe chart, bar offsets are automatically scaled to the correct chart positions.
Settings
Table Display
— Position: 9 options (Top/Middle/Bottom × Left/Center/Right)
— Text Size: Tiny, Small, Normal, Large
Indicator Settings
— RSI Period: Default 14 (range 2–100)
— S/R and Golden Zone Lookback: Default 20 bars (range 5–500)
— Volume SMA Period: Default 20 (range 2–200)
Signal Logic
— Minimum Conditions: Default 4 (range 1–4). Controls how many conditions must agree for a signal.
Chart Lines
— Show/Hide toggle for all chart drawings
— Timeframe selection for plotted levels
— Individual color pickers for Support, Resistance, and Golden Zone
— Line width and style (Solid, Dashed, Dotted)
— Show/Hide price labels
— Golden Zone fill toggle and transparency control
Alerts
10 pre-configured alert conditions:
— LONG and SHORT alerts for each individual timeframe (8 alerts)
— "Any TF LONG" — fires when at least one timeframe triggers LONG
— "Any TF SHORT" — fires when at least one timeframe triggers SHORT
Set these up in TradingView's alert dialog to receive notifications when signals change.
Best practices
— Use this as a confluence filter alongside your own price action analysis, not as a standalone entry signal.
— When multiple timeframes show the same signal simultaneously, conviction is significantly higher than a single-timeframe signal.
— For crypto pairs, the Volume USDT calculation is most accurate. For forex and equities, the volume column still shows relative volume strength but does not represent actual USDT value.
— The 20-bar lookback on a 15-minute chart covers roughly 5 hours. On a daily chart, it covers 20 trading days. Keep this asymmetry in mind when comparing timeframe signals.
— Start with the default threshold of 4/4 to learn the indicator's behavior before experimenting with lower thresholds.
Disclaimer
This indicator is a technical analysis tool for educational and informational purposes. It does not constitute financial advice, and past performance does not guarantee future results. Always use proper risk management. Never risk capital you cannot afford to lose. The signals generated are mathematical calculations based on historical price and volume data and should be used as one component of a broader, well-tested trading strategy.
Chỉ báo