BOTMAN STRATEGYThis indicator is made and updated daily by BOTMAN, Follow us on Tradingview to be notified for new updates.Chỉ báocủa SPXHERO1Cập nhật 11666
SMC Fusion Indicator v1SMC Fusion Indicator Overview SMC Fusion Indicator is an original market structure tool designed to help traders identify trend shifts and key Smart Money Concepts (SMC) events in a clean and easy-to-read format. Instead of filling the chart with unnecessary objects, the indicator focuses on highlighting important structural changes that can assist with market analysis and trade planning. --- Features Market Structure - Higher High (HH) - Higher Low (HL) - Lower High (LH) - Lower Low (LL) The indicator automatically identifies swing highs and swing lows to display the current market structure. Break of Structure (BOS) A BOS is displayed when price breaks the previous confirmed swing in the direction of the current trend, indicating potential trend continuation. Change of Character (CHoCH) A CHoCH is displayed when price breaks the previous swing against the current trend, signaling a possible market reversal or shift in direction. Visual Labels - Green labels indicate bullish structure. - Red labels indicate bearish structure. - Orange labels highlight CHoCH events. - Clear labels keep the chart readable without excessive clutter. Alerts Built-in alert conditions allow traders to receive notifications whenever a bullish or bearish market structure event occurs. --- How to Use Bullish Scenario 1. Wait for a bullish CHoCH after a downtrend. 2. Watch for a bullish BOS confirming the new trend. 3. Use your own confirmation before entering a trade. Bearish Scenario 1. Wait for a bearish CHoCH after an uptrend. 2. Watch for a bearish BOS confirming the trend change. 3. Use proper risk management before entering a position. --- Recommended Timeframes The indicator can be used on any timeframe, including: - 1 Minute - 5 Minute - 15 Minute - 1 Hour - 4 Hour - Daily Higher timeframes generally produce stronger market structure signals. --- Risk Disclaimer This indicator is designed as a market analysis tool and should not be considered financial or investment advice. No indicator guarantees profitable trades. Always use proper risk management and combine this tool with your own trading strategy and market analysis. --- Version Current Release: SMC Fusion Indicator v1 Future updates may include: - Order Blocks - Fair Value Gaps (FVG) - Liquidity Sweeps - Equal Highs & Equal Lows - Premium & Discount Zones - Multi-Timeframe Analysis - Additional alert options Thank you for using SMC Fusion Indicator. Your feedback and suggestions are always appreciated.Chỉ báocủa ReubenMilesCập nhật 55
Smoothed Heiken Ashi Strategy v1Lógica pedida: • Vela ROJA del indicador -> cierra compras / entra en VENTA (confirmación) • Se mantiene en venta hasta que aparece una vela VERDE (cierra la venta) • Entra en COMPRA cuando aparece la 2a vela verde consecutiva • Simétrico para las ventas (2a vela roja consecutiva = entrada corta) "Velas de confirmación" = 2 por defecto (la 2a vela del nuevo color abre posición). Cámbialo a 1 si quieres entrar con la primera vela.Chiến lượccủa yovanygarcia8716
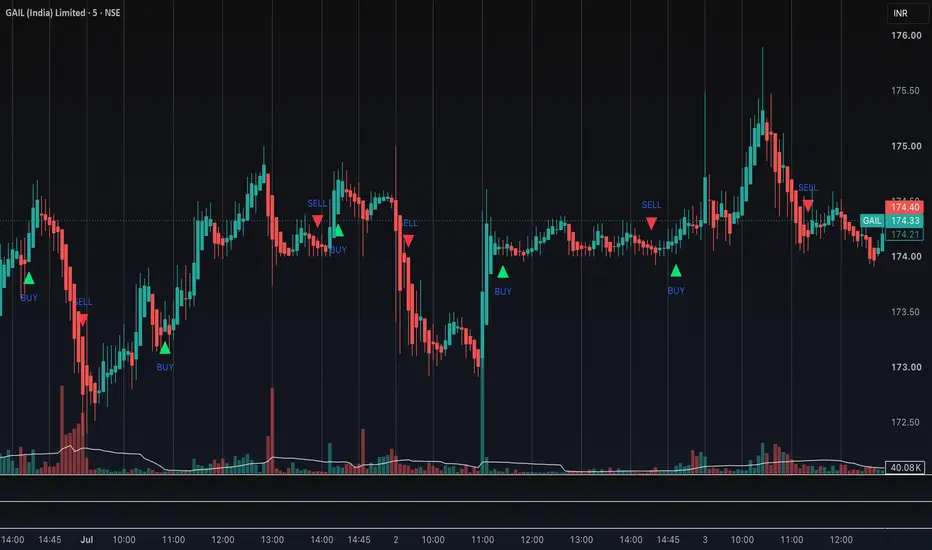
Hilega-Milega BUY SELL Signals # Hilega-Milega BUY SELL Signals ## Overview Hilega-Milega BUY SELL Signals is a momentum-based indicator built on the Relative Strength Index (RSI). It combines the RSI with a fast Exponential Moving Average (EMA) and a slow Weighted Moving Average (WMA) to identify potential bullish and bearish trend changes. The indicator is designed to help traders identify high-probability intraday trading opportunities by filtering signals with both momentum and trend confirmation. --- ## How the Indicator Works ### 1. RSI (Relative Strength Index) The indicator first calculates a 9-period RSI from the selected price source. * RSI above 50 indicates bullish momentum. * RSI below 50 indicates bearish momentum. The 50 level acts as the primary trend filter. --- ### 2. EMA (3) of RSI A 3-period Exponential Moving Average is applied to the RSI. The EMA reacts quickly to changes in momentum and represents the short-term direction of the RSI. --- ### 3. WMA (21) of RSI A 21-period Weighted Moving Average is also applied to the RSI. The WMA moves more slowly than the EMA and represents the broader momentum trend. --- ### 4. RSI Background Color The indicator colors the RSI area to provide quick visual confirmation of trend direction. * **Red Background:** RSI is above 50 (Bullish Momentum) * **Aqua Background:** RSI is below 50 (Bearish Momentum) This allows traders to identify the prevailing momentum at a glance. --- ## Buy Signal A BUY signal is generated only when all of the following conditions are satisfied: * The 21-period WMA crosses above the RSI 50 level. * The 3-period EMA is above the 21-period WMA. * The RSI is above 50. This combination indicates that both short-term and medium-term momentum have aligned in the bullish direction. A BUY label is displayed on the chart when these conditions occur. --- ## Sell Signal A SELL signal is generated only when all of the following conditions are satisfied: * The 21-period WMA crosses below the RSI 50 level. * The 3-period EMA is below the 21-period WMA. * The RSI is below 50. This indicates that bearish momentum has been confirmed. A SELL label is displayed on the chart when these conditions occur. --- ## Alerts The indicator provides TradingView alert conditions for both BUY and SELL signals. These alerts can be used for: * Pop-up notifications * Mobile notifications * Email alerts * Webhook automation --- ## Recommended Timeframes This indicator works on multiple timeframes, including: * 3 Minute * 5 Minute * 15 Minute * 30 Minute * 1 Hour It is particularly useful for intraday trading. --- ## Recommended Markets The indicator can be used on: * Stocks * Index Futures * Index Options * ETFs * Forex * Commodities * Cryptocurrencies --- ## Best Practice For improved trade quality, use this indicator together with: * Support and Resistance * Volume Analysis * VWAP * Higher Timeframe Trend * Risk Management Avoid taking trades solely based on a single signal. --- ## Disclaimer This indicator is designed by NK Sir as a technical analysis tool and should not be considered financial or investment advice. I Just Added BUY ,SELL Signals For Educational Purpose only .Please Add Hilega -Milega Indicator below your Chart to confirm Signals . Always perform your own analysis and use appropriate risk management before entering any trade. Chỉ báocủa cherryprasaad23
Quantum Trend SignalQuantum Trading Indicator Quantum Trading Indicator is a multi-factor trend and momentum analysis tool designed to help traders identify high-probability trading opportunities while reducing market noise. Instead of relying on a single indicator, it combines several technical concepts into one decision-making system. How It Works The indicator evaluates market conditions using a confluence of signals, including: - Trend Analysis: Identifies the dominant market direction to help traders trade with the prevailing trend. - Momentum Confirmation: Measures buying and selling pressure to filter out weak setups. - Volatility Filter: Detects whether market conditions are suitable for trading and avoids low-volatility periods that often produce false signals. - Signal Validation: Generates Buy and Sell signals only when multiple conditions align, increasing signal quality and reducing unnecessary entries. - Dynamic Risk Levels: Displays adaptive stop-loss and target levels based on current market volatility to support disciplined risk management. Key Features - Multi-factor signal confirmation - Trend-following market analysis - Momentum and volatility filtering - High-quality Buy & Sell signals - Non-repainting signal logic - Suitable for Forex, Crypto, Stocks, Indices, and Commodities - Compatible with scalping, intraday, swing, and position trading - Customizable settings for different trading styles and timeframes Best Practices For improved decision-making, use the Quantum Trading Indicator alongside sound risk management, price action analysis, and key support and resistance levels. No indicator can guarantee profitable trades, and traders should always confirm signals within their own trading plan. Trade with discipline. Trade with confidence. Trade with Quantum.Chỉ báocủa ReubenMilesCập nhật 22490
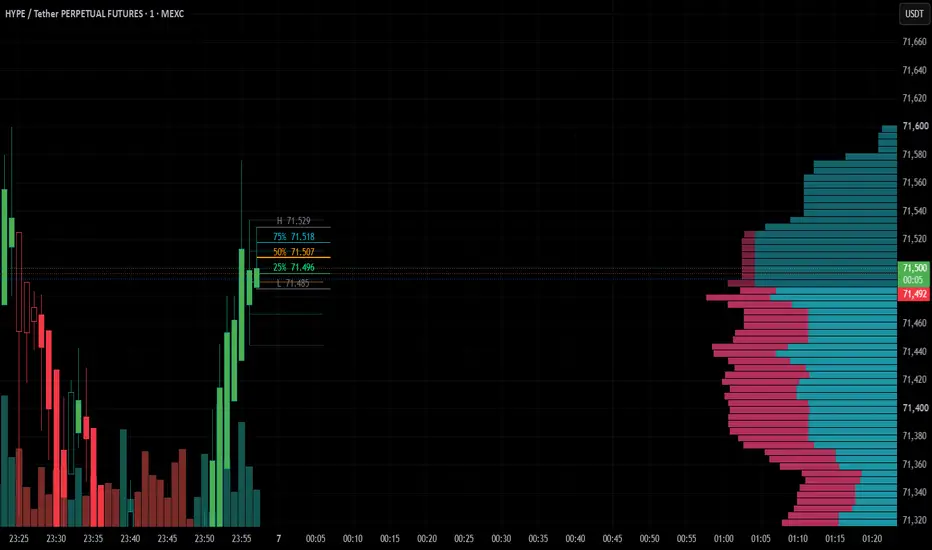
Niveles de la Vela Actualmarca los niveles de la vela actual, solo 1 minuto: 0.00 (Low) → Gris 0.25 → Verde 0.50 → Naranja (más gruesa) 0.75 → Azul 1.00 (High) → GrisChỉ báocủa pmclassikCập nhật 11
BTC 8AM Pattern Breakout Instant Entryheyyyyyyy this us tgev profiutsble stratrgy wer are here to show how 8 am strategy will trade effectively and Chiến lượccủa abhijeetkawale23
XAU Clear EMA ATR Strategy TP SL Voice V6 Clean TPXAU Clear EMA ATR Strategy TP SL Voice V6 Clean TP is a strategy designed for XAU/USD with a clean visual layout and simplified target display. The strategy uses two EMA moving averages to identify trend direction and ATR volatility to calculate adaptive Stop Loss and Take Profit levels. BUY signals are generated when price confirms a move back above the fast EMA while the fast EMA is above the slow EMA. SELL signals are generated when price confirms a move back below the fast EMA while the fast EMA is below the slow EMA. The Stop Loss is based on ATR, allowing it to adapt to current market volatility. The strategy includes five Take Profit levels, but instead of long chart-wide TP lines, the targets are displayed as short horizontal levels near the entry area for a cleaner chart. TP1 and TP2 are treated as stronger targets, TP3 as a continuation target, and TP4/TP5 as aggressive targets for stronger moves. Main features: - EMA trend confirmation - ATR-based Stop Loss - Five Take Profit levels - Short and clean TP lines - Less visible TP labels - Clear BUY / SELL entry labels - Voice alert messages for BUY and SELL - Designed for XAU/USD Recommended timeframes: 5M, 15M, and 30M.Chiến lượccủa ionplesu8829
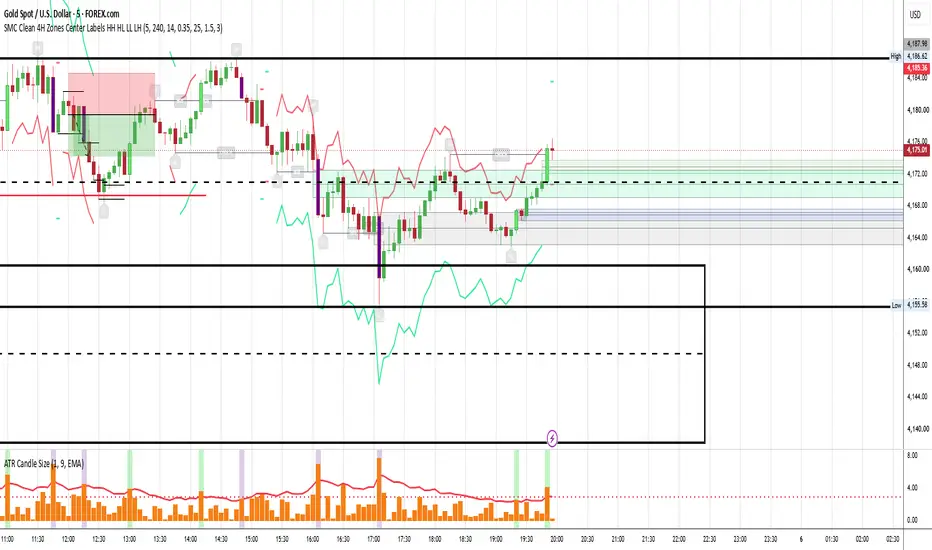
SMC Clean 4H Zones Center Labels HH HL LL LHSMC Clean 4H Zones Center Labels HH HL LL LH is a Smart Money Concepts strategy designed to keep the chart clean while displaying the most important institutional price action zones and structure levels. The script includes Fair Value Gaps (FVG), Inverted Fair Value Gaps (IFVG), Order Blocks (OB), Breakers, Break of Structure (BOS), Change of Character (CHOCH), and market structure labels such as HH, HL, LH, and LL. Supply and Demand zones are calculated from the 4H timeframe and displayed as clean boxes on the chart. The zone names are centered inside the boxes for better visibility and easier reading. BOS and CHOCH are displayed with neutral grey structure lines and centered labels, avoiding aggressive directional colors. Order Blocks also include a 50% middle line with the OB label placed directly on the midline. The indicator is designed to reduce visual noise by using transparent boxes, small neutral labels, and filtered FVG logic based on ATR size. This helps highlight only cleaner and more meaningful zones. Main features: - 4H Supply and Demand zones - FVG and IFVG detection - 50% midpoint levels - Order Blocks and OB Breakers - BOS and CHOCH structure breaks - HH, HL, LH, LL market structure labels - ATR-filtered FVGs for cleaner signals - Strategy entries based on SMC confluence - ATR-based Stop Loss and Take Profit levels Recommended markets: XAU/USD, major forex pairs, indices, and liquid crypto pairs. Recommended timeframes: 5M, 15M, 30M, and 1H.Chiến lượccủa ionplesu8829
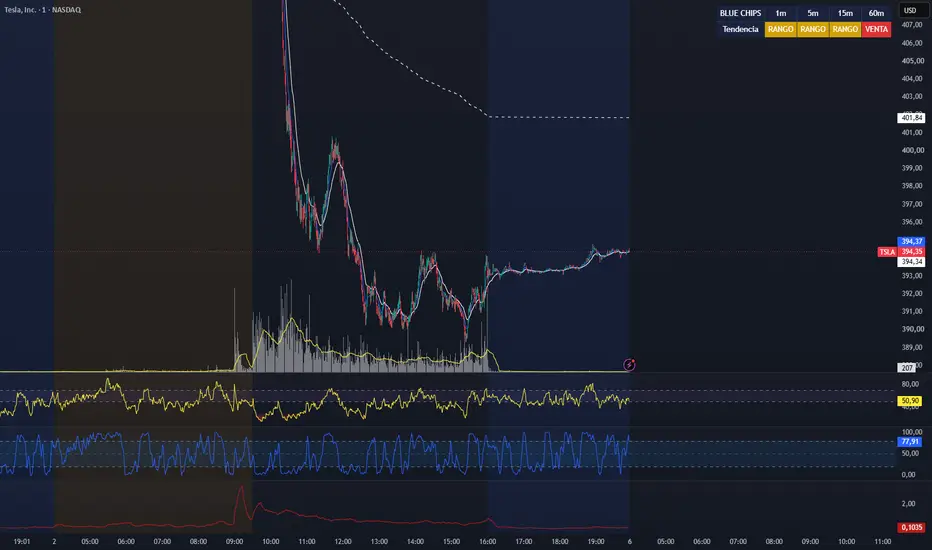
Matriz Blue Chips - Day TradingTendencia en temporalidades bajas day trading para acciones NasdaqChỉ báocủa cris84426-messi110
MACD Market Stage + Hybrid Divergence - TP## MACD Market Stage + Hybrid Divergence This indicator is a customized version of the classic **MACD** concept commonly available on TradingView. Credit goes to TradingView and the original MACD indicator framework. This version adds simple table readings, momentum stages, custom histogram colors, and optional divergence lines to make MACD easier to interpret at a glance. The goal of this tool is not to predict the future, but to help traders better understand the current momentum condition of the market. ## What This Indicator Shows This indicator displays: MACD line Signal line MACD histogram Momentum reading table Market stage reading Optional bullish and bearish divergence lines The histogram colors help show whether momentum is increasing or fading. ## How To Read It When the histogram is above zero and growing, bullish momentum is expanding. When the histogram is above zero but shrinking, bullish momentum is weakening. When the histogram is below zero and moving lower, bearish momentum is expanding. When the histogram is below zero but improving, bearish momentum is weakening. ## Table Readings The table summarizes the MACD condition in simple terms. **Signal** shows whether bullish or bearish momentum is currently leading. **Market Stage** shows the broader momentum phase. **Stage Bias** gives a plain-language interpretation of the current stage. ## Market Stages **Stage 1 Momentum Base** Bearish momentum is weakening and the market may be trying to recover. **Stage 2 Bullish Momentum Expansion** Bullish momentum is strengthening and buyers are currently leading. **Stage 3 Momentum Distribution** Bullish momentum is still present, but it is starting to fade. **Stage 4 Bearish Momentum Expansion** Bearish momentum is strengthening and sellers are currently leading. **Market Transition** Momentum is mixed or unclear. ## Divergence The optional divergence feature compares price action with the MACD line. A **bullish divergence** may appear when price makes a lower low, but MACD makes a higher low. A **bearish divergence** may appear when price makes a higher high, but MACD makes a lower high. Divergence should not be used alone. It is best used together with price structure, support and resistance, trend, and risk management. ## How To Use Use this indicator to quickly check whether momentum is expanding, weakening, or transitioning. It may be useful for: Confirming trend momentum Spotting possible momentum weakness Reading MACD conditions faster Finding possible divergence areas Supporting a broader trading plan ## Important Note This indicator is for educational and informational purposes only. It does not provide financial advice, buy signals, or sell signals. No indicator can guarantee future results. Always use proper risk management and your own analysis before making trading decisions. Chỉ báocủa TradersPodCập nhật 22
Dashboard Leyendas con Filtro QQQ - NASDAQ Estrategia de las Leyendas del Trading con indicador de tendencia del NASDAQChỉ báocủa cris84426-messi112
All in One ICT ## NY Time Open Levels + NWOG + NDOG + RTH ORG + Killzones A multi-concept ICT/SMT-style toolkit built around New York time, combining daily/weekly opening gaps, regular-trading-hours opening range gaps, and the major trading session killzones — all in one indicator. **Features:** **📍 Intraday Open Levels** Dotted horizontal lines marking the open price at key times each day: 00:00, 02:00, 08:30, 09:30, 10:00, and 18:00 (New York time). Each fully toggleable. **🟧 NWOG — New Week Opening Gap** Marks the gap between Friday's ~16:59 close and the market's next 18:00 reopen (Sunday or Monday). Drawn as a shaded box with a midline. **🟦 NDOG — New Day Opening Gap** Marks the gap between each trading day's ~16:59 close and that same day's 18:00 reopen (the daily futures/forex maintenance-break gap) — every day except Friday, which feeds the NWOG instead. **🔷 EHPDA** The 50% midpoint between the facing edges of consecutive NWOG boxes, plotted as a dashed aqua line — useful for tracking a running "fair value" reference between weekly gaps. **🎨 RTH ORG — Regular Trading Hours Opening Range Gap** The gap between the prior day's 16:14 close and the next 09:30 RTH open. Drawn as two lines (upper/lower) with no box, color-coded by the originating weekday (Fri = red, Mon = lime, Tue = aqua, Wed = fuchsia, Thu = orange) so you can see at a glance which day's gap you're looking at. Weekend closes are excluded, and only the most recent trading week's worth is kept on the chart. **⏱️ Killzones** The core ICT session windows, each drawn as a simple top/bottom line bracket around the session's high and low (no box): - Asian: 20:00 – 00:00 - London: 02:00 – 05:00 - New York AM: 08:30 – 11:30 - Lunch: 11:30 – 13:30 - New York PM: 13:30 – 16:00 Lines build live as each session develops and freeze in place once it ends — they don't stretch forward with price. **⚙️ Settings** All timezone-based logic runs on America/New_York time by default, with an optional manual UTC offset override. Every gap type and killzone has its own show/hide toggle and a "how many to keep" control so your chart doesn't get cluttered with old history. *This indicator is for informational and educational purposes only and does not constitute financial advice. Past gap/session behavior does not guarantee future results.* Chỉ báocủa OscarShalo99Cập nhật 41
XAU Clear EMA ATR Strategy TP SL Voice V6XAU Clear EMA ATR Strategy TP SL Voice is a strategy designed for XAU/USD. It uses two EMA moving averages to identify market direction and ATR volatility to calculate clear Stop Loss and Take Profit levels. BUY signals appear when price confirms a move back above the fast EMA while the fast EMA is above the slow EMA, showing bullish market conditions. SELL signals appear when price confirms a move back below the fast EMA while the fast EMA is below the slow EMA, showing bearish market conditions. The Stop Loss is calculated using ATR, making it adaptive to current volatility. The strategy includes five Take Profit levels: TP1 STRONG and TP2 STRONG: higher-probability targets. TP3 GOOD: trend continuation target. TP4 and TP5 AGGRESSIVE: extended targets for stronger market moves. The chart clearly displays: BUY ENTRY / SELL ENTRY STOP LOSS TP1, TP2, TP3, TP4 and TP5 The script also includes TradingView-ready voice alert messages for BUY and SELL signals. Example Screenshots: Example 1: BUY Setup The chart shows a confirmed BUY ENTRY after price moves above the fast EMA in a bullish trend. The blue line marks the entry, the red line marks Stop Loss, and the green/yellow/orange lines show TP1 to TP5. Example 2: SELL Setup The chart shows a confirmed SELL ENTRY after price moves below the fast EMA in a bearish trend. The Stop Loss is placed above entry using ATR, while TP levels are projected below the entry. Example 3: TP Levels TP1 and TP2 are marked as STRONG targets, TP3 as a GOOD continuation target, and TP4/TP5 as AGGRESSIVE targets for stronger trend movement. Recommended markets: XAU/USD Recommended timeframes: 5M, 15M, 30MChiến lượccủa ionplesu8879
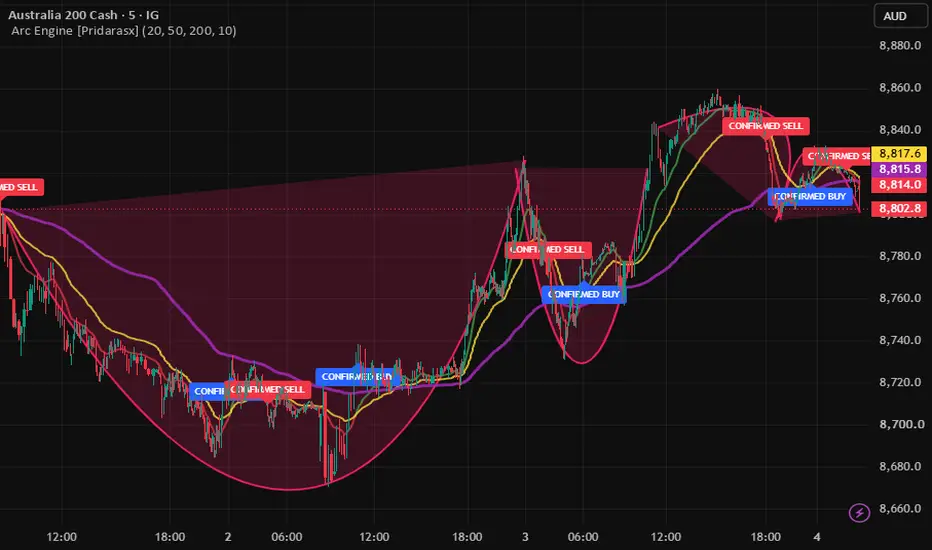
Arc Engine Executive Summary Arc Engine - is a high-performance, non-repainting quantitative trading script engineered specifically for intraday market structures. The engine is architected to exploit the fractal geometry of financial markets by tracking systematic cycles of expansion and contraction (represented visually as macro structural "arcs"). By mapping the footprints of high-frequency trading (HFT) models and institutional order execution routing, the engine isolates structural exhaustion zones, filters out toxic market noise, and targets explosive breakouts with mechanical precision. Core System Architecture & Multi-Layer Logic- The engine structures market data into a clean, hierarchical multi-layered framework designed to eliminate emotional bias and lag: LAYER 1: THE MACRO BASELINE ANCHOR (200 EMA) | | Defines the structural environment (Dominant Cycle Slope) | +------------------------------------------------------------+ │ ▼ +------------------------------------------------------------+ | LAYER 2: INSTITUTIONAL RIBBON MATRIX (20 EMA / 50 EMA) | | Maps short-to-medium term value capture & contraction zones| +------------------------------------------------------------+ │ ▼ +------------------------------------------------------------+ | LAYER 3: CLEAN BREAKOUT FILTER (Execution Trigger) | | Enforces strict structural clearance rules (No Fake Wicks) | +------------------------------------------------------------ 1. The Macro Baseline Anchor (Layer One) At the core of the engine sits the 200-period Exponential Moving Average (EMA). Serving as the system's "gravitational center," this line distinguishes between macro expansion and structural mean reversion. In a heavy downward cycle or macro arc formation, this boundary represents the institutional ceiling where short-sellers repeatedly defend liquidity. 2. The Institutional Ribbon Matrix (Layer Two) The intermediate structural behavior is governed by a smoothed ribbon matrix comprising the 20 EMA (Fast Line) and 50 EMA (Slow Line). The Squeeze Zone: When these lines compress, flatten, and twist, the engine identifies a low-volatility compression zone (e.g., Wave 2 or Wave B structures). The Expansion Phase: When the ribbon fans out with a steep slope, it confirms true algorithmic momentum (e.g., Wave 3 or Wave C expansions). 3. The Clean Breakout Filter (Layer Three) To mitigate the risk of algorithmic "liquidity hunts" (where market makers intentionally trigger retail stops via volatile wicks before reversing price), the engine abandons standard line crossovers. Execution requires a Clean Candle Breakout: Long Trigger: The entire body (both the open and the close) of the execution candle must clear completely above the highest boundary of the Ribbon Matrix. Short Trigger: The entire body of the candle must close completely below the lowest boundary of the Ribbon Matrix. Algorithmic State Control & Execution Mechanics Signal Pruning & Noise Reduction To avoid the mathematical trap of "signal stacking" during high-volatility expansions, the script utilizes a strict persistent state variable architecture (last Signal Direction). Execution Framework- The engine is highly optimized for lower timeframes (such as the 1-minute, 2-minute, or 5-minute charts) to capture micro-turns with minimal drawdown. By implementing the bar state is confirmed runtime condition, the engine evaluates execution rules exclusively at the exact millisecond a bar closes. This mathematically eliminates historical repainting, ensuring back testing performance matches live execution identically. Chỉ báocủa PridarasxCập nhật 31
Bolling Band Breakout with Volume The indicator is designed to show volume above 2 standard deviations to show a breakout after a Bollinger Band Squeeze. Chỉ báocủa pbar1966Cập nhật 10
Delta Only-bkTracks bar‑by‑bar delta and cumulative net delta to reveal buying and selling aggression. Helps traders understand order flow pressure and directional strength through real‑time delta behavior.Chỉ báocủa balakn5
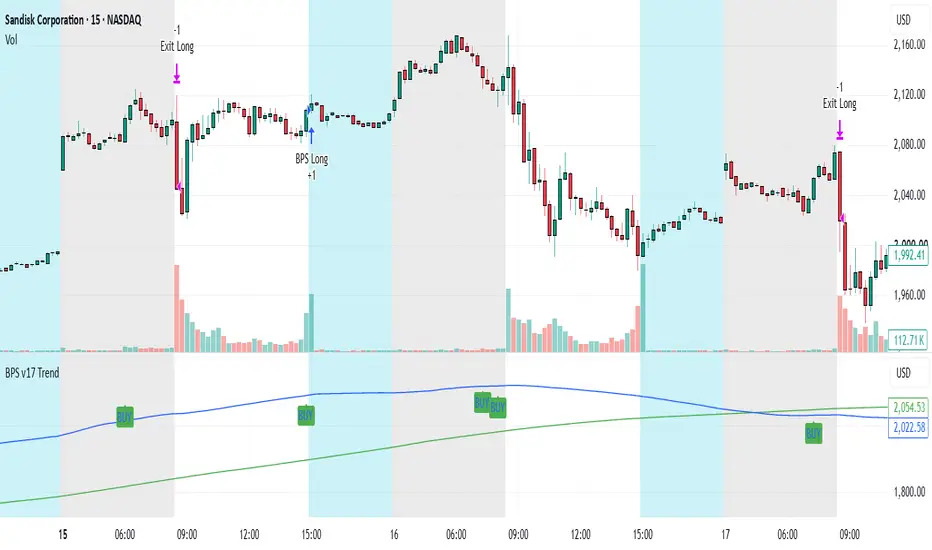
BPS v17 - Strong Trend FilterApproximates institutional ("big player") sentiment by combining positioning flows, breadth, valuations, momentum, volume, risk, and trend protection. It generates clear BUY (green) or SELL (red) signals to identify rotation and accumulation/distribution zones. Ideal for filtering trades, especially options premium selling in value/rotation stocks.Chiến lượccủa georgefushi10
BPS v17 - Strong Trend FilterBig Player Flow to calculate player sentiment. Approximates institutional ("big player") sentiment by combining positioning flows, breadth, valuations, momentum, volume, risk, and trend protection. It generates clear BUY (green) or SELL (red) signals to identify rotation and accumulation/distribution zones. Ideal for filtering trades, especially options premium selling in value/rotation stocks.Chiến lượccủa georgefushi7
Big Player Sentiment v7 - Trend ProtectedBig Player Sentiment v7 – Indicator Name: Big Player Sentiment v7 Type: Non-overlay pane indicator (appears below the price chart) Purpose: Approximates institutional ("big player") sentiment by combining positioning flows, breadth, valuations, momentum, volume, risk, and trend protection. It generates clear BUY (green) or SELL (red) signals to identify rotation and accumulation/distribution zones. Ideal for filtering trades, especially options premium selling in value/rotation stocks. How It Works (Overall) A single blue line (smoothed sentiment score) oscillates around zero. Crossing above +0.35 with supporting volume → Big Player BUY (green background + label). Crossing below -0.5 while below the 200-day MA → Big Player SELL (red background + label). Chỉ báocủa georgefushi37
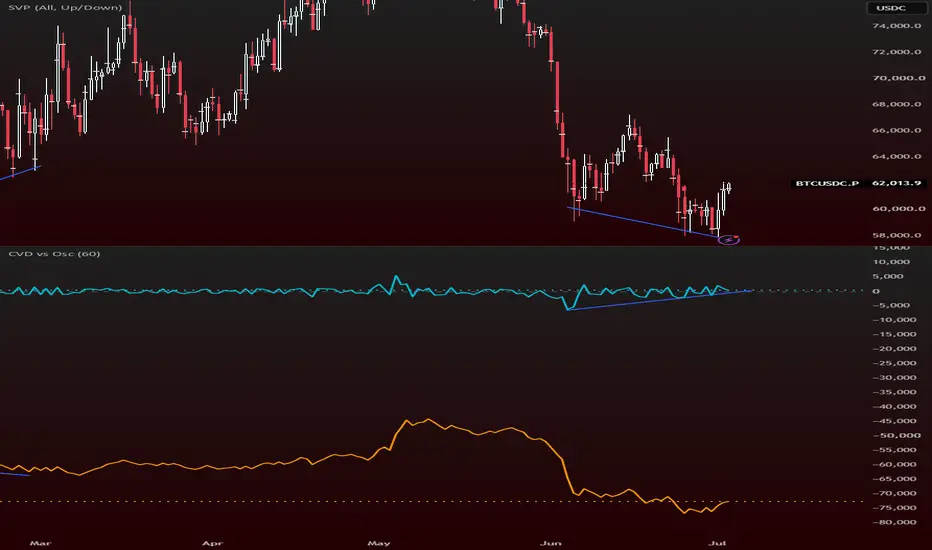
CVD Simple vs Oscillator## CVD Simple vs Oscillator This indicator displays **two versions** of Cumulative Volume Delta side by side for easy comparison: - **Simple CVD** (Orange): A basic volume delta calculation using close vs open. - **Oscillator** (Aqua): An advanced, smoother version calculated using intrabar data via TradingView’s `requestVolumeDelta()` function. ### Key Features - Dual CVD visualization (Simple + Advanced) - Daily reset by default (resets at the start of each new day) - Manual vertical scaling enabled (`scale = scale.none`) — drag the right-side scale to stretch the lines - Clean zero line for easy reference - Lightweight and easy to read ### How to Use **Simple CVD (Orange)** A quick and basic representation of net buying vs selling pressure. It can appear spiky on high-volume bars. **Oscillator (Aqua)** A more accurate and smoother representation of cumulative order flow. This is generally the better line to follow for analysis. ### How to Read the Indicator - **Above zero** → Net buying pressure is dominant - **Below zero** → Net selling pressure is dominant - **Rising line** → Buyers are gaining control - **Falling line** → Sellers are gaining control ### Recommended Usage - Use the **Oscillator** (Aqua) line for better signals - Best used on **15m to Daily** timeframes - Works well for identifying **divergences** between price and volume pressure - Combine with price action and key support/resistance levels ### Settings - **Reset Period**: Choose how often the CVD resets (Default = Daily) - You can manually stretch the vertical scale by dragging the numbers on the right side of the pane ### Notes This indicator helps traders visualize the ongoing battle between buyers and sellers through cumulative volume delta. The Oscillator version provides a cleaner view compared to basic delta calculations.Chỉ báocủa EthanLiqHunt479
Smart Trend Filter V6Smart Trend Filter V6 Overview Smart Trend Filter V6 is a trend-following indicator that combines multiple technical analysis tools into a single system to help traders identify high-quality trading opportunities. Instead of relying on one indicator alone, it uses trend, momentum, and volume confirmation to filter out weaker signals and highlight stronger market setups. The goal of this indicator is to provide a cleaner view of the market by reducing noise and helping traders focus on trades that align with the prevailing trend. --- How the Indicator Works Smart Trend Filter V6 evaluates four important aspects of the market before generating a signal. 1. Trend Detection (EMA 20 & EMA 50) The indicator uses two Exponential Moving Averages (EMAs) to determine the overall market direction. - When EMA 20 is above EMA 50, the market is considered bullish. - When EMA 20 is below EMA 50, the market is considered bearish. This trend filter helps traders avoid trading against the dominant market direction. 2. Momentum Confirmation (RSI) The Relative Strength Index (RSI) measures the strength of price movement. - Higher RSI values indicate stronger bullish momentum. - Lower RSI values indicate stronger bearish momentum. RSI confirmation helps filter out weak crossovers that lack momentum. 3. Volume Confirmation Volume plays an important role in validating price movements. The indicator compares the current volume with its moving average. Signals are generated only when trading volume is above average, increasing the likelihood that the move is supported by market participation. 4. Price Confirmation Before a signal is confirmed, price must also agree with the trend. For a Buy signal, price must close above the fast EMA. For a Sell signal, price must close below the fast EMA. This additional confirmation helps reduce false entries. --- Buy Signal A Buy signal appears when all of the following conditions are met: - EMA 20 crosses above EMA 50. - RSI is above the selected Buy threshold. - Volume is above its moving average. - Price closes above EMA 20. --- Sell Signal A Sell signal appears when all of the following conditions are met: - EMA 20 crosses below EMA 50. - RSI is below the selected Sell threshold. - Volume is above its moving average. - Price closes below EMA 20. --- Features - Non-repainting signal logic - Trend confirmation using dual EMAs - RSI momentum filter - Volume-based confirmation - Buy and Sell arrows - Background trend highlighting - Customizable settings - TradingView alert support - Works across multiple asset classes --- Suitable Markets Smart Trend Filter V6 can be used on: - Forex - Cryptocurrencies - Stocks - Commodities - Indices --- Recommended Timeframes - 5 Minutes - 15 Minutes - 30 Minutes - 1 Hour - 4 Hours - Daily Higher timeframes generally produce fewer but stronger signals, while lower timeframes generate more opportunities with increased market noise. --- Best Practices For improved results: - Trade in the direction of the higher-timeframe trend. - Use stop-loss and proper risk management. - Wait for candle close before acting on a signal. - Combine the indicator with key support and resistance levels for additional confirmation. --- Disclaimer Smart Trend Filter V6 is designed as a technical analysis tool to assist with market analysis. No indicator can predict the market with complete accuracy, and all trading involves risk. Always perform your own analysis and apply sound risk management before making trading decisions. If you find this indicator useful, consider adding it to your favorites and sharing your feedback. Your suggestions are always appreciated and help improve future updates.Chỉ báocủa ReubenMiles19
Eugen Liquidity Compass - Helle Daily Macro Risk SignalsDer Eugen Liquiditäts-Kompass ist ein makrobasierter Liquiditäts- und Risikoindikator für Aktien, ETFs, Indizes, Kryptowährungen und andere Risikoassets. Der Indikator analysiert zentrale Markt- und Liquiditätstreiber wie US Net Liquidity, DXY, reale US-Renditen, High-Yield-Spreads, NFCI, VIX/MOVE, USDJPY und einen frei wählbaren Benchmark wie SPY, QQQ oder BTC. Ziel ist es, das übergeordnete Marktregime sichtbar zu machen: Risk-On Neutral Risk-Off Der Indikator berechnet einen Score von 0 bis 10: 8–10: Stark Risk-On 6–8: Risk-On 4–6: Neutral 2–4: Risk-Off 0–2: Stark Risk-Off Die US Net Liquidity wird berechnet als: Fed Balance Sheet - Treasury General Account - Reverse Repo Der Indikator nutzt mehrere Impulse über 4, 8 und 13 Wochen, um kurzfristige und mittelfristige Liquiditätstrends zu erkennen. Empfohlenes Timeframe: Der Indikator ist primär für den Daily Chart entwickelt. Beste Nutzung: 1D. Auch möglich: Weekly für strategische Regimeanalyse. Nicht empfohlen: Intraday-Scalping oder Minutencharts. Signale: STRONG LONG: sehr positives Risk-On-Umfeld LONG: Long-Bias erlaubt WEAK LONG: Long möglich, aber mit Makro-Gegenwind EXIT: Risiko reduzieren HARD EXIT: starkes Stresssignal CARRY STRESS: mögliches USDJPY/Yen-Carry-Unwinding Duration Stress: Duration Stress bedeutet: DXY und reale US-Renditen sind gleichzeitig negativ für Risikoassets. Das ist besonders relevant für QQQ, Software, Halbleiter, Bitcoin, Krypto und hoch bewertete Wachstumsaktien. Der Indikator ist kein reines Kauf-/Verkaufssystem, sondern ein Makro-Filter. Er sollte mit Chartanalyse, Risikomanagement und eigener Marktanalyse kombiniert werden. Dieser Indikator dient nur zu Research- und Analysezwecken und stellt keine Anlageberatung, Kaufempfehlung oder Verkaufsempfehlung dar. Märkte können sich schnell verändern, und makroökonomische Daten können verzögert oder revidiert werden. Dies ist keine Anlageberatung, sondern eine Research-Einschätzung auf Basis der verfügbaren Daten und Annahmen.Chỉ báocủa zheky18