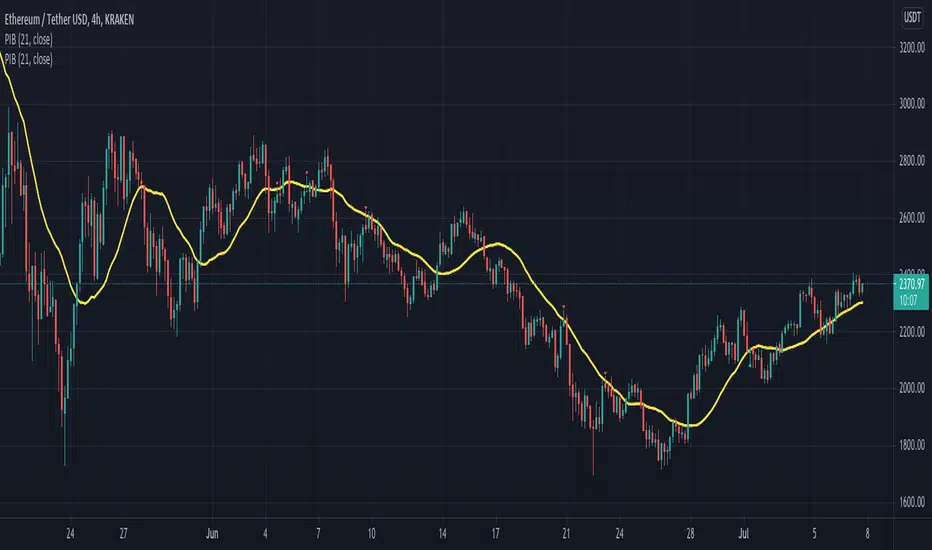
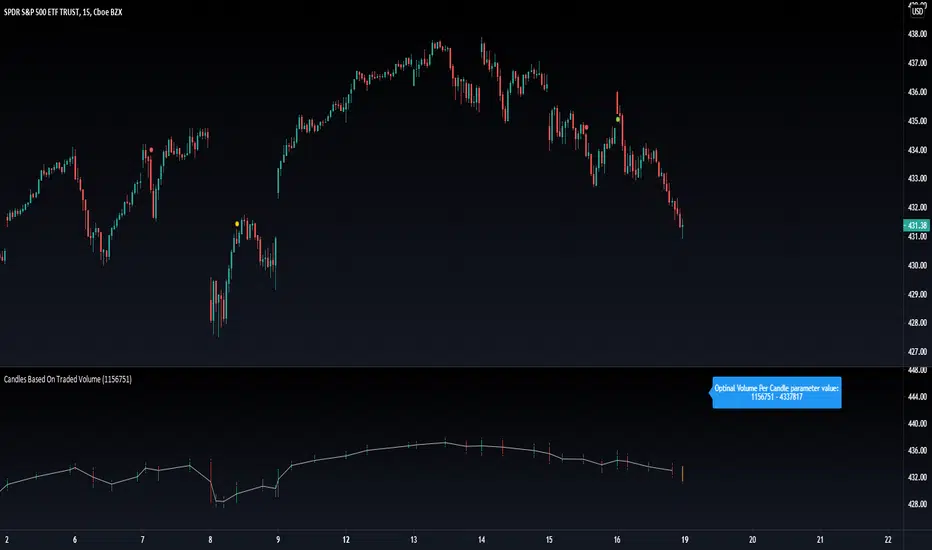
Common Candlestick PatternsCommon Candlestick Patters Highlighter. - TLS: Three Line Strike (Bearish and Bullish) - AB: Advance Block - IB: Inside BarChỉ báocủa bhnmzmCập nhật 33228
HTF Candles by Prosum SolutionsOverview of Features This indicator was inspired by the work of "informanerd" in the script called "HTF Candles" as well as the built-in script called "Multi-Time Period Charts" by TradingView. The script will provide a highly customizable interface to specify the higher timeframe resolution for the candlesticks, the type of candle, as well as various styling options for the body, borders and wicks. Usage Information The indicator can be applied to any chart at any time frame, but resolutions less than 1 minute may demonstrate gaps between bars and the candles may not render properly. When the "Same as chart" option is chosen for the "Resolution" field, the indicator will attempt to find a higher timeframe resolution to ensure the candlesticks are drawn. Enjoy! 👍Chỉ báocủa prosum_solutionsCập nhật 104104 2.2 K
Fair Value Gap / FVG - HTF Orderflow bias / trendCalculates Fair Value Gap (FVG) as a counter and plots it below price. FVG Counter value resets to +ve or -ve once the FVG counter reverses direction. Use this script to find a bias to trade with. Best used on HTF (like 1W, 1D), so the bias can be transferred to LTF (like 4H, 1H). If you end up using this script, please leave a comment below on how you used it. I can try to incorporate those ideas in an update. Cheers!Chỉ báocủa makuchaku2929 2.4 K
BTC PairsHi Crypto traders, As many of you, while trading in altcoins, it is important to look at their BTC pairs also. That is why I created a script like this. It works under these conditions: 1- The coin you are looking for must have BTC pair in the exchange of the chart. ( If an exchange does not have ADABTC while it has ADAUSDT, the script wont work ) 2- The pair in that exchange must be concatenated as follows "PAIR_NAME" + "BTC" in tradingview. Ex: "ADA" + BTC" = "ADABTC" If you have any questions or suggestion, I would be glad to hear and answer them. Stay Safe.Chỉ báocủa bahadirkisbet1157
I Ching Hexagrams Part 2IMPORTANT! Get the other indicator I Ching Hexagrams Part 1 for the full set! Here is the first half of the I Ching's hexagrams. Each candle generates a hexagram at close, based on that candle and the previous 5. A green candle is yang and a red candle is yin. In this way, price action generates a hexagram. Use this to generate a hexagram for the day or even to find interesting patterns to trade. Have fun!Chỉ báocủa Has-no-Name2277
I Ching Hexagrams Part 1IMPORTANT! Get the other indicator I Ching Hexagrams Part 2 for the full set! Here is the first half of the I Ching's hexagrams. Each candle generates a hexagram at close, based on that candle and the previous 5. A green candle is yang and a red candle is yin. In this way, price action generates a hexagram. Use this to generate a hexagram for the day or even to find interesting patterns to trade. Have fun! Chỉ báocủa Has-no-Name4450
SL Hunter Tracker SL Hunter Tracker coded by Bogdan Vaida SL Hunter Tracker is a meticulous hunter that tracks SL hunters. First it plots the fractals on the chart, then it draws lines from them to the last wick that touched that height. You can add sweep alerts, once per bar close, so that you get notified when a wick was touched. Tested on: EURUSD 30'Chỉ báocủa vaidab5050 1.6 K
Line Chart Enhancer by makuchakuTradingview has a good line chart, but I wanted to make it even more awesome. Some shortcomings which this line chart enhancer script fixes Colors up move as green, down move as red (you can change them as you like) Plots high and low - so that one can be aware about what the price is doing To achieve the look with markers as shown above Goto Symbol settings > Type > Select "With Markers" Feedback welcome!Chỉ báocủa makuchakuCập nhật 2222639
Wide BarsSimple scripts show the wide range bars within in the look back period, visualizing the bigger momentum. Added four exponential moving averages which define the trend of the instrument. Wide range candles in the direction of overall trend on higher timeframes; give confluence of higher participation in the same direction. Note : Decent volume above the average volume with wide range candle adds more value.Chỉ báocủa CrazyKishore7411235
RSI Signals by HBRELATIVE STRENGTH INDEX (RSI) This is a tool that is widely used Especially for Overbought and Oversold systems, but I have made some changes in this indicator, How to use it...! I have set it as the default setting - RSI Length: 7 - Overbought: 70 - Oversold: 30 What is unique about this tool? we can see 3 conditions: 1) RSI Overbought / Oversold with Bullish Engulfing / Bearish Engulfing 2) RSI Overbought / Oversold with Hammer and Shooting Star 3) RSI Overbought / Oversold with 2 Bullish Bars / 2 Bearish Bars 4) RSI Overbought / Oversold with All Patterns at the same time When the RSI reaches its Oversold line, the code will wait for Bullish Engulfing pattren , when oversold and Bullish engulfing matched, This indicator will generate a buy signal when the condition is met, and same as for Bear market, When the RSI reaches its Overbought line, the code will wait for Bearish Engulfing pattren , This indicator will generate a sell/exit signal when the condition is met, 2nd condition is that a Hammer candle will be waited for when RSI touches the Overbought line, for Bullish Move and Shooting Star candle will be waited for when RSI touches the Overbought line, for Bullish Move, for Bearish Move 3rd Condition is also the same as Condition 1 and Condition 2, When the RSI reaches its Oversold line, the code will wait for 2 Bullish Bars , when oversold and 2 Bullish Bars matched then this indicator will generate a buy signal, and same as for Bear market, When the RSI reaches its Overbought line, the code will wait for 2 Bearish Bars , when overbought and 2 Bearish Bars matched then this indicator will generate a Sell signal, 4th Condition is that we can use All Conditions at the same time, - Bullish Engulfing / Bearish Engulfing - Hammer and Shooting Star - 2 Bullish Bars / 2 Bearish Bars Chỉ báocủa HamidBox4242 2.4 K
Value CandlesCreating candles from value stats as an experiment. These candles will almost always follow price candles except when there is a deviation. Strategies based on buying the dips can be applied better on value candles. This is because, drop in value candles imply real bargain whereas drop in price candles can also be due to some other factors. We can clearly see in the Amazon chart that value candles have come down even though price candles are at same level from September. This signifies AMZN stock is having more value now (due to increased sales from September to now) than back in September even though the price is same. Another simple thing we can do is move Value candles into same overlay as that of price candles. This will look something like this: Key thing to remember : Lower the value candle higher the relative value of stock.Chỉ báocủa Trendoscope33300
Secondary Candle OverlayThis simple script is meant to allow the user to select another symbol to add onto their chart and plot the candlesticks for that symbol at the selected resolution requested. Please see the tooltip provided by the 'Secondary Symbol' input for more details with regards to properly using this script on symbols that have vastly different valuations, it will help with getting the symbol requested to scale properly with the primary symbol on the chart. The user may also input which colors are used for bullish/bearish candles as well as the symbol itself and its resolution. IMPORTANT NOTE: THIS SCRIPT DOES NOT ACCOUNT FOR SYMBOLS THAT ARE NOT CONTINUOUS (The defval for the symbol is TVC:DXY which closes on weekends whereas a cryptocurrency like Bitcoin does not stop trading ever; candles on these kinds of markets will be repeated when overlaid onto markets that do not have this property.)Chỉ báocủa SolCollectorCập nhật 11203
Trigram (I Ching)This script generates a Trigram for the current candle at its close. The idea is simple. It takes the current candle close and the two previous to generate the lines of the Trigram. In traditional I Ching practices, these are built bottom up. So in this case, the Candle in 2 bars back is the base, 1 bar back is the central line and the current close is the top. Up candles are yang lines, down candles yin. Anyways, not sure what use it is yet, but if there is anyone else out there interested in I Ching, Yin/Yang theory and trading, this is for you.Chỉ báocủa Has-no-Name111145
Vertical line by bar_indexThis indicator helps in letting the trader focus on a particular date/candle across many symbols. Tradingview currently has a bug in Bar Replay - when we switch symbols, the bar replay resets. Hence if you are backtesting & running through a bunch of symbols, it is nearly impossible to focus on a particular historical candle across all symbols. This indicator plots a vertical line on a given bar_index which remains as it is while you are switching symbols. Feel free to copy, modify and use as you like!Chỉ báocủa makuchaku44344
AlertoJack AlertoJack v0.1a coded by Bogdan Vaida This indicator was created to provide easily defined alerts on multiple symbols. It's still POC code. Usage: - Add it on any coin, - The chart timeframe will be the timeframe for the alerts; - Configure it with the symbols you want to be alerted on, - Add the prices to be alerted for, - Use Add Alert -> condition AlertoJack -> "Any alert() function call" - Check the Alerts log. Notes: - Alert happens when candle crosses the price. - Because of how Trading View functions, if you modify the indicator settings you'll need to add the alerts again (because an alert uses the code version it was created from). - The alert runs once per current bar's timeframe (e.g. once per minute if you're on the 1m).Chỉ báocủa vaidab22231
Swing Failure Pattern Inquisitor SFP Inquisitor v0.2a coded by Bogdan Vaida Code for Swing High, Swing Low and Swing Failure Pattern. Note that we're still in the alpha version, bugs may appear. Note that the number you set in your Swing History variable will also be the minimum delay you see until the apples appear. This is because we're checking the forward "history" too. The SFP will only check for these conditions: - high above Swing History high and close below it - low below Swing History high and close above it In some cases you may see an apple before the SFP that "doesn't fit" with the SFP conditions. That's because that apple was drawn later and the SFP actually appeared because of the previous apple . 20 candles later. Legend: 🍏 - swing high 🍎 - swing low 🧺 - candle where the last swing was driven from 🍌 - swing failure pattern 🍎🍌 - hungry scenario: swing low but also a SFP compared to the last swingChỉ báocủa vaidabCập nhật 118118 3.3 K
Indecision indicatorIndecision is calculated based on ratio of wicks-body to full candle. Similarly price rejection is calculated based on ratio of upper wicks to candle and lower wicks to candle. In both cases sum of stats from last N candels are used to get smoother output. Coloring of indecision candle is based on two bollinger bands with different standard deviations. It can be set in input settings.Chỉ báocủa Trendoscope4491
HTF CandlesThis draws candlesticks from higher time frames on the current chart. I tried to keep the script simple using some newly introduced Pine capabilities. To change the options like the higher time frame and candle colors, check the indicator settings. Looking forward to your opinions!Chỉ báocủa informanerdCập nhật 3030 1.6 K
Awesome Heikin Ashi [Morty]This indicator uses Heikin Ashi candles and two EMAs to help you follow the trend and enter the trade. Heikin Ashi candles help to smooth the price and EMAs are used to detect trend. The default parameter of EMA is EMA10 and EMA20. You can use it at any timeframe. You should always adjust the EMA length according to different timeframes. Features: - Highlight background based on two EMAs - Adjustable EMA length - Adjustable Label size - Show entry and exit signal labels - Show stoploss price - You can choose Long only or Short only or both signals - Alert functions for notification NOTE: If you use this signal to enter a trade, make sure the candle is close and enter in the next candle. Chỉ báocủa M0rty1616 1.2 K
open>open[1]=BUY_else_SELLsimple script. enter rule is open>open =BUY_else_SELL (open means open price 1 candle ago, so basically its if price now greater than price 1 candle ago...) exit rule is Trailing Stop. 1 trade per candle, here on daily chart BTCUSDT with binance commision included in result. 254 million percent profit.... 😲Chiến lượccủa SeaSide4203838603
NYSE extended session backgroundThis script adds background to the chart to highlight different time areas in any chart. The time areas are in relation to the open/close time of NYSE , both regular and extended session. The background colors are the following by default: NO COLOR : NYSE is open DARK BLUE : NYSE is closed LIGHT BLUE : NYSE post market session ORANGE : NYSE pre market session In addition, previous day close price line is shown during extended and closed sessions (orange line). This script is useful to visualize any chart in relation to the NYSE timetable.Chỉ báocủa konidtaly88Cập nhật 11117
Break/Reversal/Touch [Intromoto]This script shows the engulfing breaks, touches and potential reversals for when prices arrives at certain time frame closes. On publishing it shows the crossovers of the 6 hour, Daily, Weekly, and Monthly time frames. The candle main signals are contingent on crossing over the closing level, and engulfing the previous candle. Secondary signals occur when the candle low or high touch the closing levels, in the directional color, i.e. you'll get a bearish touch signal if the candle high touches the level, and it's a red candle. Reversals occur when the subsequent candle breaks a closing level, but the current candle engulfs the previous candle in the opposing direction. If a candles low or high hits a daily, weekly, or monthly close level it also will plot a "D/W/M Touch" in the according direction. ThanksChỉ báocủa IntromotoCập nhật 22317
The Strat info boxThis indicator is an all in one indicator for the "The strat" method by Rob Smith. This indicator DOES NOT provide trading advice or trade entry signals! What is included: * Candle Type 1 - Inside Candle * Candle Type 2- Up or Down Candle * Candle Type 3 - Engulfing Candle * Strat signal: - 2-1-2 setup - 3-2-2 setup * Full Timeframe Continuity: - from a 5min timeframe to a yearly timeframe. Green gives you an uptrend, Red a downtrend. * middle of day and week - this give you a support and resistance level at the middle of the day or week. This is a good indicator if the stock goes up or down * extra info like: - ATR of 14 days - DTR of current day - Volume info - Float info NASDAQ:FBChỉ báocủa XpulzCập nhật 2727 1 K