[3Commas] Silicon Vault Long - INTC DCA Strategy Silicon Vault Long — INTC DCA Strategy
🔷 What it does:
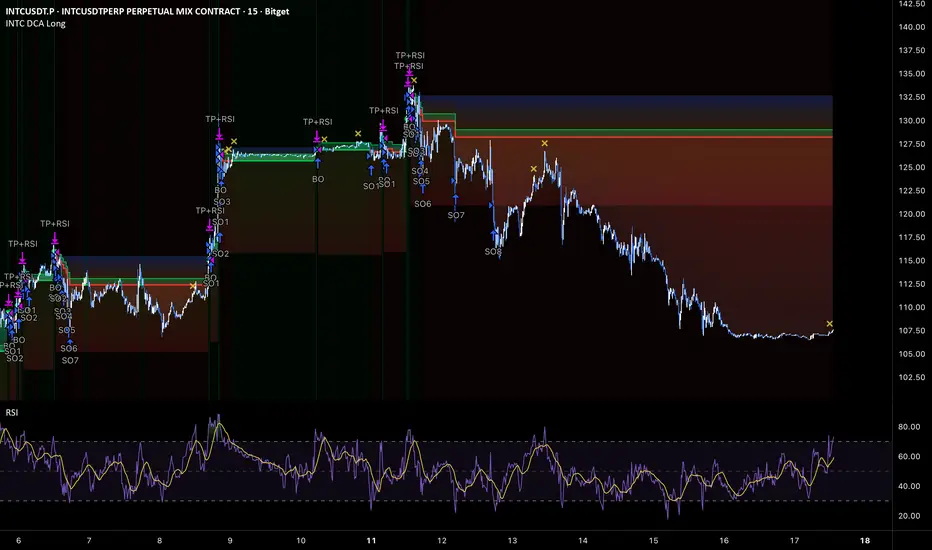
This strategy executes a long-only Dollar-Cost-Averaging approach on tokenized Intel (INTCUSDT) perpetuals, using an RSI-based exit gate to capture momentum-confirmed take-profits on overbought rebounds. It opens base orders continuously when no active deal exists, layers a structured 8-level safety order ladder during price drawdowns, and exits only when RSI crosses above the overbought threshold AND the position has accumulated the minimum profit target from the average entry. Calibrated for the volatility profile of tokenized semiconductor stocks, where structural bullish drift in mega-cap tech combines with intraday volatility unique to perpetual contracts on equity tokens.
- Base Order entry: nonstop — opens immediately when no active deal exists
- Safety Order ladder: 8 levels with cumulative deviation (step coef 1.22), all SOs equal size
- Exit: RSI(14) on 15m crosses above 70 AND profit ≥ 0.6% from average entry (dual-gate close)
- 2× leverage (isolated), no stop loss
🔷 Who is it for:
Traders looking to apply DCA logic to tokenized semiconductor / tech equity perpetuals.
Bot operators who automate execution through webhook integration with a DCA Bot.
Traders seeking exposure to mainstream tech stocks through perpetual contracts during structural bull phases.
Discretionary traders who want a signal framework with momentum-confirmed exits rather than fixed-percentage closes.
🔷 How does it work:
Long Entry: A base order opens whenever no active deal exists and the bar is confirmed within the configured window. There is no signal-based entry filter — the strategy reloads continuously, treating each new deal as a fresh DCA cycle. This is appropriate for instruments with sustained upward bias, as Intel's tokenized perpetual demonstrates during the reference period.
Short Entry: Not used — strategy is long-only by design.
Exit Management: The full position closes when two conditions align simultaneously — RSI(14, 15m) crosses above 70 (momentum-confirmed overbought signal) AND unrealized profit from average entry reaches the minimum threshold (default 0.6%). The dual gate prevents premature exits during shallow rebounds and prevents structural exits when profit is below threshold. The strategy carries no stop loss; invalidation is replaced by the depth of the safety order ladder (cumulative −8.88% from base across 8 levels) plus the underlying bullish drift assumption for tokenized equities.
🔷 Why it's unique:
Dual-gate exit logic — most DCA strategies use either a fixed-percentage TP or a signal-only exit. This combines them: the RSI signal acts as a momentum-confirmed exit trigger, but only fires when the position is also profitable above the minimum threshold. This filters out RSI-triggered exits that would close deep-averaged positions at a loss, ensuring every signaled close is both timing-confirmed and economically rational.
Semiconductor sector focus — calibrated for tokenized semiconductor stocks (Intel, AMD, NVDA proxies) where chip-cycle volatility creates the kind of intraday range that DCA bots monetize through structured averaging. Intel's specific volatility profile of 2025–2026 produced an ideal regime for this framework.
Bot Integration — entry and exit alerts ship with webhook-ready JSON payloads. Bot ID, Email Token, and pair label are exposed as inputs and automatically embedded into the alert message format.
🔷 Considerations Before Using the Indicator:
Market & Timeframe: Designed for a 15-minute chart on tokenized equity perpetuals with active intraday range. Best suited to mega-cap tech instruments with sustained bullish drift and regular pullback structure (Intel, AMD, MSFT, GOOGL, NVDA proxies). Less suited for sustained downtrends or instruments without structural upside bias — tokenized stocks have an embedded long-term upward expectation that crypto-native pairs do not always share.
Limitations: The strategy carries no stop loss. In sustained downtrends extending beyond the deepest safety order (−8.88% from base), the position holds unrealized loss until either the average is recovered through subsequent bounces or the deal is manually closed. The structural assumption is that the underlying tokenized equity will mean-revert upward over time due to its embedded bullish drift. If this assumption breaks (e.g., during a sustained semiconductor sector bear cycle), the strategy is materially exposed.
Backtesting & Demo Testing: The reference results were generated on Bitget USDT-M Perpetual Futures for INTCUSDT during a strong bullish phase for Intel stock (Jan 2025 — Mar 2026, 437 days). Performance during different equity market regimes (chip cycle downturns, broad tech corrections, rangebound periods) may differ significantly. Always validate on extended history and re-test across multiple instruments before deploying real capital. Demo-trade for at least one month before live deployment. Past performance is not indicative of future results.
Parameter Adjustments: Commission defaults to 0.06% (Bitget USDT-M taker). Adjust for your venue. Leverage is set to 2× isolated — increase or decrease per your risk tolerance. RSI threshold (70) and the minimum profit gate (0.6%) should be tuned per instrument volatility — tighter thresholds for lower-volatility tokenized stocks, wider for high-beta semiconductor tickers. SO step (0.5%) and step coefficient (1.22) define ladder depth; widen the step for instruments with bigger intraday swings.
🔷 STRATEGY PROPERTIES
Symbol: BITGET:INTCUSDT.P (Intel Corp tokenized perpetual on Bitget). Strategy is generic — works on any tokenized equity perpetual.
Timeframe: 15m chart.
Test Period: Jan 2025 — May 17, 2026.
Initial Capital: 500 USDT.
Order Size per Trade: Base Order 11.25 USDT, Safety Orders 7.5 USDT each (×8 = 60 USDT). Maximum cumulative position notional ≈ 71.25 USDT per deal. With 2× isolated leverage, margin requirement ≈ 35.6 USDT.
Commission: 0.06% taker (Bitget USDT-M Perpetual reference). Adjust per venue.
Slippage: 2 ticks — typical taker execution on liquid perpetuals.
Margin for Long and Short Positions: 50% (2× isolated leverage).
Indicator Settings: Default Configuration.
Base Order Volume: 11.25 USDT
Safety Order Volume: 7.5 USDT
Max Safety Orders: 8
Price Step (1st SO): 0.5%
Step Coefficient: 1.22
Volume Coefficient: 1.0
RSI Length: 14
RSI Threshold: 70
RSI Timeframe: 15m
Min Profit: 0.6% from average entry
Strategy: Long Only.
🔷 STRATEGY RESULTS
⚠️ Remember, past results do not guarantee future performance.
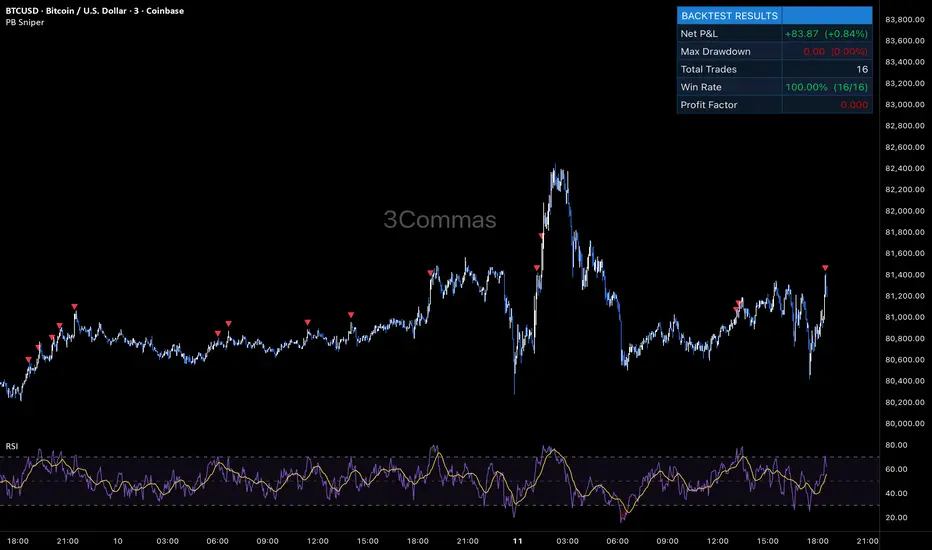
Net Profit: +55.96 USDT (+11.19%)
Max Drawdown: 16.75 USDT (3.13%)
Total Closed Trades: 320
Percent Profitable: 88.75% (284 / 320)
Profit Factor: 23.701
Reference TradingView Pine backtest on BITGET:INTCUSDT.P (15m chart) for the available history window Jan 1 2025 — May 17 2026 (252 days). The exceptional win rate (88.75%) and Profit Factor (23.701) reflect the structurally bullish phase for Intel stock during the test window combined with the strategy's deep safety order ladder that absorbs intraday pullbacks. These metrics are regime-dependent and not expected to persist through semiconductor sector downturns or sustained bear cycles. Re-test on your own venue with venue-specific commission before live deployment.
🔷 How to Use It:
🔸 Adjust Settings: Set Base Order and Safety Order volumes proportional to your account size and risk tolerance. The default 11.25 / 7.5-USDT structure is calibrated for a 500-USDT test account with 2× leverage; scale linearly to your equity. RSI threshold can be tightened to 65 for more frequent exits or widened to 75 for fewer, larger captures. The SO step should be widened on instruments with higher intraday volatility.
🔸 Results Review: Verify Maximum Drawdown stays within your personal risk budget. The strategy is configured for a conservative per-deal risk envelope (max position 71.25 USDT, full ladder coverage at −8.88% from base), but extended history may shift this profile. Re-test on your own venue using venue-specific commission and slippage. The strategy's performance on the tested window is regime-dependent — performance during semiconductor sector downturns has not been validated. Demo-trade for at least one month before any live deployment.
🔸 Create alerts to trigger the DCA Bot: Two alert messages are exposed by the strategy — "Deal Start" fires on each new base order, and "Deal Close" fires when the dual-gate exit triggers. Configure both alerts in TradingView with the webhook URL pointing to your DCA Bot's signal endpoint. Once configured, the strategy publishes the signal and the bot handles execution on the exchange autonomously.
🔷 INDICATOR SETTINGS
Base Order Volume (USDT) — Notional value of the initial entry per cycle.
Safety Order Volume (USDT) — Notional value of each averaging-down order; all SOs equal size by default.
Max Safety Orders — Total number of averaging steps available per deal.
Price Step % (1st SO from base) — Percentage deviation from base price for the first safety order.
Martingale Step Coefficient — Multiplier applied to each successive deviation step.
Martingale Volume Coefficient — Size multiplier applied to each successive safety order (default 1.0 = all equal).
Require RSI cross-above for close — Toggle the dual-gate exit; off makes it pure %-profit close.
RSI Length / Threshold / Timeframe — Parameters for the exit RSI signal.
Min Profit % (from avg entry) — Minimum unrealized profit threshold required for the exit gate.
Limit by Date Range — Constrain backtest to a specific date window.
Stats card / Watermark — Display layer controls for on-chart backtest summary and branding.
Webhook — Bot ID, Email Token, and Pair label for DCA Bot signal routing.
👨🏻💻💭 We hope this tool helps enhance your trading. Your feedback is invaluable, so feel free to share any suggestions for improvements or new features you'd like to see implemented.
__
The information and publications within the 3Commas TradingView account are not meant to be and do not constitute financial, investment, trading, or other types of advice or recommendations supplied or endorsed by 3Commas and any of the parties acting on behalf of 3Commas, including its employees, contractors, ambassadors, etc.
Chiến lược