Engulfing Pattern Detector [SSFX]Engulfing Pattern Detector is candlestick analysis indicator designed to detect and highlight bullish and bearish engulfing patterns directly on the price chart.
The indicator focuses on two-candle engulfing formations. A bullish engulfing pattern is identified when the current bullish candle engulfs the previous bearish candle based on the selected engulfing method. A bearish engulfing pattern is identified when the current bearish candle engulfs the previous bullish candle based on the selected engulfing method.
The script provides two engulfing detection modes:
Body Engulfing: This mode checks whether the body of the current candle covers the body of the previous candle.
Full Candle Engulfing: This stricter mode checks whether the current candle also covers the full high-low range of the previous candle, in addition to meeting the body engulfing condition.
To reduce weak or unclear signals, the indicator includes a minimum body percentage filter. This allows users to require the current engulfing candle to have a minimum body size relative to its total candle range. This can help avoid candles with very small bodies or excessive wicks.
Key Features:
Detects bullish engulfing patterns
Detects bearish engulfing patterns
Option to display all patterns or only bullish/bearish patterns
Option to require opposite candle colors
Body engulfing and full candle engulfing modes
Minimum body percentage filter
Box highlight around the two-candle engulfing formation
Optional labels
Optional candle coloring
Optional background highlight
Custom bullish and bearish colors
Alert conditions for bullish, bearish, and any engulfing signal
How to Use:
Bullish engulfing patterns may be used as a visual clue that buying pressure is increasing after a prior bearish candle. Bearish engulfing patterns may be used as a visual clue that selling pressure is increasing after a prior bullish candle.
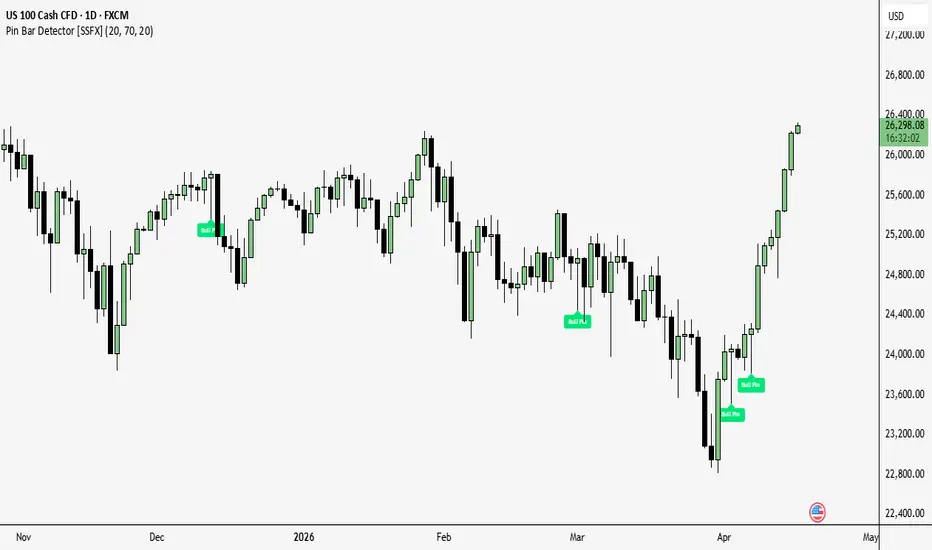
The box highlight is drawn around the full two-candle pattern, making it easier to visually identify where the engulfing structure occurred. Green boxes represent bullish engulfing formations, while red boxes represent bearish engulfing formations.
This indicator is intended to be used as a visual candlestick pattern tool. It does not predict future price movement and should not be used as a standalone trading system. Users may combine the signals with their own market structure, support and resistance, trend, volume, or risk management analysis.
Alerts:
The script includes alert conditions for:
Bullish Engulfing Detected
Bearish Engulfing Detected
Any Engulfing Pattern Detected
These alerts can be used to notify users when a new engulfing pattern appears on the chart.
Chỉ báo