Market Regime Engine [NQ Labs] WHAT THIS ANSWERS
Almost every indicator tells you WHAT the market is doing. Very few tell you
whether the current market has enough exploitable structure to be worth
risking money on at all. The Market Regime Engine is built for that second
question: should I be trading this right now, and if so, what style of
approach do current conditions actually favour?
It is not a signal generator. It produces no entries. It is a filter you run
underneath whatever you already trade.
WHY IT IS BUILT THIS WAY
Two design decisions separate this from a conventional regime or trend filter.
1. EVERY AXIS IS PERCENTILE-RANKED AGAINST ITS OWN HISTORY.
Most regime tools use fixed thresholds - an ADX of 25, an ATR multiplier of 3.
Those numbers are calibrated to whatever the author tested on. They are the
reason a tool behaves sensibly on one instrument and nonsensically on the
next. Here, each axis is ranked against its own recent distribution on the
current symbol and timeframe, so a 65th-percentile reading carries the same
meaning on a crypto pair as it does on an FX major. Nothing needs retuning
per market.
2. THE THREE AXES ARE ORTHOGONAL BY DESIGN.
Many "confluence" tools stack three views of momentum and present the
agreement as confirmation. Correlated inputs agreeing is not evidence. These
three measure genuinely different properties:
DIRECTIONAL EFFICIENCY - net distance travelled divided by the total path
walked to get there. A value near 1 is a straight line. A value near 0 means
price ended where it started after a great deal of work. This is the most
direct available answer to "is there a trend here", and it is independent of
direction.
VOLATILITY STATE - ATR ranked against its own history. Not "is volatility
high" in absolute terms, but "is volatility high for this instrument".
RETURN PERSISTENCE - lag-1 autocorrelation of log returns. Positive means an
up bar tends to be followed by an up bar, so momentum approaches have
something to work with. Negative means the market reverts. Near zero means
returns carry no usable memory.
THE SCORING LOGIC
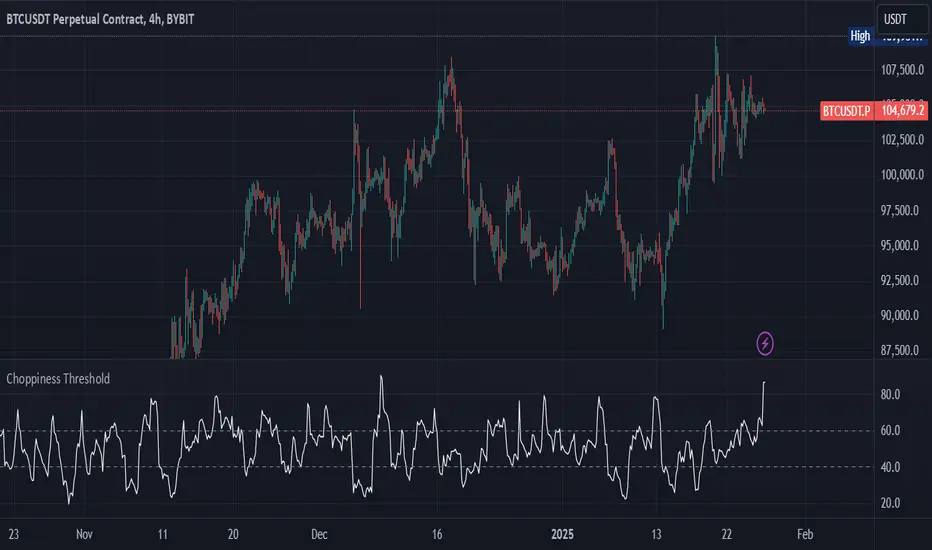
The Tradeability Score (0-100) rests on one idea:
Efficiency is the signal. Volatility is the cost of being wrong.
Volatility only hurts you when there is no direction to exploit.
So the noise penalty is the product of how little direction exists and how
violent the market is. It approaches zero inside a strong trend no matter how
wild conditions get - because volatility inside a trend is opportunity, not
noise - and it peaks precisely where traders are most reliably ground down:
low efficiency combined with high volatility. That specific combination is
what the engine exists to flag.
THE FIVE REGIMES
TREND Efficiency high. Directional. Follow it.
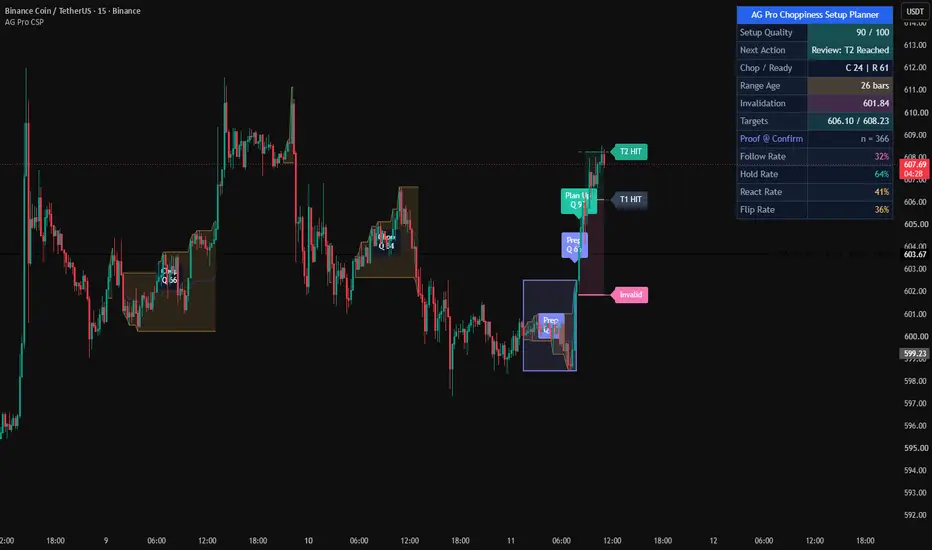
VOLATILE CHOP Efficiency low, volatility high. No direction, maximum cost
of being wrong. The state that does the damage.
COIL Efficiency low, volatility low. Compression. Wait.
RANGE Efficiency low, volatility middling. Edges are tradeable.
TRANSITION Efficiency mid-range. No clean read. Reduce size.
A raw regime read must hold for a configurable number of consecutive bars
before it is confirmed. Without that filter, readings that straddle a
threshold flip back and forth for single bars.
REGIME MATURITY - THE PART I HAVE NOT SEEN ELSEWHERE
The engine records the length of every completed regime run on the current
chart and reports the current run against that learned baseline, together with
the sample size behind it.
A trend at 0.3x its typical duration and a trend at 2.4x are not the same
trade, even though every conventional indicator prints the identical reading
for both. A compression that has lasted three times longer than compressions
normally last on this instrument is a different proposition to one that
started six bars ago.
The sample size (n=) is shown deliberately. Below the configured threshold the
cell dims, because a baseline built from two observations is not evidence and
should not be dressed up as though it were.
HOW TO USE IT
The engine is a gate, not a trigger. The intended workflow:
1. Read the Verdict first. STAND DOWN means your edge, whatever it is, is
probably not present. The most valuable output of this tool is the trades
it talks you out of.
2. Read the Regime and Favoured Style. Trend-following systems belong in
TREND. Mean-reversion belongs in RANGE, and only when Persistence confirms
the market is actually reverting rather than merely quiet. COIL means the
setup has not arrived yet. VOLATILE CHOP means nothing you own works here.
3. Read Persistence before choosing an approach. If it reads Random, the
market has no memory to exploit in either direction, and both momentum and
mean-reversion are coin flips.
4. Use vs Typical for position management, not entry. An extended regime is
not a reversal signal. It is a reason to stop adding and to tighten what
you already hold.
5. Let the ribbon and score do the work on the price chart. The dashboard can
be forced onto the main pane so the engine occupies a pane without costing
you chart real estate.
SETTINGS THAT ACTUALLY MATTER
RANKING LOOKBACK is the important one. It must span several complete regime
cycles on your timeframe or every axis will rank near the middle and
everything will read TRANSITION. 250 bars on a daily chart is roughly a year -
a real baseline. 250 bars on a 5-minute chart is under a day, and is not.
On intraday timeframes, raise it substantially.
MINIMUM REGIME RUN trades responsiveness for stability. Higher values give a
calmer read and a cleaner duration baseline at the cost of confirming changes
later. Set it to 1 to see the unfiltered classification.
CHOP PENALTY controls how hard low-efficiency volatility is punished. Set it
to 0 and the score becomes pure efficiency rank.
EFFICIENCY and VOLATILITY thresholds are percentiles, not raw values. They do
not need adjusting per instrument. That is the point.
LIMITATIONS - STATED PLAINLY
- This is a lagging, descriptive tool. It classifies conditions that have
already formed. It does not forecast, and it cannot tell you a regime is
about to end.
- Confirmation costs lag. A genuine regime change registers a few bars late by
design. That is the price of not flickering.
- The maturity baseline is learned from visible chart history and rebuilds
whenever settings, symbol, or timeframe change. It is not persistent memory.
Early in a chart, or for a rarely-occurring regime, the sample is thin. The
n= value tells you when to discount it.
- On intraday equity charts, overnight gaps inflate ATR and distort the
persistence reading. Daily and above, or extended hours, handle this better.
- Autocorrelation is a weak statistic on short samples. Persistence readings
close to zero should be read as "no information", not as a subtle signal.
- Efficiency is directionless. TREND tells you a trend exists, not which way
it points. Pair it with something that reads direction.
- No regime classification is correct at the moment it matters most, which is
the turn. Nothing here changes that.
This script is open-source. Read the code, disagree with it, improve it.
This is an analytical tool for studying market conditions. It is not financial
advice, and it does not generate trade recommendations. Trading involves risk
of loss.
Chỉ báo