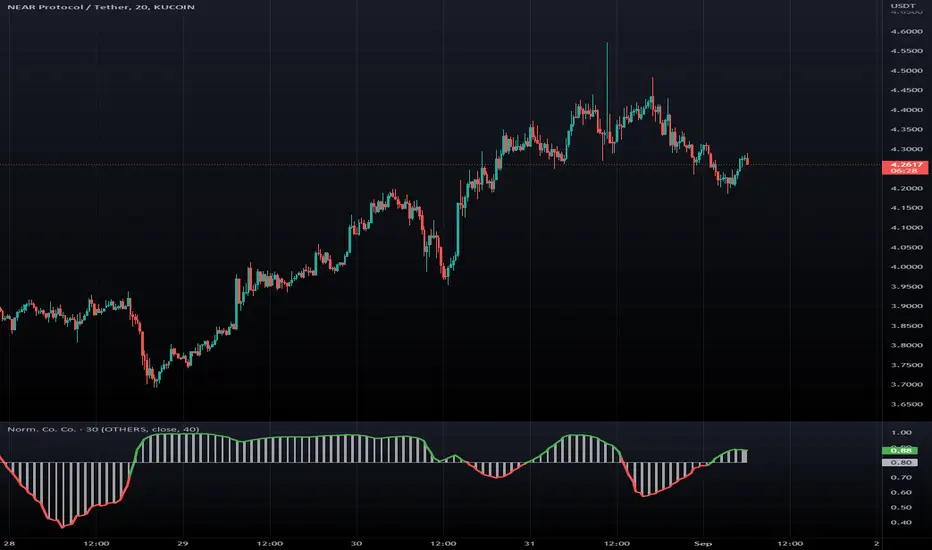
Correlation of Returns | NickJoanCorrelation of Returns | NickJoan
Core Idea
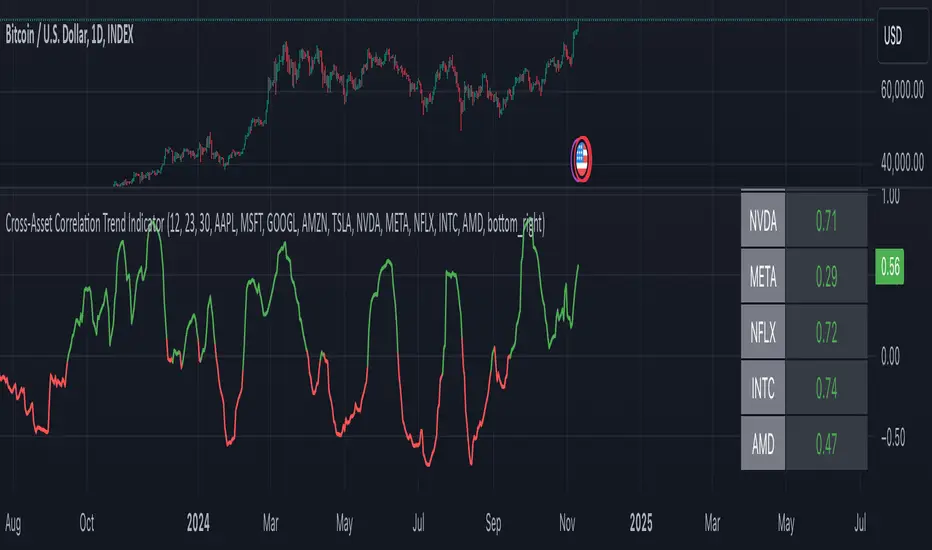
Correlation of Returns measures how closely the chart symbol and a selected comparison symbol move together over time.
Unlike traditional correlation indicators that compare raw price levels, this script calculates the correlation between logarithmic returns. This focuses on the relationship between the assets’ periodic movements rather than their absolute prices.
The indicator is useful for studying:
• Market co-movement.
• Diversification.
• Hedging relationships.
• Relative strength behavior.
• Portfolio construction.
• Risk management.
Calculation Logic
The indicator works through three steps:
1. Source selection
The script uses the selected source from the chart symbol and the same source from a user-selected comparison symbol.
2. Log return calculation
For each symbol, the script calculates the one-bar logarithmic return:
• Log return: log(current source / previous source)
Log returns are used because they measure percentage-based price changes and are suitable for comparing assets with different prices.
3. Rolling correlation
The script calculates the Pearson correlation between the two return series over the selected lookback window.
The result ranges from -1 to +1:
• +1: The two returns move together perfectly.
• 0: No linear relationship between the returns.
• -1: The two returns move in opposite directions.
Chart Output
The indicator displays:
• A rolling correlation line.
• A +1 reference line for perfect positive correlation.
• A 0 reference line for no correlation.
• A -1 reference line for perfect negative correlation.
How to Use It
Positive correlation
When the indicator is above zero, the two symbols have generally been moving in the same direction over the selected period.
Higher positive values indicate stronger co-movement.
Negative correlation
When the indicator is below zero, the two symbols have generally been moving in opposite directions.
Lower values indicate a stronger inverse relationship.
Changing correlation
Correlation is not permanent. It can increase or decrease as market conditions change.
• Rising correlation: the assets are becoming more closely linked.
• Falling correlation: the relationship is weakening.
• Crossing zero: the dominant relationship has changed from positive to negative, or vice versa.
Inputs
Comparison Symbol
Selects the symbol to compare with the chart symbol.
Source
Selects the price source used for both assets. The default is close.
Length
Defines the number of bars used to calculate the rolling correlation.
Shorter lengths react faster but may be noisier.
Longer lengths provide a smoother and more stable estimate but may respond more slowly to changing relationships.
Practical Interpretation
Examples:
• A value near +0.90 indicates strong positive co-movement.
• A value near +0.50 indicates moderate positive co-movement.
• A value near 0 indicates little linear relationship.
• A value near -0.50 indicates moderate inverse co-movement.
• A value near -0.90 indicates strong negative co-movement.
Best Use Cases
Typical uses include:
• Comparing an altcoin with Bitcoin.
• Measuring the relationship between an asset and an index.
• Finding potentially diversifying assets.
• Monitoring hedge relationships.
• Studying market-wide risk behavior.
• Confirming whether two markets are moving together.
Notes
It does not prove causation and should not be used as a standalone entry or exit signal.
Correlation can change significantly across different:
• Lookback lengths.
• Timeframes.
• Market regimes.
• Trading sessions.
• Data providers.
For the most meaningful comparison, use symbols with compatible trading sessions, timeframes, and data quality.
Chỉ báo