EMA Cloud [PhantomCipher]EMA Cloud
EMA Cloud shows the trend as a shaded band between two exponential moving averages, with a third EMA drawn as a longer-term reference line.
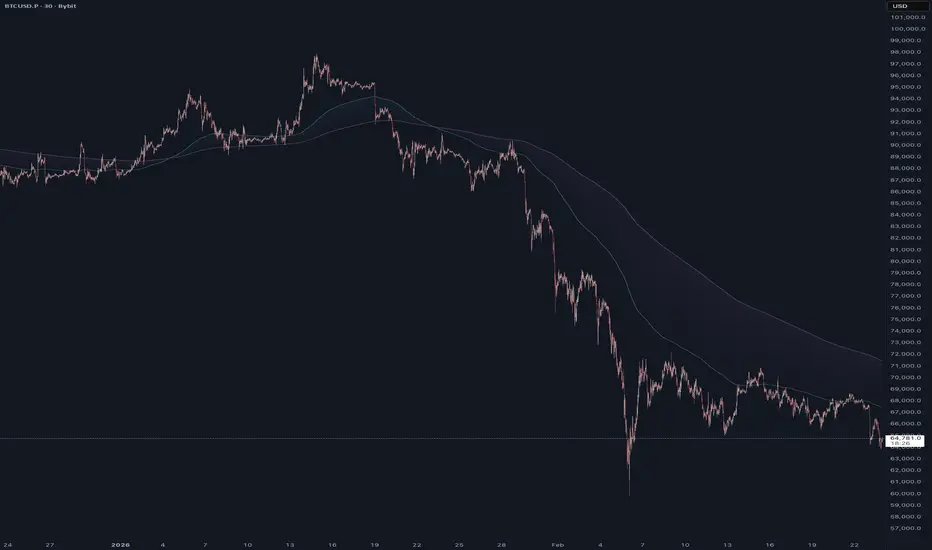
SNAPSHOT: the indicator on a clean chart, with the cloud in both colours and the 200 EMA line visible
How it works
Cloud: the area between a fast EMA (50 by default) and a slow EMA (100 by default) is filled. It's green while the fast EMA is at or above the slow EMA (uptrend) and red while it's below (downtrend).
EMA lines: the fast and slow EMAs are also drawn as lines that change colour with the trend.
Reference line: a separate EMA (200 by default) is drawn as a single line. It's not part of the cloud and its colour doesn't change with the trend. Use it to see where price sits against the longer-term trend.
Settings
Inputs tab: the length of each EMA, grouped into "EMA Cloud" (fast and slow) and "EMA Line" (the reference EMA).
Style tab: every colour, line width and on/off switch, including separate uptrend and downtrend colours for the cloud and for each EMA line.
Alerts
EMA Trend Up: fires when the fast EMA crosses above the slow EMA.
EMA Trend Down: fires when the fast EMA crosses below the slow EMA.
Create the alert with Once Per Bar Close . A cross that happens part-way through a bar can reverse before the bar closes.
The trend flip comes from comparing the two EMAs:
EMA_UpTrend = ta.ema(close, 50) >= ta.ema(close, 100)
SNAPSHOT: close-up of a trend flip, with the cloud changing colour where the two EMAs cross
How to use it
A change in cloud colour marks a shift in trend between the two EMAs. The 200 EMA adds context. For example, you might take only uptrend signals while price is above it, and only downtrend signals while price is below it.
Example chart: BYBIT:BTCUSDT.P
This indicator shows trend conditions. It's not a trading signal on its own, so combine it with your own analysis and risk management.
Chỉ báo