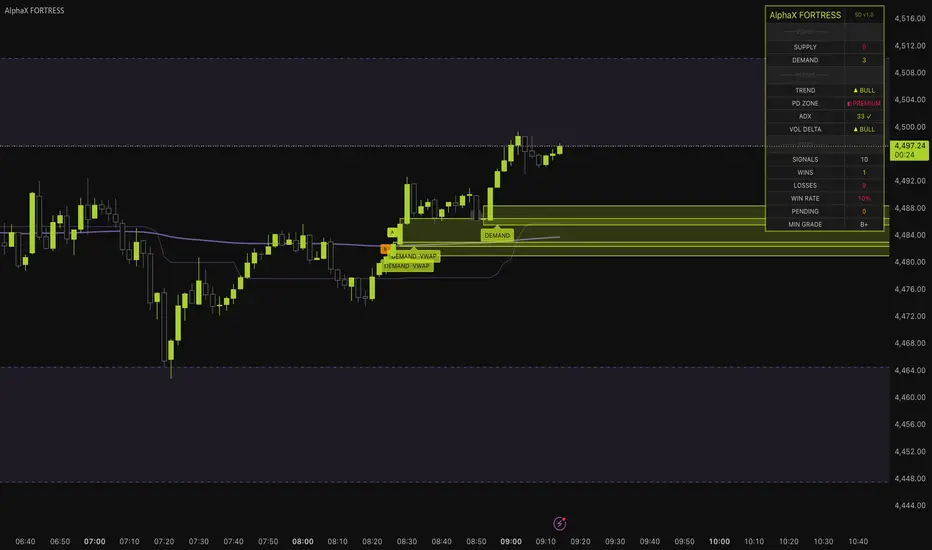
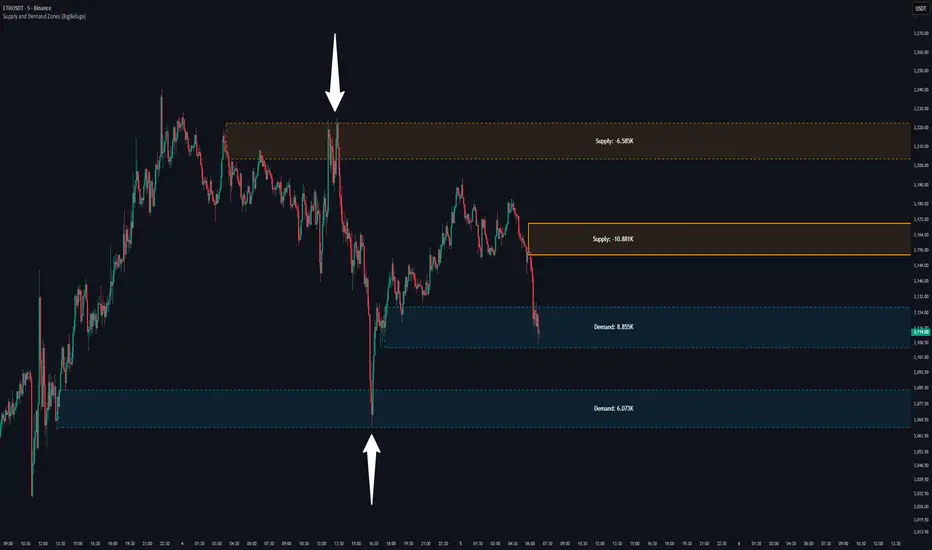
Ayoub SMC AnalystAyoub SMC Analyst is a market-structure and price-action analysis indicator designed to help traders study market structure, liquidity behavior, Fair Value Gaps (FVGs), premium/discount areas, trend direction, and potential price targets from a single chart.
WHY THIS SCRIPT WAS CREATED
The purpose of Ayoub SMC Analyst is to organize important market-structure information directly on the chart without requiring multiple separate indicators.
The script focuses on structured market analysis rather than presenting guaranteed buy or sell signals. Its objective is to help traders identify important areas and build their own trading scenarios.
CORE FEATURES
• Higher High (HH)
• Higher Low (HL)
• Lower High (LH)
• Lower Low (LL)
• Bullish and Bearish Break of Structure (BOS)
• Buy-side and sell-side liquidity sweep detection
• Bullish and bearish Fair Value Gap (FVG) identification
• Premium and Discount areas
• Equilibrium level
• Major support and resistance levels
• Short-term and long-term trend direction
• Conditional bullish and bearish target levels
• Projected market scenarios
• Configurable structure sensitivity
• Optional labels and target visibility
HOW IT WORKS
The indicator uses confirmed swing highs and swing lows to evaluate market structure. It compares recent structural points to identify HH, HL, LH and LL formations.
Break of Structure conditions are detected when price crosses important structural levels.
Liquidity sweep conditions are identified when price temporarily moves beyond a structural high or low and closes back across that level.
Fair Value Gaps are identified using a three-candle price imbalance condition.
Premium and Discount areas are calculated from the most recent valid structural range, with the midpoint used as equilibrium.
Potential target levels are calculated from the current structural range. These levels are scenario-based reference points and are not guaranteed future price destinations.
HOW TO USE
1. Add the indicator to a standard candlestick chart.
2. Adjust Structure Sensitivity according to the timeframe and market.
3. Use HH, HL, LH and LL to understand the current market structure.
4. Monitor BOS and liquidity sweep markers around important structural levels.
5. Use FVG and Premium/Discount information as additional confluence.
6. Treat projected targets as analytical reference levels rather than guaranteed outcomes.
7. Combine the indicator with your own risk management and market analysis.
ORIGINALITY AND PURPOSE
Ayoub SMC Analyst is designed as a unified market-structure analysis tool with a specific focus on organizing structural levels, liquidity events, imbalance conditions, trend direction and scenario-based targets in one visual framework.
The goal is to reduce unnecessary chart clutter while keeping the main structural information visible and understandable.
LIMITATIONS
This indicator does not predict the future with certainty and does not guarantee profitable trades.
Market structure can change as new price information develops. Swing-based calculations can also change as new confirmed pivots appear.
The indicator is an analytical tool and should not be considered financial advice. Traders should independently evaluate market conditions, position sizing and risk before making any trading decision.
CHART EXAMPLES
TradingView chart examples:
Chỉ báo