Bottom and Top finder [theUltimator5]🧭 Bottom and Top Finder — Multi-Symbol Momentum Divergence Detector
The Bottom and Top Finder by theUltimator5 is a highly configurable, momentum-based indicator designed to identify potential market reversal points using a multi-symbol relative strength comparison framework. It evaluates Directional Movement Index (DMI) values from up to three correlated or macro-influential assets to determine when the current instrument may be approaching a bottom (oversold exhaustion) or a top (overbought exhaustion).
🧠 How It Works
This script computes both the +DI (positive directional index) and -DI (negative directional index) for:
The currently selected chart symbol
Up to three user-defined reference symbols (e.g., sector leaders, macro ETFs, currencies, volatility proxies)
It uses a logarithmic percent-change approach to normalize all movement metrics, ensuring results are scale-invariant and price-neutral — meaning it works consistently whether a stock trades at $1 or $100,000. This makes the comparison between different assets meaningful, even if they trade on different scales or volatility levels.
The indicator then:
Compares the +DI values of the reference symbols to the current symbol’s +DI → seeking bottoming signals (suggesting the current symbol is unusually weak).
Compares the -DI values of the reference symbols to the current symbol’s -DI → seeking topping signals (suggesting the current symbol is unusually strong on the downside).
These comparisons are aggregated using a weighted average, where you control the influence (multiplier) of each reference symbol.
🔁 Trigger Logic
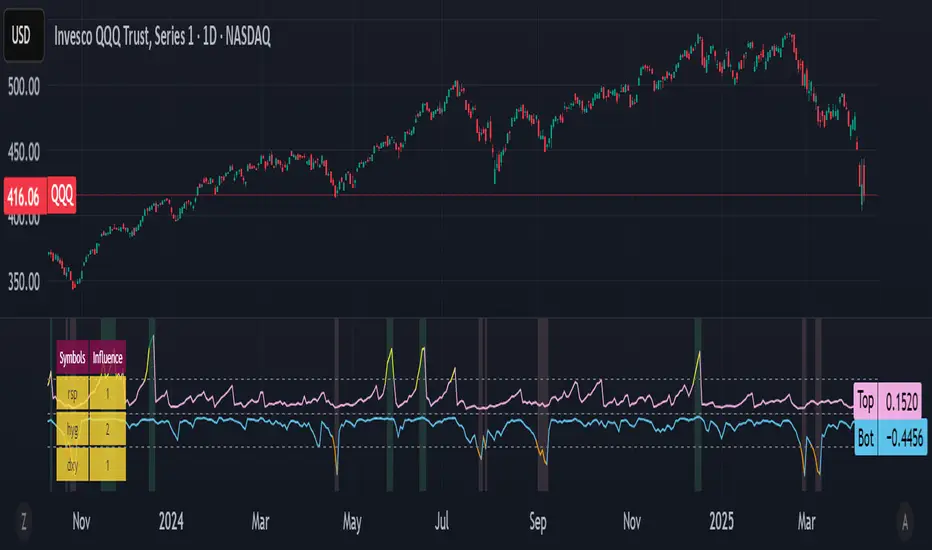
The indicator generates two dynamic lines:
Bot Line (Bottom Line): Based on reference +DI vs. current +DI
Top Line: Based on reference -DI vs. current -DI
If the Bot Line rises above the user-defined threshold, it may signal that capitulation or oversold conditions are developing. Similarly, if the Top Line rises above its threshold, it may indicate a blow-off top or overbought selling pressure.
To avoid false positives, a second smoothing-based condition must also be met:
The line must significantly exceed its moving average, confirming momentum divergence.
When both conditions are true, the indicator highlights the background in light red (bottom alert) or green (top alert) for easy visual scanning.
🔧 Key Inputs & Customization
You can fine-tune this tool using the following parameters:
Smoothing Length: Controls how smooth or sensitive the DI values are.
Reference Symbols: Up to 3 assets (default: RSP, HYG, DXY) — customizable for sector, macro, or inverse relationships.
Influence Multipliers: Adjust the weight each symbol has on the overall signal.
Display Options:
Toggle to highlight the chart background during trigger conditions.
Toggle to display a real-time table of reference symbols and their influence levels.
📈 Visual Output
Two plotted lines: One for bottoms and one for tops
Dynamically colored based on how far they exceed thresholds
Background highlights to mark trigger zones
Optional table displaying the current reference symbol setup and weights
🛠 Best Use Cases
This tool is ideal for:
Identifying short-term tops or bottoms using momentum exhaustion
Spotting divergences between an asset and broader market or sector health
Macro analysis with assets like SPY, QQQ, GME, MSFT, BTC, etc...
Pair trading signals or market breadth confirmation/disagreement
It complements other technical indicators like RSI, MACD, Bollinger Bands, or price structure patterns (double bottoms/tops, etc.)
Chỉ báo