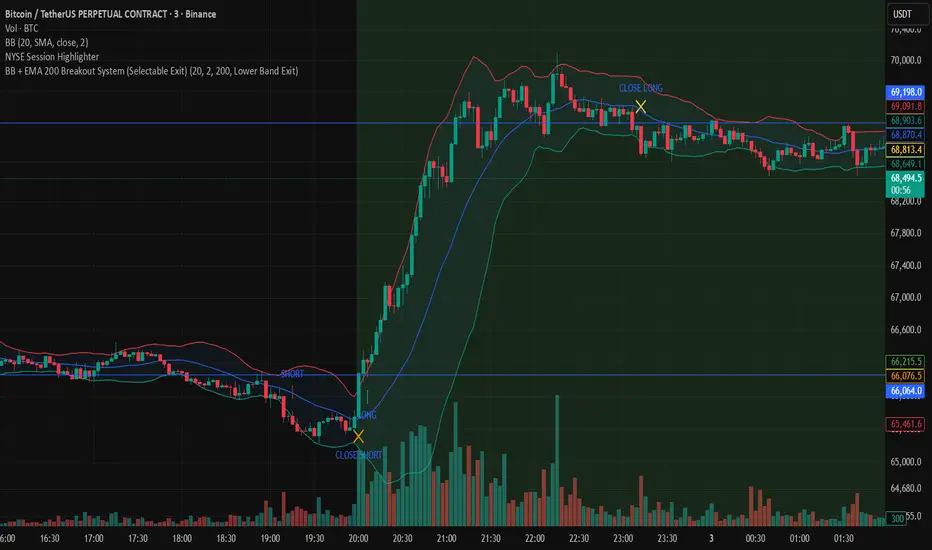
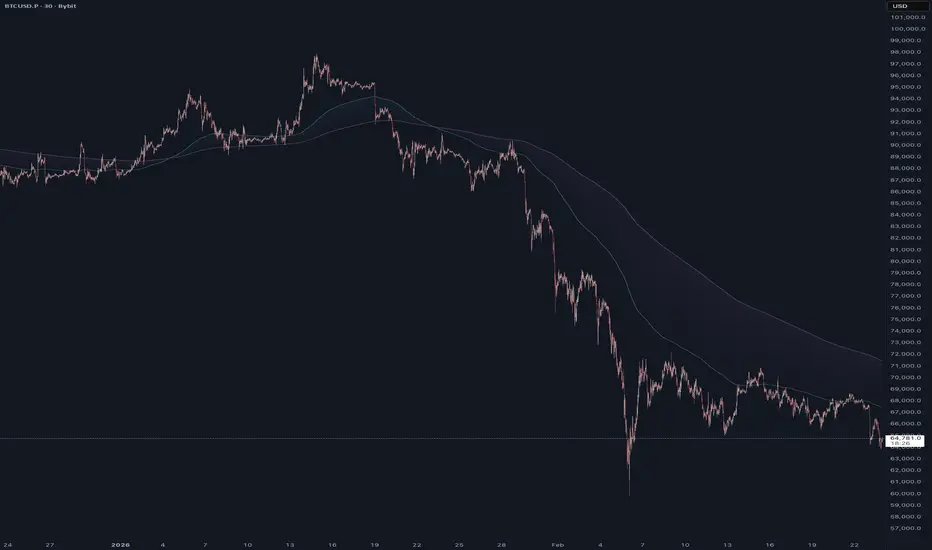
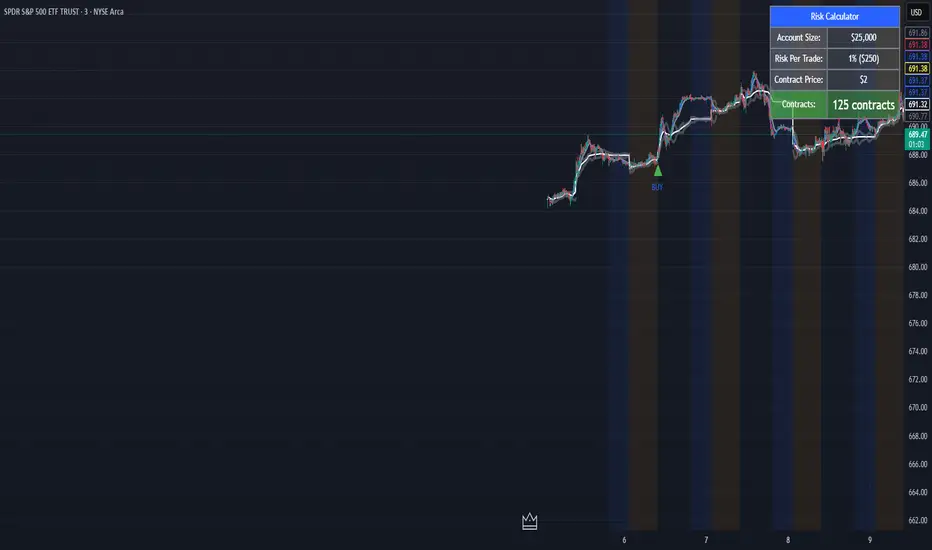
BB + EMA 200 Breakout System (Selectable Exit)this is my BB + EMA 200 Breakout System (Selectable Exit). seems to be working as of nowChỉ báocủa vrypto80831
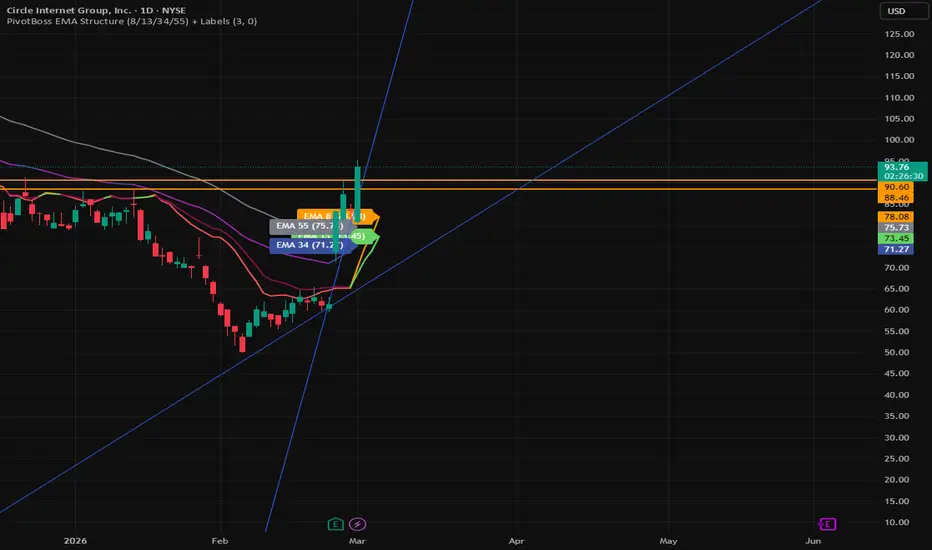
PivotBoss EMA Structure (8/13/34/55) + LabelsPivotBoss EMA Shows the EMA name + current value Keeps labels anchored to the latest bar Updates dynamically Avoids creating multiple labels every candleChỉ báocủa TradeTheStates7
Configurable EMA Stack StrategyThis strategy uses a configurable exponential moving average (EMA) stack to define directional bias and an EMA cross to manage entries and exits. The script calculates six user-defined EMAs (EMA 1 through EMA 6). Each EMA can be shown or hidden on the chart independently, and each can also be included or excluded from the bias filter. When multiple EMAs are enabled for bias, the script requires them to be strictly aligned in sequence: Bullish bias: shorter enabled EMAs must be above longer enabled EMAs Bearish bias: shorter enabled EMAs must be below longer enabled EMAs Trade execution is driven by the EMA 1 / EMA 2 cross: Long entries occur when bullish bias is active and EMA 1 crosses above EMA 2, or when bullish bias becomes active while EMA 1 is already above EMA 2 Short entries occur when bearish bias is active and EMA 1 crosses below EMA 2, or when bearish bias becomes active while EMA 1 is already below EMA 2 Long exits occur when EMA 1 crosses below EMA 2 Short exits occur when EMA 1 crosses above EMA 2 Default script settings use 0.10% commission and 1 tick of slippage. These are baseline placeholders for testing and should be adjusted to match the instrument, market, and timeframe being evaluated. This is a simple, transparent trend-following baseline designed for testing EMA alignment behavior across different symbols and timeframes. The main configurable element is not a proprietary signal model, but the ability to control which EMAs participate in the bias stack and which EMA plots are visible on the chart. That makes it useful as a flexible template for studying how stricter or looser EMA alignment changes trade frequency and behavior. Default strategy properties currently include commission and slippage. Those settings should be reviewed and adjusted to fit the market being tested. TradingView’s strategy rules require realistic cost assumptions, and if you change the defaults used in the script, the publication description should match the settings shown in your published backtest. Important notes: This is not presented as a complete trading system or a promise of performance Results will vary by symbol, timeframe, market conditions, fees, slippage, and position sizing This script is intended as an educational and analytical baseline that users can test and adapt to their own processChiến lượccủa E_M_C_S11
High beta EMA V4To trade high beta thematic stocks. This is an aggressive strategy.Chỉ báocủa azino122Cập nhật 9
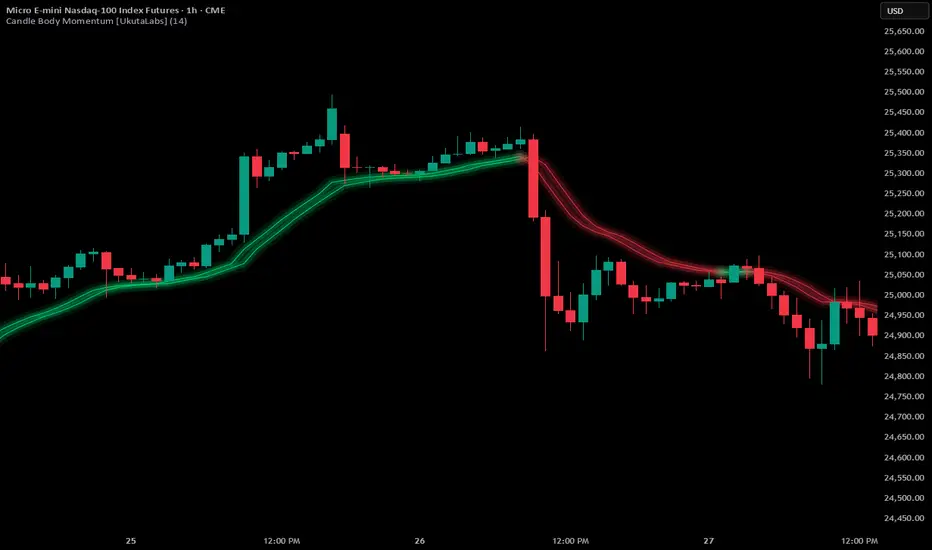
Candle Body Momentum [UkutaLabs]█ OVERVIEW Candle Body Momentum is a price-action driven indicator that measures directional strength by comparing an Exponential Moving Average (EMA) of the closing price against an EMA of the opening price. Instead of relying on traditional momentum formulas, this tool focuses purely on the candle body — the space between open and close — to reveal which side of the market is in control. When the EMA of the close is above the EMA of the open, buyers are demonstrating sustained pressure. When the EMA of the close is below the EMA of the open, sellers are in control. This simple comparison creates a clean and intuitive view of real directional momentum. █ HOW IT WORKS • Calculates an EMA of the closing price • Calculates an EMA of the opening price • Compares the two values to determine directional bias • Displays the relationship visually for quick interpretation Because candle bodies represent commitment (not just volatility), this method filters out much of the noise created by wicks and intrabar spikes. █ HOW TO USE Trend Confirmation Use Candle Body Momentum to confirm directional bias. If price is trending and the close EMA remains above the open EMA, the trend is supported by sustained buying pressure. Momentum Shifts Crossovers between the two EMAs can signal potential shifts in control before traditional moving average systems react. Pullback Validation During retracements, watch whether body momentum flips temporarily or remains aligned with the broader trend. Market Conditions • Strong separation = strong momentum • Compression = weakening momentum • Frequent crossovers = ranging conditions █ WHY IT’S DIFFERENT Traditional momentum indicators use mathematical derivatives of price. Candle Body Momentum focuses on something simpler and often more meaningful: Who is consistently closing stronger than they opened? This gives traders a clean, price-driven perspective on directional strength without unnecessary complexity.Chỉ báocủa UkutaLabs496
EMA and Dow Theory Strategies V3Overview EMA and Dow Theory Strategies V3 is a major refinement of V2, focused on three goals: reducing overfitting, filtering out range-bound markets, and simplifying the parameter set from 13 inputs down to just 5. The core logic remains the same — combining Dow Theory swing structure with EMA trend direction — but V3 replaces the dual-EMA crossover system and OTHERS.D correlation filter with a single EMA slope judgment and an ADX-based range filter. The result is a cleaner, more robust strategy that performs more consistently across different assets and timeframes. What Changed from V2 Removed: Fast EMA / Slow EMA crossover → replaced by single EMA slope direction Index Fast EMA / Index Slow EMA (OTHERS.D correlation) → removed entirely RSI filter (overbought/oversold) → removed (was not functioning effectively) Scale adjustment parameter → removed Added: ADX filter (period fixed at 14) → skips entries during sideways/ranging markets Single EMA slope judgment → trend direction determined by whether EMA is rising or falling Result: Parameters reduced from 13 → 5 Parameters & Recommended Ranges EMA Period | Default: 50 | Range: 30–100 Shorter for high-volatility assets, longer for stable ones. ATR Multiplier | Default: 4.0 | Range: 2.5–6.0 Controls TP distance. Higher = wider targets. Stop Loss (%) | Default: -6.0 | Range: -4 to -10 Wider for volatile assets, tighter for BTC/ETH. ADX Threshold | Default: 18.0 | Range: 15–28 Higher = stricter range filter, fewer but higher-quality trades. Swing Detection Period | Default: 4 | Range: 2–14 Smaller = more sensitive to swing highs/lows. Recommended Settings by Asset Type Meme coins (DOGE, SHIB, etc.) EMA: 44–55 / ATR: 3.5–5.0 / SL: -6 to -8% / ADX: 18–22 / Swing: 3–5 Major assets (BTC, ETH) EMA: 55–80 / ATR: 2.5–4.0 / SL: -4 to -6% / ADX: 20–25 / Swing: 5–10 Mid-cap alts (SOL, SUI, etc.) EMA: 35–55 / ATR: 4.0–5.5 / SL: -5 to -7% / ADX: 18–23 / Swing: 4–7 Small-cap alts EMA: 30–50 / ATR: 4.5–6.0 / SL: -7 to -10% / ADX: 18–22 / Swing: 3–5 Recommended Settings by Timeframe 1–5 min: ADX threshold 15–20 (ADX tends to be lower on short timeframes) 15 min – 1 hour: ADX threshold 18–23 2–4 hour: ADX threshold 20–25 Entry Conditions Long: EMA slope rising AND Dow Theory trend up AND ADX > threshold Short: EMA slope falling AND Dow Theory trend down AND ADX > threshold Exit Conditions TP1: +ATR×1 → close 30% TP2: +ATR×2 → close 30% TP3: +ATR×3 → close 30% Stop Loss: fixed % from entry price → full close Trend reversal: Dow Theory swing flip → full close Visual Features EMA line: green when rising, red when falling Gray background: ADX below threshold (range-bound zone — no entries) Gradient zones: distance from price to swing high/low 4H reference: higher timeframe swing levels displayed This strategy is designed for trend-following on crypto assets, primarily on the 1H–4H timeframe. Always backtest on your target asset before live trading. Past performance does not guarantee future results. 🇯🇵 日本語 EMA and Dow Theory Strategies V3 概要 EMA and Dow Theory Strategies V3 は、V2を大幅に改良したバージョンです。主な改善点は3つ——過学習リスクの低減、横ばい相場のフィルタリング、そしてパラメーター数を13個から5個へのスリム化です。 コアロジックはV2から引き継いでいます。ダウ理論のスイング構造とEMAのトレンド方向を組み合わせてエントリーを判断します。ただしV3では、デュアルEMAクロスとOTHERS.D相関フィルターを廃止し、1本のEMA傾きとADXによるレンジフィルターに置き換えました。結果として、より汎用性が高く、異なる銘柄・時間足でも安定して機能する設計になっています。 V2からの主な変更点 削除したもの: Fast EMA / Slow EMA クロス → EMA1本の傾き判断に統合 Index Fast EMA / Index Slow EMA(OTHERS.D相関)→ 完全削除 RSIフィルター(過熱・売られすぎ判定)→ 削除(実質機能していなかったため) スケール調整パラメーター → 削除 追加したもの: ADXフィルター(期間14固定)→ 横ばい相場でのエントリーをスキップ EMA傾き判断 → EMAが上向きか下向きかでトレンド方向を判定 結果:パラメーター数を 13個 → 5個 に削減 パラメーターと推奨設定範囲 EMA期間 | デフォルト: 50 | 推奨範囲: 30〜100 ボラが高い銘柄は短め、安定銘柄は長め。 ATR倍率 | デフォルト: 4.0 | 推奨範囲: 2.5〜6.0 TP距離の基準。大きいほど利確ラインが遠くなる。 損切り(%) | デフォルト: -6.0 | 推奨範囲: -4〜-10 ボラが高い銘柄は広め、BTC/ETHはタイトでOK。 ADXしきい値 | デフォルト: 18.0 | 推奨範囲: 15〜28 高いほどレンジ除外が厳しく、トレード数が減り精度が上がる。 スイング検出期間 | デフォルト: 4 | 推奨範囲: 2〜14 小さいほどスイング高値・安値への感度が高くなる。 銘柄タイプ別おすすめ設定 ミーム系(DOGE・SHIBなど) EMA: 44〜55 / ATR倍率: 3.5〜5.0 / 損切り: -6〜-8% / ADX: 18〜22 / スイング: 3〜5 主要銘柄(BTC・ETH) EMA: 55〜80 / ATR倍率: 2.5〜4.0 / 損切り: -4〜-6% / ADX: 20〜25 / スイング: 5〜10 中堅アルト(SOL・SUIなど) EMA: 35〜55 / ATR倍率: 4.0〜5.5 / 損切り: -5〜-7% / ADX: 18〜23 / スイング: 4〜7 小型アルト EMA: 30〜50 / ATR倍率: 4.5〜6.0 / 損切り: -7〜-10% / ADX: 18〜22 / スイング: 3〜5 時間足別おすすめ設定 1〜5分足:ADXしきい値 15〜20(短期足はADXが低めになる傾向) 15分〜1時間足:ADXしきい値 18〜23 2〜4時間足:ADXしきい値 20〜25 エントリー条件 ロング:EMAが上向き AND ダウ理論トレンドが上昇 AND ADX > しきい値 ショート:EMAが下向き AND ダウ理論トレンドが下降 AND ADX > しきい値 イグジット条件 TP1:エントリーから +ATR×1 → 30%決済 TP2:エントリーから +ATR×2 → 30%決済 TP3:エントリーから +ATR×3 → 30%決済 損切り:設定%を超えたら全決済 トレンド反転:ダウ理論のスイングが逆転したら決済 チャートの見方 EMAライン:上向きのとき緑、下向きのとき赤に色が変わります グレー背景:ADXがしきい値を下回っている横ばいゾーン(このゾーンではエントリーしません) グラデーションゾーン:現在値からスイング高値・安値までの距離を視覚化 上位足表示:4時間足のスイングレベルを参考表示 このストラテジーは主に1時間〜4時間足の暗号資産トレンドフォローを想定して設計されています。実運用の前に必ずご自身の対象銘柄・時間足でバックテストを行ってください。過去の結果は将来の利益を保証するものではありません。Chiến lượccủa mm_mitsuya47
5 EMA StrategyThis indicator identifies red candles that form completely above the 5 EMA and evaluates the very next candle for confirmation or possible reversal. It is designed to allow only one active signal at a time to reduce noise. More features and detailed usage instructions will be added in future updates.Chỉ báocủa avithekkcCập nhật 7795
Nova Statistical Filtering Oscillator [Pineify]Nova Statistical Filtering Oscillator - Advanced Mean Reversion Trading Tool A sophisticated statistical oscillator that identifies overbought and oversold market conditions using Z-Score normalization and dynamic volatility bands The Nova Statistical Filtering Oscillator (NSFO) is an advanced technical analysis tool designed to help traders identify potential mean reversion opportunities in financial markets. By combining statistical price normalization with adaptive smoothing techniques, this indicator provides a unique approach to detecting extreme price conditions and anticipating momentum reversals. Z-Score based statistical analysis Triple Exponential Moving Average (TEMA) smoothing Dynamic volatility bands Automatic mean reversion signal generation Gradient color visualization Customizable parameters Statistical overbought/oversold detection Noise reduction through TEMA smoothing Adaptive bands that adjust to market volatility Clear buy and sell signal indicators Visual gradient coloring for quick analysis Configurable alert conditions The NSFO operates through a sophisticated three-step statistical process that transforms raw price data into actionable trading signals. Step 1: Z-Score Calculation The indicator first calculates the Z-Score, which measures how many standard deviations the current price is from its historical mean. This statistical normalization allows traders to objectively identify when price has moved to statistically extreme levels. The formula uses a configurable lookback period (default 20 bars) to compute both the simple moving average (mean) and standard deviation. A Z-Score greater than +2 or less than -2 indicates statistically rare extreme conditions, occurring approximately only 5% of the time. Step 2: TEMA Smoothing Raw Z-Score values can be volatile and produce choppy signals. The NSFO applies Triple Exponential Moving Average (TEMA) smoothing to reduce market noise while maintaining responsiveness. TEMA combines three successive EMAs using the formula: 3×EMA1 - 3×EMA2 + EMA3, achieving smoother results with less lag compared to traditional moving averages. Step 3: Dynamic Volatility Bands Unlike static overbought/oversold levels, the NSFO creates adaptive bands based on the volatility of the smoothed oscillator itself. This self-referential approach automatically adjusts to changing market conditions - becoming wider during volatile markets and narrower during calm periods. The bands are calculated using the standard deviation of the smoothed oscillator multiplied by a configurable factor (default 2.0). The NSFO is built on the fundamental principle of mean reversion - the statistical observation that prices tend to return to their average over time. This concept has been validated through decades of market research and forms the basis of many successful trading strategies. Statistical Extremes as Trade Setups : When the oscillator reaches the upper or lower bands, it indicates the price has moved to a statistically extreme level. These conditions often precede reversals as the market corrects itself back toward the mean. Momentum Confirmation : The gradient coloring system provides instant visual feedback on current momentum. When the oscillator transitions from extreme levels toward the center, it confirms that momentum is shifting and the reversal may be gaining strength. Time Frame Flexibility : The NSFO performs well across various time frames, from intraday charts to weekly frames. Shorter time frames generate more signals but require tighter risk management, while longer time frames produce fewer but potentially more reliable signals. The NSFO uniquely combines three distinct technical concepts into a cohesive system: Statistical Analysis (Z-Score) : Provides the mathematical foundation for identifying extreme price conditions using probability theory. This transforms subjective "overbought" or "oversold" labels into quantifiable statistical measurements. Moving Average Smoothing (TEMA) : Reduces the inherent noise in raw statistical values while maintaining sensitivity to genuine price movements. The triple-layer EMA approach minimizes lag that typically affects simple moving averages. Volatility-Based Bands : Creates adaptive thresholds that automatically adjust to current market conditions. This dynamic approach outperforms fixed-level indicators by accounting for the reality that market volatility changes over time. The synergy between these three components creates a robust system where each element addresses a weakness in the others. The Z-Score provides statistical rigor, TEMA adds smoothness for actionable signals, and dynamic bands ensure the indicator remains effective across varying market conditions. The Nova Statistical Filtering Oscillator offers several distinctive features that set it apart from traditional technical indicators: Self-Referential Adaptation : The volatility bands are calculated from the oscillator's own standard deviation, creating a truly adaptive system that automatically adjusts to current market conditions without manual parameter changes. Gradient Visualization : The color gradient provides at-a-glance understanding of current market position relative to statistical extremes, making it easy to identify both extreme conditions and transitions. Zero Baseline Clarity : The central baseline at zero represents the statistical mean, providing an immediate visual reference point for understanding whether price is above or below its historical average. Clean Signal Generation : Buy and sell signals are generated only when the oscillator crosses back from extreme levels, filtering out premature entries and focusing on confirmed reversals. Using the NSFO effectively requires understanding both its signals and its limitations. Here's how to integrate it into your trading strategy: Identifying Overbought Conditions : When the oscillator crosses below the upper band (red line), it indicates the price has extended statistically above its average. This suggests a potential selling opportunity as the market may revert toward the mean. Identifying Oversold Conditions : When the oscillator crosses above the lower band (green line), it indicates the price has dropped statistically below its average. This suggests a potential buying opportunity as the price may bounce back toward the mean. Signal Confirmation : Wait for the oscillator to cross back toward the center (zero line) before entering a trade. This confirms the reversal is underway rather than just touching the extreme level. Trend Context : Always consider the broader trend direction. In strong trending markets, the oscillator may remain at extreme levels for extended periods. Use additional trend indicators for confirmation. Important Note: No indicator guarantees profitable trades. Always use proper risk management and consider combining NSFO with other technical or fundamental analysis tools for better decision-making. The NSFO provides several customizable parameters to suit different trading styles and market conditions: Statistical Window (default: 20) : Controls the lookback period for calculating mean and standard deviation. Higher values produce more stable readings but respond slower to price changes. Lower values are more responsive but may generate more false signals. Smoothing Length (default: 10) : TEMA period for reducing noise in the Z-Score. Higher values create smoother lines with more lag, while lower values are more responsive but potentially noisier. Bands Multiplier (default: 2.0) : Controls the width of dynamic bands in standard deviations. Higher values create wider bands, reducing false signals but potentially missing some opportunities. Lower values generate more signals but with increased noise. Color Customization : Traders can customize bullish (green) and bearish (red) colors to match their visual preferences or other indicators in their chart setup. The Nova Statistical Filtering Oscillator represents a sophisticated approach to identifying statistical extremes in financial markets. By combining Z-Score normalization with TEMA smoothing and dynamic volatility bands, it provides traders with a powerful tool for detecting potential mean reversion opportunities. Its adaptive nature ensures effectiveness across various market conditions, while the clear visual signals make it accessible to traders of all experience levels. Whether used as a primary trading system or as a confirmation tool alongside other indicators, the NSFO offers a unique perspective on market dynamics that can enhance your trading decisions. Remember to always test any new indicator thoroughly on historical data before using it with real capital, and maintain disciplined risk management practices regardless of the signals generated. This indicator is provided for educational and informational purposes only. Past performance does not guarantee future results. Trading financial markets involves substantial risk, and you should only trade with capital you can afford to lose. Always conduct your own research and consider your financial situation before making any trading decisions. Chỉ báocủa Pineify91
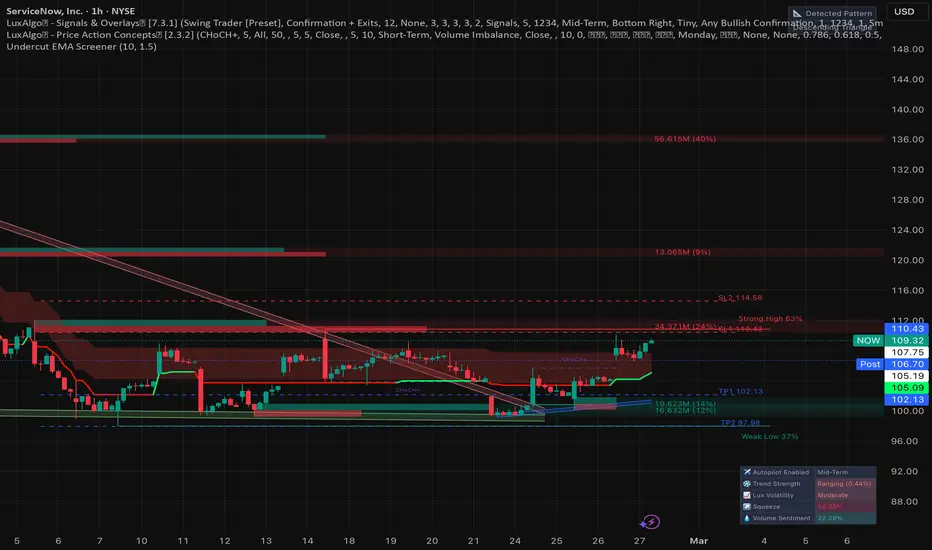
Undercut EMA ScreenerThe post by @ohiain advises swing traders to prioritize "undercut" setups—price action where a stock briefly breaks below a prior low or support level (like the 10EMA or previous swing low) to trigger stop-losses, then reverses upward—in the volatile February 2026 market, where S&P 500 gains mask choppy intraday swings. This strategy, often called "undercut and rally" (U&R), exploits false breakdowns for low-risk entries, as seen in thread examples like NASDAQ:WULF 's U&R off the 10EMA on recent trading days, allowing scaled positions with tight stops below the undercut low. Replies highlight practical application, with users sharing wins on leveraged ETFs like NASDAQ:CRWV and noting challenges in target-setting amid volatility, underscoring the post's call to keep trading simple by focusing solely on triggered undercuts rather than overcomplicating with multiple patterns. Chỉ báocủa cnirmal28
4 SMA in OneThe Simple Moving Average is used to identify the overall direction of the market trend by averaging price over a specific number of periods. The SMA helps traders determine whether the market is in an uptrend, downtrend, or sideways trend by smoothing out price fluctuations.Chỉ báocủa ElPumaJ3
Future EMA ProjectionAs traders, we constantly find ourselves looking at a chart after a sharp drop or rally, asking questions like: "If the price just chops sideways at this support level for the next two weeks, when exactly will the EMAs finally flatten out and catch up?" "If we bounce to the next resistance level, will that be enough to force a bullish crossover on the EMA 20 and 50?" Standard indicators can't answer this because they only plot historical data. The Future EMA Projection indicator solves this by allowing you to visualize "What-If" scenarios right on your chart. It calculates the complex EMA smoothing math for future, unprinted bars, and plots the exact trajectory of your moving averages based on your price assumptions. 🔑 Key Features Standard EMA Base: Plots three customizable historical EMAs (defaulting to 10, 20, and 50) as solid lines so you don't need a separate indicator. Dynamic Future Trajectories: Draws dotted lines extending into the future (the blank space on the right side of your chart) to show exactly where the EMAs are heading. Two "What-If" Modes: Last Close (Consolidation Mode): Automatically assumes the price will flatline at the very last traded price. Perfect for seeing how long it takes for EMAs to digest a recent volatile move and flatten out during a ranging market. Custom Price (Target Mode): Allows you to manually input a hypothetical future price. Perfect for testing breakout or breakdown scenarios to see how a specific price target would warp the moving averages. Precision Price Labels: Automatically generates small price tags at the very end of the projected lines, giving you the exact numerical value the EMA will hit at the end of the projection period. 💡 How to Use It in Your Trading Scenario 1: Surviving the Chop (Sideways Markets) After a steep decline to a support zone, set the Mode to "Last Close". Look at the dotted projection lines to see exactly how many bars (days/hours) it will take for the shorter-term EMAs to flatten out and cross back over the longer-term EMAs if the price just stays flat. This helps you avoid jumping into trades too early while the broader trend is still bleeding out momentum. Scenario 2: Testing Breakout Targets If you are eyeing a potential long entry, switch the Mode to "Custom Price" and enter your first take-profit target or the next major resistance level. The projection lines will instantly warp. You can visually verify if hitting that target will actually reverse the broader trend (e.g., causing an EMA 10/20 golden cross), or if it's just a dead-cat bounce within a larger bearish EMA structure. ⚙️ Settings - EMA 1, 2, 3 Length: Customize your moving average periods (Defaults: 10, 20, 50). - Bars to Project: How far into the future you want to draw the lines (Default: 60 bars). - Price Assumption: Toggle between "Last Close" or "Custom Price". - Custom Price (If Selected): The hypothetical target price for your What-If scenario.Chỉ báocủa echanxyz1124
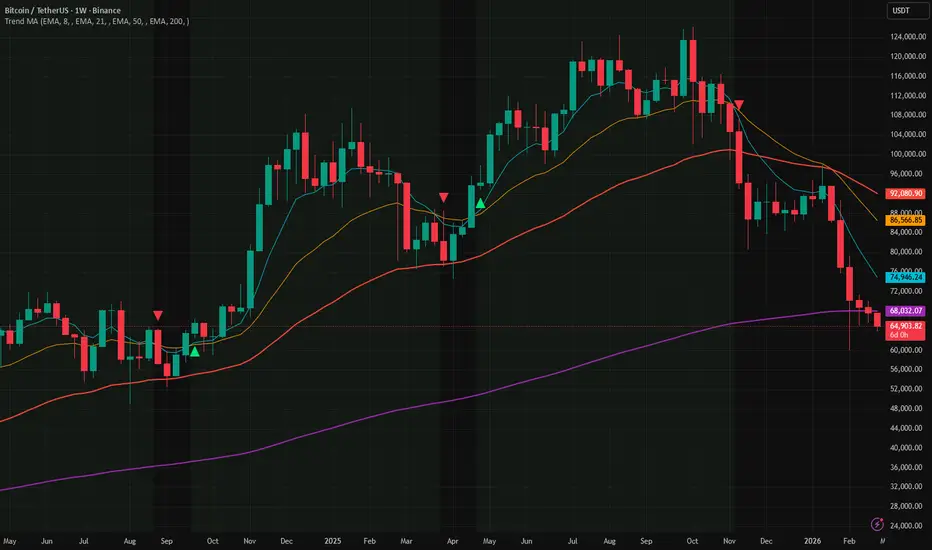
Trend Alignment Ribbon - Multi Timeframe Moving AveragesTrack trend direction across multiple timeframes — all in one view. Trend trading works best when the short, medium, and long-term views all agree. This indicator places four moving averages on your chart simultaneously and highlights the moment they fall into full alignment — giving you a simple, visual confirmation that a trend is in control. ──── What You're Looking At ──── Four smooth lines on your chart, each tracking price at a different speed: MA1 (fastest, default: 8 bars) — reacts quickly to price. The first line to turn when momentum shifts. MA2 (default: 21 bars) — short-to-intermediate direction. Confirms or challenges what MA1 is saying. MA3 (default: 50 bars) — the medium-term trend backbone. Widely watched by institutions. MA4 (slowest, default: 200 bars) — the long-term trend anchor. The most important line on most charts. ──── How to Read It ──── Green background — all four lines are stacked in order, fastest on top. The trend is strongly up. High-confidence environment for long trades. Red background — all four lines are stacked in reverse order. The trend is strongly down. High-confidence environment for short trades. No background — the lines are tangled or out of order. The market is ranging or in transition. Reduce risk or wait for clarity. Triangle up ▲ below a candle — the fast line just crossed above the medium line. Early momentum shift to the upside. Triangle down ▼ above a candle — the fast line just crossed below the medium line. Early momentum shift to the downside. ──── Multi-Timeframe Mode ──── Each of the four lines can be pinned to a different timeframe , independent of the chart you are on. For example, while viewing a 15-minute chart you can display the 200-bar average as it appears on the daily chart — so the big picture is always visible. Leave the Timeframe field blank to use the current chart's timeframe (default behaviour). ──── Settings ──── Each moving average has its own settings group (Moving Average 1–4): Show — toggle each line on or off independently. Type — choose between four calculation methods: EMA (Exponential) — reacts faster to recent price. Most commonly used. Default. SMA (Simple) — a plain average of all bars. Slower to react, widely respected by institutions. WMA (Weighted) — middle ground, heavier weight on recent bars. HMA (Hull) — very fast and smooth. Minimises lag while reducing noise. Length — how many bars are included in the average. Higher number = slower, smoother line. Timeframe — leave blank for the current chart. Enter 1D for daily, 1W for weekly, 4H for four-hour, etc. Color — fully customisable per line. Under Visuals : Ribbon Fill — fills the space between MA1 and MA4 with a transparent green or red shade. Useful for seeing trend strength at a glance. Alignment Background — highlights the chart background when all 4 lines agree on direction. On by default. Cross Signals — places small triangle markers on the chart when MA1 and MA2 cross. On by default. ──── Alerts ──── MA Bull Cross — the fast line crossed above the medium line MA Bear Cross — the fast line crossed below the medium line Full Bull Alignment — all 4 lines just entered bullish order for the first time Full Bear Alignment — all 4 lines just entered bearish order for the first time ──── Tips ──── Set an alert for Full Alignment — these moments often mark the start of the strongest, cleanest trend moves on any instrument. A cross signal that fires while the alignment background is already lit is a higher-confidence entry than a cross signal in a mixed or choppy environment. A "tight stack" of closely spaced lines means the trend is young and orderly. Wide spacing with tangled lines means the market is extended or breaking down — not an ideal entry point. On intraday charts, try pinning MA3 or MA4 to the daily timeframe. This keeps your long-term bias anchored without switching charts. All timeframe calculations use confirmed (closed) bars only — there is no repainting. Chỉ báocủa satoshi-signals39
EMA xPair [crlmx]EMA indicator pair with smooth gradient fill. Timeframe adjustable to fixed value or follow the chats. Key Features - Two configurable EMAs (default 8 / 24 on day TF) - 15 reference timeframes from 1min to Monthly - Gradient fill between EMAs - colour tracks the dominant line - Midline between the two EMAs - acts as a dynamic centre reference - Streamlined inputs / UI brought to you by crlmx Trading Applications - Use as trend filter, not entry trigger - Gradient fill enhances visual read on trend bias - Midline acts as support/resistance between the two EMAs - Daily 8/24 works across all instruments and timeframes - Daily 30/50 gives a very solid HTF trend signal across assets for swing / position trading - Recommended Settings Scalping (fast): EMA1: 8 | EMA2: 24 | TF: 1min | Chart: 1m–5m Scalping: EMA1: 8 | EMA2: 24 | TF: 3–5min | Chart: 1m–5m Day Trading: EMA1: 8 | EMA2: 24 | TF: Day | Chart: 15m–1H Swing Trading: EMA1: 30 | EMA2: 50 | TF: Day | Chart: 4H–1D Version History v1.21 (Latest - 23 Feb 2026) - Gradient fill between EMAs with transparency control - 15 reference timeframes (1min to Monthly) - Midline defaults to off Chỉ báocủa crlmx13
EMA Touch (5m) | Rolling Prev-EMA Limit | Time Window | SL/TP | Taking touch of the 10 EMA limit orders set by the previous bars ema level so entry is clean and set not chasing intra bar. you can change ema length stop and target size and time cutoffs. I use it on the 5 min for mnq between 945 and 3pm with a 75 point stop and a 150 point targetChiến lượccủa kalvey1630
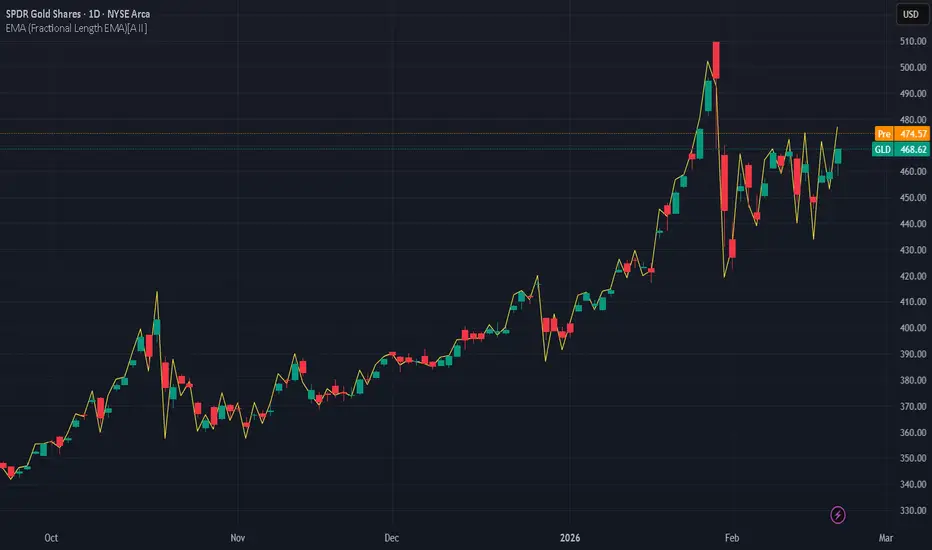
EMA (Fractional Length EMA) [A II]EMA (Fractional Length EMA) Description This is a standard Exponential Moving Average (EMA) with artificial length constraints removed. It preserves the classic EMA formula while allowing decimal and sub-1 length values. The goal is to provide a mathematically complete EMA implementation rather than a restricted preset. Basic Formula (Pine) alpha = 2.0 / (N + 1.0) ema = alpha * src + (1 - alpha) * ema Key Features Decimal Lengths Length accepts real numbers instead of integers. Provide finer control over weighting and transition between speeds— unlocks non-integer Fibonacci, golden ratio, or custom tuning. Sub-1 Lengths (N < 1) Allows smoothing factors greater than 1, which changes the filter’s response characteristics while remaining mathematically valid. When N < 1, the smoothing coefficient exceeds 1 and the recursive term becomes negative-weighted. In practice, the EMA overshoots the current price, then corrects in the opposite direction on the next bar, creating zig-zag oscillations around price. This enables: ■Strong responsiveness to change ■Impulse sensitivity ■Use within multi-pole or stacked filter designs ■Combination with slower averages for spread or difference constructions ■ Caveats Sub-1 values do not behave like traditional smoothing EMAs. Overshoot and higher reactivity are expected outcomes of the formula. Practical use example I use an EMA with n = 0.6 for responsiveness and then smooth it with a DEMA(12). The short length captures impulses quickly Whilst the higher length DEMA filters out noise whilst maintaining reactivity. This resembles a hybrid between an oscillator and a moving average, ideal for spotting momentum changes without being overwhelmed by noise. 🇯🇵 日本語概要(Japanese Summary) 本スクリプトは、EMA(指数移動平均)を数理仕様に忠実に実装した拡張版です。特徴として、期間パラメータに1未満を含む小数値を指定可能です。これにより、従来の整数期間では不可能だった極めて細かい重み付けの調整や、高速な応答特性のシミュレーションを実現します。計算式は標準的なEMAと同一であり、パラメータの制約のみを排除しています。 中文概要(Chinese Summary) 本指標為標準 EMA 的擴充實作,核心公式保持不變,但開放了小數與小於 1 的週期設定。透過取消整數限制,提供更微細的權重微調空間。小於 1 的週期在數學上依舊有效,可呈現不同的濾波動態。本工具旨在回歸 EMA 數理定義的完整靈活性,而非創造新指標。 Disclaimer: This script is a research tool for market structure analysis and educational purposes only. It does not constitute financial advice. Trading involves risk.Chỉ báocủa et20tradeviewCập nhật 6
Market Bias MonitorMarket Bias Monitor (MTF EMA Consensus Bias) The Market Bias Monitor is a multi-timeframe EMA-based bias indicator that helps traders quickly assess whether market structure is aligned bullish , bearish , or mixed across multiple timeframes. It uses an EMA structure of 8 / 21 / 50 across 10 timeframes , then aggregates those results into a single consensus bias signal. This helps reduce subjective chart reading and supports a more systematic top-down workflow. How It Works For each monitored timeframe, the script checks whether price and EMAs are aligned in a bullish or bearish structure. Bullish condition Price is above EMA 21 EMA 8 > EMA 21 EMA 21 > EMA 50 Bearish condition Price is below EMA 21 EMA 8 < EMA 21 EMA 21 < EMA 50 If neither condition is fully met, that timeframe is treated as neutral. The script then counts how many timeframes are bullish vs bearish. When the number of aligned timeframes reaches the user-defined minimum threshold (default: 5 ), it displays an overall bias using a background highlight. Bullish consensus -> Green background Bearish consensus -> Red background Monitored Timeframes 1W 1D 8H 6H 4H 3H 2H 1H 30M 15M Key Features Multi-timeframe bias engine ( 10 timeframes ) EMA consensus logic using 8 / 21 / 50 User-defined consensus threshold Background bias highlight Optional EMA overlay Custom EMA colors and widths Contrarian mode (reversed bias coloring) Per-timeframe status table Table/text color customization Typical Use Cases Directional filter (prefer longs in bullish consensus, shorts in bearish consensus) MTF confirmation for lower-timeframe setups Trend strength assessment based on timeframe agreement Bias shift monitoring via consensus/table changes Inputs Minimum Timeframes for Consensus (default: `5`) Show EMAs (toggle) EMA Colors EMA Widths Contrarian Mode Table / Text color customization Notes This indicator is designed as a bias and confirmation tool , not a standalone trading system. It works best when combined with price action, market structure, volume, and risk management. Disclaimer This script is for educational and analytical purposes only . It does not provide financial advice. Always use proper risk management.Chỉ báocủa GLITCHCAPITALCập nhật 75
MA Ribbon 5EMA | 20EMA | 50SMA | 200EMATitle: MA Ribbon 5 EMA | 20 EMA | 50 SMA | 200 EMA Description: A simple, clean multi-moving average indicator combining four of the most widely used trend-following tools in one script. Includes: 5 EMA – Fast momentum and short-term price action 20 EMA – Short-term trend direction 50 SMA – Medium-term trend and dynamic support/resistance 200 EMA – Long-term trend bias and major support/resistanceChỉ báocủa vamsinelluri777
Ang MTF CloudsThis is a Multi-Timeframe EMA Cloud indicator built for TradingView. It displays higher-timeframe (Daily & 1H) EMA clouds and current-timeframe EMA clouds on the same chart, using color-changing bands and lines to clearly show trend direction, support/resistance, and bullish/bearish momentum. Key Features 4 Higher-Timeframe EMA Clouds: Daily 50/55, Daily 21/24, 1H 34/50, 1H 5/12 2 Current-Timeframe Leading EMA Clouds: 5/12 & 34/50 for real-time trend and momentum Auto color-changing lines based on upward/downward movement Full customization: all colors and transparency are adjustable in settings Usage Identify trend direction Spot dynamic support & resistance Confirm signals using multi-timeframe confluence Gauge entry zones and trend strength 这是一款专为 TradingView 设计的多时间框架 EMA 云图指标,通过在同一图表上叠加不同周期和时间框架的 EMA(指数移动平均线)云,帮助交易者直观地识别趋势方向、支撑阻力位和潜在的交易信号。 🔍 核心功能 多时间框架 EMA 云 日线级别:包含两组 EMA 云(50/55、21/24),用于判断长期和中期趋势。 1 小时级别:包含两组 EMA 云(34/50、5/12),用于分析中短期和短期趋势。 当前图表周期:包含两组前置 EMA 云(5/12、34/50),用于捕捉即时的动量和趋势变化。 动态视觉反馈 趋势颜色:EMA 线的颜色会根据其上涨或下跌动态变化(如上涨为绿色,下跌为红色),直观反映动量方向。 多空云图:当短期 EMA 在长期 EMA 之上时,云图显示为看涨颜色;反之则显示为看跌颜色,清晰标示多空力量对比。 高度可定制化 所有颜色(包括 EMA 线、云图、上涨 / 下跌状态)和云图透明度都已改为可输入参数,无需修改代码,即可在指标设置面板中自由调整,打造个性化的交易界面。 💡 交易应用场景 趋势判断:当所有时间框架的 EMA 云都处于看涨状态(短期 EMA 在长期之上),且云图颜色一致时,表明整体趋势强劲,适合顺势交易。 支撑与阻力:EMA 云的上下边界通常会成为价格的重要支撑或阻力位,价格回调至云图附近时,常出现反弹或反转。 信号确认:当前周期的前置 EMA 云(5/12、34/50)与更高时间框架的 EMA 云方向一致时,可作为入场信号的有效确认,提高交易胜率。 ✨ 主要优势 多周期共振:同时整合日线、1 小时和当前周期的 EMA 数据,帮助交易者从宏观到微观全面把握市场结构。 直观易懂:通过颜色和云图的变化,将复杂的趋势和动量信息转化为直观的视觉信号,降低分析难度。 灵活适配:高度可定制的颜色和透明度设置,使其能完美融入任何交易风格和图表主题。 无未来函数:所有计算均基于已收盘的历史数据,避免了指标重绘,信号更加可靠。Chỉ báocủa AngAng00710
Ang Multi EMA with labels (Any timeframe)功能 这个脚本是一个多周期指数移动平均线(EMA)指标,专为 TradingView 设计,可在任意图表周期上同时显示多达 8 条不同周期和时间框架的 EMA 线,并在图表右侧自动生成带有价格标签的标注。它的核心功能包括: 支持自定义每条 EMA 的周期、时间框架(如 5 分钟、1 小时、日线等)和颜色。 当未指定时间框架时,直接计算当前图表周期的 EMA,与原生 EMA 指标完全对齐。 当指定跨周期时,调用对应时间框架的 EMA 数据,并保持与原生指标一致的计算逻辑。 自动生成清晰的标签,显示 EMA 的周期、时间框架和当前价格,便于快速识别。 Function: This script is a multi-timeframe Exponential Moving Average (EMA) indicator designed for TradingView. It can display up to 8 EMA lines with different periods and timeframes on any chart, and automatically generate labeled annotations on the right side of the chart showing the current price. Its core features include: Customizable period, timeframe (e.g., 5min, 1H, daily), and color for each EMA line. When no timeframe is specified, it calculates the EMA for the current chart period, perfectly aligning with the native EMA indicator. When a cross-timeframe is specified, it fetches EMA data from the corresponding timeframe while maintaining calculation logic consistent with native indicators. Automatically generates clear labels showing the EMA period, timeframe, and current price for quick identification. 优势 精准对齐:通过统一计算逻辑,确保在当前周期(如 5 分钟)上的 EMA 与 TradingView 原生 EMA 指标完全一致,消除数值偏差。 多周期灵活配置:支持同时监控多达 8 条 EMA,可自由组合不同时间框架(如 5 分钟 EMA20 + 1 小时 EMA50),满足多周期共振分析需求。 直观可视化:自动生成的右侧标签清晰标注每条 EMA 的关键信息,无需频繁切换指标设置或查看数据窗口。 无未来函数风险:默认使用实时数据计算,避免了因使用未来数据导致的指标重绘问题,信号更可靠。 高度可定制:用户可自由调整 EMA 的颜色、线宽、标签距离等参数,打造符合个人交易风格的界面。 Pros Precise Alignment: By unifying the calculation logic, it ensures that the EMA on the current timeframe (e.g., 5min) is perfectly aligned with TradingView's native EMA indicator, eliminating numerical discrepancies. Flexible Multi-Timeframe Configuration: Supports monitoring up to 8 EMAs simultaneously, allowing free combinations of different timeframes (e.g., 5min EMA20 + 1H EMA50) to meet multi-timeframe confluence analysis needs. Intuitive Visualization: Automatically generated labels on the right clearly display key information for each EMA, eliminating the need to frequently switch indicator settings or check data windows. No Repainting Risk: Uses real-time data by default, avoiding repainting issues caused by lookahead data, resulting in more reliable signals. Highly Customizable: Users can freely adjust parameters such as EMA color, line width, and label distance to create an interface tailored to their personal trading style.Chỉ báocủa AngAng0078
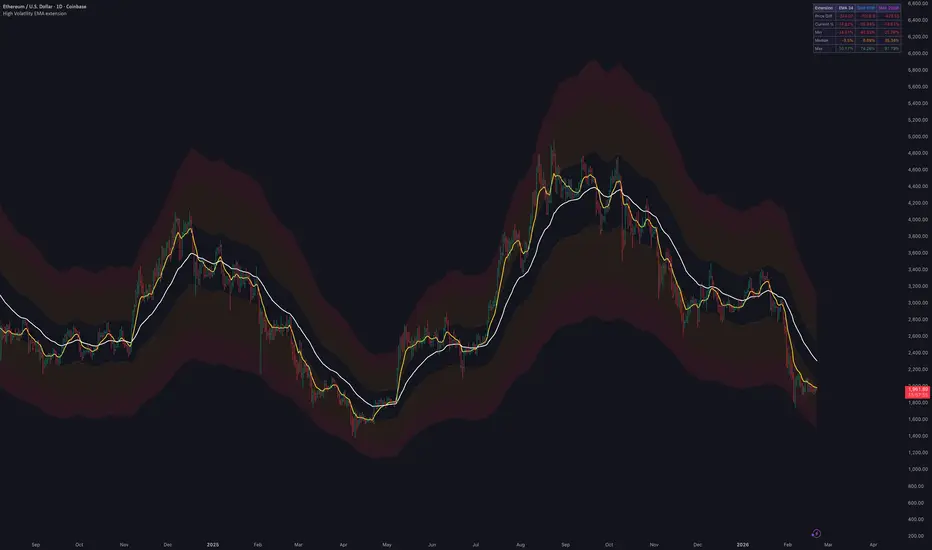
High Volatility EMA Extension Bands An EMA-based trend indicator with extension bands and statistical tracking for higher-volatility assets. What it shows: 8 EMA (yellow) and 34 EMA (white) lines Three extension bands at 10%, 25%, and 35% above and below the 34 EMA Color-coded zones: green (10%), amber (25%), red (35%) Extension statistics table showing current %, price difference, min/max/median values for EMA 34, 50-week SMA, and 200-week SMA Settings: Adjustable EMA lengths (default: 8 and 34) Customizable extension percentages (default: 10%, 25%, 35%) Toggle extension bands on/off Toggle statistics table on/off Chỉ báocủa Sam_mcmahon0
Low Volatility EMA Extension Bands An EMA-based trend indicator with tight extension bands and statistical tracking for lower-volatility assets. What it shows: 8 EMA (yellow) and 34 EMA (white) lines Three extension bands at 10%, 15%, and 20% above and below the 34 EMA Color-coded zones: green (10%), amber (15%), red (20%) Extension statistics table showing current %, price difference, min/max/median values for EMA 34, 50-week SMA, and 200-week SMA Settings: Adjustable EMA lengths (default: 8 and 34) Customizable extension percentages (default: 10%, 15%, 20%) Toggle extension bands on/off Toggle statistics table on/off Chỉ báocủa Sam_mcmahon2
0DTE Scalping Suite# 0DTE Scalping Suite - TradingView Publishing Info ## Title (Max 60 chars) ``` 0DTE Scalping Suite - 9/21 EMA + VWAP + Internals ``` ## Short Description (Max 120 chars) ``` Complete 0DTE SPY/QQQ scalping system: 9/21 EMAs, VWAP bands, Impulse MACD, Market Internals filter & Risk Calculator ``` ## Full Description ``` **The Complete 0DTE Scalping System - Built by an Active Trader** This indicator combines multiple proven strategies into ONE complete scalping suite specifically designed for 0DTE SPY and QQQ options trading. 📊 **What's Included:** • 9/21 EMA crossover system with visual cloud • VWAP with standard deviation bands • Impulse MACD momentum confirmation • Simulated Market Internals filter ($TICK/$ADD/ USI:VOLD concept) • Built-in Risk Calculator (shows exact contract quantity based on your account size) • BUY/SELL arrow signals (only when ALL conditions align) • Background sentiment coloring 🎯 **How It Works:** BUY Signal requires: ✅ 9 EMA crosses above 21 EMA ✅ Price above VWAP ✅ MACD shows bullish impulse ✅ Market internals positive (>0.5%) SELL Signal requires: ✅ 9 EMA crosses below 21 EMA ✅ Price below VWAP ✅ MACD shows bearish impulse ✅ Market internals negative (<-0.5%) 💰 **Risk Management:** The built-in calculator shows: • Dollar amount to risk per trade (based on your account size % risk) • Suggested number of contracts (based on estimated contract price) • Real-time updates as you adjust settings ⚙️ **Fully Customizable:** • Adjust EMA periods (default 9/21) • VWAP standard deviation multiplier • MACD settings for your style • Internals thresholds • Risk % per trade • Show/hide any component 🚀 **Best For:** • 0DTE SPY/QQQ options scalping • 1-5 minute charts • Intraday momentum trading • Traders who want ALL signals in one clean interface ⚠️ **Note:** Market Internals are simulated based on price momentum. For true $TICK/$ADD/ USI:VOLD data, use a broker platform with NYSE breadth indicators. 📈 **Pro Tip:** Use on 2-minute or 5-minute charts for best signal clarity. Wait for ARROW + MACD confirmation before entry. Built with ❤️ by theTRADINGDECK - "Stack the deck in your favor." © 2026 theTRADINGDECKChỉ báocủa imhurtin59