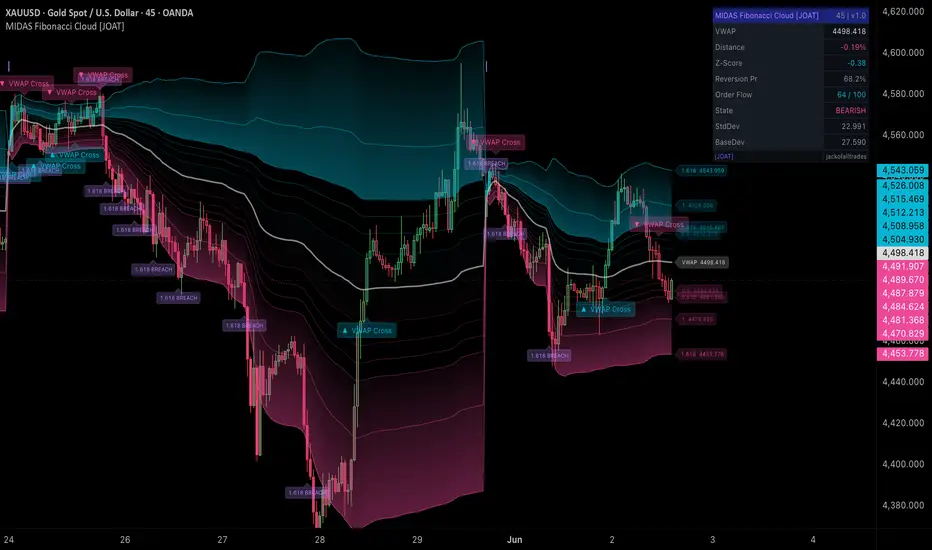
Fibonacci Levels Engine [StrixEDGE]What It Does
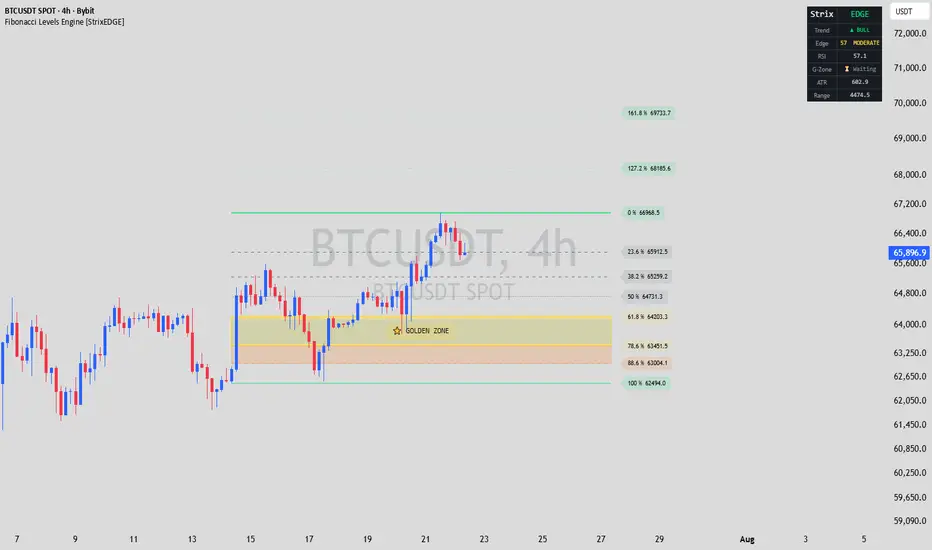
Fibonacci Levels Engine automatically detects the most recent swing high and swing low within a configurable lookback window, draws the standard Fibonacci retracement grid (0 %, 23.6 %, 38.2 %, 50 %, 61.8 %, 78.6 %, 88.6 %, 100 %) plus the 127.2 % and 161.8 % extensions, and projects every level into the future so you can see where price is heading relative to the structure.
What separates this indicator from a plain Fibonacci overlay is the Edge Analysis layer — three original components that work together to tell you how meaningful a given Fibonacci zone is right now, not just where it sits on the chart:
1. Edge Score (0–100) — A composite confluence gauge displayed in the dashboard.
2. Proximity Heatmap — Dynamic line opacity that makes levels glow as price approaches them.
3. ATR Volatility Band — A band around the Golden Zone midpoint that adapts to current volatility.
How It Works
Core: Swing Detection & Fibonacci Grid
The indicator scans the last N bars (default 20, configurable 5–300) to find the highest high and lowest low. It determines trend direction by comparing which extreme occurred first: if the swing low is further back in time than the swing high, the structure is bullish (price moved from low to high); otherwise it is bearish. Fibonacci ratios are then calculated from that range and drawn as horizontal levels from the swing origin to a user-defined projection length (default 30 bars into the future).
Two shaded zones highlight areas of interest:
- Golden Zone (0.618–0.786) — the highest-probability retracement area in classical Fibonacci theory.
- Deep Zone (0.786–0.886) — often the last line of defense before a full retracement.
Both zones, the 50 % midline, and the extension levels can be toggled on or off independently.
Edge Score — Confluence Gauge
The Edge Score combines three independent measurements into a single 0–100 reading:
RSI Momentum Alignment | 0–35 | In a bullish structure, a low RSI (below 35) scores highest because it signals oversold conditions near support. In a bearish structure, a high RSI (above 65) scores highest. Intermediate RSI values receive proportionally lower scores. |
| Proximity to Golden Zone | 0–35 | Measures the absolute distance between the current close and the Golden Zone midpoint as a ratio of the total Fibonacci range. The closer price is to the midpoint, the higher the score. |
| EMA Trend Alignment | 0–30 | Checks the stacking order of the 8, 21, and 55-period EMAs. A fully aligned stack (e.g., EMA 8 > EMA 21 > EMA 55 in a bullish structure) scores 30; partial alignment scores 20; misalignment scores 10. |
The resulting score is classified as STRONG (≥ 75), MODERATE (≥ 50), WEAK (≥ 25), or LOW (< 25) and displayed with a color-coded label in the dashboard. A high Edge Score means RSI, price proximity, and trend direction are all converging at the Fibonacci zone — not just that price touched a line.
Proximity Heatmap
Every Fibonacci level's line opacity is recalculated on each bar based on how far the current close is from that level. When price is near a level, the line becomes more opaque (visually brighter); when price is far away, the line fades. This is computed as a transparency value derived from the ratio of (distance to level) / (total Fibonacci range), scaled between 10 and 75. The effect lets you instantly see which levels are "active" without scanning numbers — the relevant lines stand out on their own.
ATR Volatility Band
A translucent band is drawn around the Golden Zone midpoint, extending ± 0.5 × ATR (default 14-period). This addresses a practical problem: a Fibonacci level is a single price, but real entries need a buffer that accounts for market noise. The band widens in volatile conditions and contracts in quiet ones, giving you a dynamic "fair value area" inside the Golden Zone rather than a fixed line.
Dashboard Panel
A compact table in the top-right corner of the chart displays:
- Trend — Current structural direction (Bull / Bear) with color coding.
- Edge — The composite Edge Score and its label.
- RSI — Current RSI value, color-coded for overbought/oversold extremes.
- G-Zone — Live status showing ✅ with the midpoint price when the close is inside the Golden Zone
or ⏳ Waiting when it is outside.
- ATR — Current Average True Range value.
- Range — The total Fibonacci range (swing high minus swing low).
Dashboard text size is adjustable (Tiny / Small / Normal / Large).
How to Use It
Identify the structure — Add the indicator to your chart. The dashboard immediately tells you whether the current swing structure is bullish or bearish and shows the Edge Score.
Watch the Golden Zone — When price pulls back toward the 0.618–0.786 area, check the dashboard: a high Edge Score (50+) means RSI and trend EMAs are aligned with the retracement, which increases the odds of a bounce. The G-Zone row will switch from ⏳ to ✅ when price enters the zone.
Use the Volatility Band for entries — Rather than placing a limit order on the exact 0.618 or 0.786 line, use the ATR band as your entry zone. It automatically adjusts to current volatility, giving you a wider buffer in choppy markets and a tighter one in clean trends.
Read the heatmap — Glowing lines tell you which levels price is currently interacting with. If a line is bright and the Edge Score is high, that level carries more weight. If the line is faded, price is far away and the level is not in play.
Settings Overview
- Pivot Lookback (5–300, default 20) — Number of bars scanned for swing high/low detection.
- Right Projection (5–200, default 30) — How far levels extend into the future.
- Golden Zone / Deep Zone / 50 % / Extensions — Toggle individual level groups.
- Edge Score Panel — Show or hide the dashboard.
- ATR Volatility Band — Show or hide the dynamic band.
- Proximity Heatmap — Enable or disable the distance-based line opacity effect.
- ATR / RSI Length — Periods for the ATR and RSI calculations used in the Edge Score and Volatility Band.
- Style — Full color customization for bullish/bearish, zones, bands, levels, labels, and line width.
Set alerts — Four built-in alert conditions are included:
- Price enters the Golden Zone (0.618–0.786)
- Price enters the Deep Zone (0.786–0.886)
- Edge Score reaches 75 or above (strong confluence)
- Price crosses the 0 % or 100 % level (breakout / full retracement)
Chỉ báo