Fibonacci Confluence Suite [AxeAlgo]Fibonacci Confluence Suite
OVERVIEW
Fibonacci Confluence Suite is an automatic Fibonacci retracement and extension toolkit. Instead of requiring you to manually draw a Fibonacci tool on every swing, it detects swing highs and lows on its own using fractal price structure, draws the retracement/extension grid between them, and keeps that grid updated in real time as new swings form.
On top of the standard retracement levels, this script adds several layers of context that are normally separate, manually-maintained tools: a Golden Pocket highlight, a confluence check against prior swings, a per-level "touch count" strength score, an optional volatility-adaptive lookback, Fibonacci time zones, and a compact on-chart status table. The goal is to let you see not just where a Fibonacci level sits, but how significant that level appears to be.
This is a technical analysis / charting tool. It does not predict price, does not place trades, and is not a signal generator promising entries or exits.
HOW IT WORKS
1. Swing detection: the script scans for fractal highs and lows (a bar whose high/low is more extreme than the two bars on either side of it) within a user-defined lookback Period.
2. Anchors: the most extreme fractal high and fractal low found inside that window become the 0% and 100% anchors.
3. Direction: the detected swing is treated as an up-move or down-move depending on which side price broke out of most recently; you can flip this with the Reverse input if you prefer levels measured from the opposite end.
4. Grid: every retracement/extension ratio you enable is calculated from those two anchors and drawn as a labeled horizontal line, with the current price and touch count shown directly on the label.
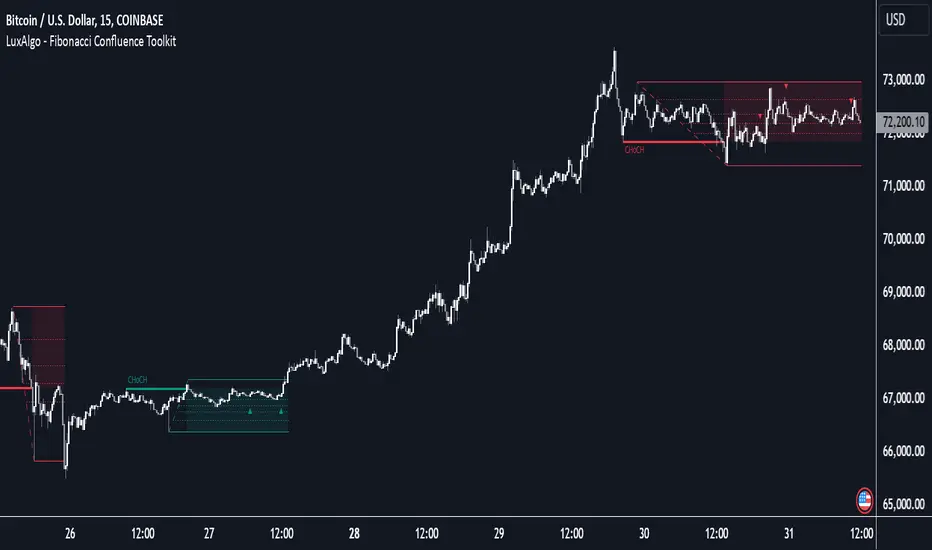
5. Confluence: each time the swing flips, the prior swing's high/low is stored. Newly drawn levels are checked against the Fibonacci levels of those earlier swings, and any level that lines up within your tolerance is marked and drawn wider so overlapping structure stands out.
KEY FEATURES
- Automatic fractal-based swing detection, no manual drawing required.
- Base lines (0.000 / 1.000) plus up to nine independently configurable extension ratios, each with its own show/hide toggle and value.
- Adjustable line style, width, color, and extension direction (none / left / right / both) for base and extension lines separately.
- Golden Pocket highlight (0.618-0.65) with adjustable fill color, useful as a classic confluence/reaction zone.
- Multi-swing confluence detection: compares the current Fibonacci grid against up to five prior swings and flags levels that overlap, with an adjustable tolerance (as a percentage of the swing range) and a visual marker on confluent levels.
- Level strength via touch counts: each level tracks how many times price has traded through it since that specific swing grid was drawn, shown directly in the line label.
- Optional volatility-adaptive sensitivity: scales the effective lookback window using current ATR relative to its own baseline, so the swing detection can loosen or tighten automatically across changing volatility regimes instead of relying on one fixed Period. Disabled by default; when disabled the script behaves exactly like a fixed-Period fractal Fibonacci tool.
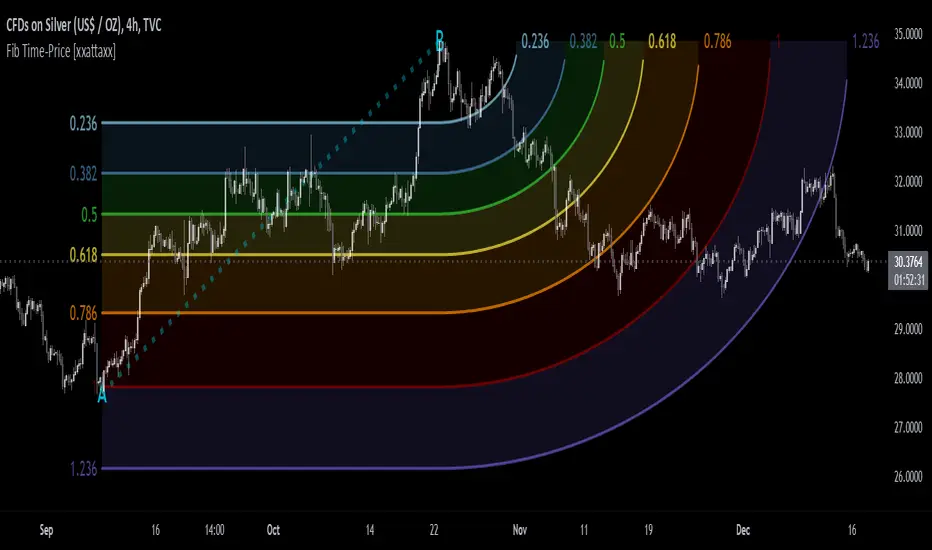
- Fibonacci time zones: optional vertical lines placed at Fibonacci bar-count offsets from the start of the current swing, for traders who also watch time-based confluence.
- Status table showing current trend direction, swing high/low, nearest level to price, the strongest (most-touched) level, and the lookback period actually in use.
- Built-in alerts: a per-level alert whenever price trades through any visible base or extension line, a dedicated Golden Pocket alert, and grouped "any base line" / "any extension line" alert conditions for the classic Alert dialog.
HOW TO USE IT
- Period / Delay: Period sets how many bars back the script searches for the swing high/low. Delay sets how many bars of confirmation a fractal needs before it can be used; it must be smaller than Period. Larger Delay values produce more reliable fractals at the cost of a slower reaction to new swings.
- Line Extension: controls whether the drawn levels extend left, right, both directions, or not at all.
- Reverse: flips which anchor (swing high or swing low) is treated as the 0% origin, letting you view the same swing from the opposite bias.
- Base Lines / Extension Lines groups: toggle, color, style, and set the ratio of each level independently.
- Golden Pocket: toggle and recolor the 0.618-0.65 zone highlight.
- Level Strength: toggle whether touch counts are appended to each label.
- Multi-Swing Confluence: toggle, choose how many prior swings to compare against, set the matching tolerance, and set how much extra line width and which marker confluent levels get.
- Adaptive Sensitivity: enable to let ATR-based volatility scale the effective lookback automatically; adjust the ATR length and baseline length used for that comparison.
- Time Zones: enable vertical Fibonacci time markers, choose how many zones to draw, and toggle multi-color cycling versus a single accent color.
- Status Table: toggle visibility and choose its screen position.
Set alerts using "Any alert() function call" on this indicator to receive all per-level, Golden Pocket, and roll-up alerts, or use the named alert conditions in the Alert dialog if you only want a subset.
IMPORTANT NOTES AND LIMITATIONS
- Repainting: this script can repaint on the most recent, unconfirmed swing. Because a fractal only confirms after the Delay setting's worth of bars closes, the swing high/low anchors — and therefore every level drawn from them — can still shift on the last few bars until the current fractal fully confirms. Once a swing has confirmed and the trend has flipped, that swing's levels are fixed and will not repaint further. Increasing Delay reduces how often this happens, at the cost of reacting more slowly to fresh swings. Please account for this when reading the most recent levels on the chart, and avoid relying on unconfirmed levels for time-sensitive decisions.
- This tool identifies swing structure and Fibonacci confluence; it does not forecast direction, does not manage risk, and does not constitute a complete trading system on its own. It is intended to be used as one input alongside your own analysis, risk management, and market context.
- Touch counts and the confluence marker describe historical interaction with a level on this chart; they are not a probability estimate and do not guarantee how price will react at that level going forward.
- As with any lookback-based tool, results and appearance will vary by symbol, timeframe, and the Period/Delay settings chosen. Please test on your own instruments and timeframes before relying on it.
DISCLAIMER
This script is provided for educational and informational purposes only and does not constitute financial advice. Trading involves substantial risk of loss and is not suitable for every investor. Past behavior of any indicator, including this one, is not indicative of future results. Always do your own research and consider your own risk tolerance before making any trading decisions.
Chỉ báo