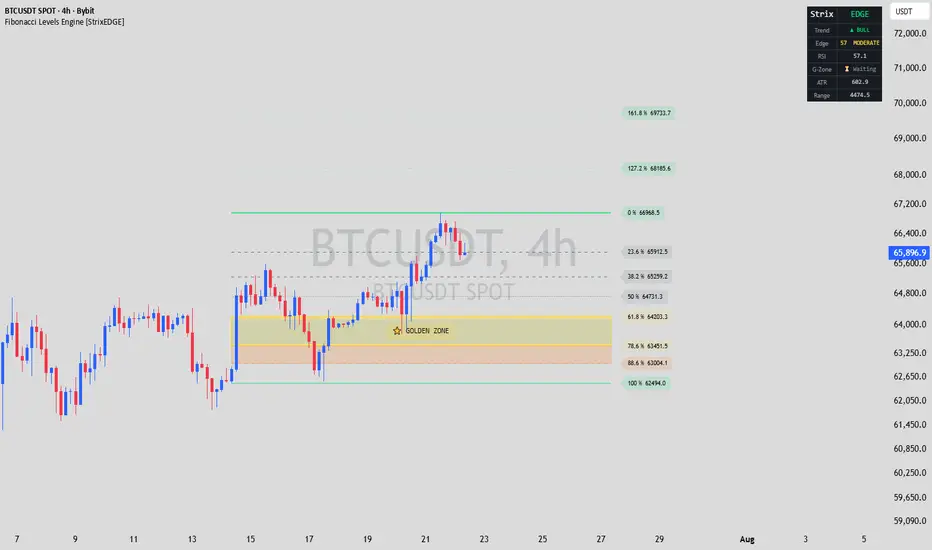
BB Fill + Visible-Range Fib Retracement# BB Fill + Visible-Range Fib Retracement
A 2-in-1 Pine Script indicator that bundles a **Bollinger Bands volatility fill** and a **visible-range Fibonacci retracement** into a single script. If your TradingView plan limits the number of indicators you can have on a chart at once, this lets you get both tools for the price of one indicator slot.
## Bollinger Bands (grey fill)
Standard Bollinger Bands math is used under the hood:
- **Basis** = Simple Moving Average (SMA) of the source over the chosen length.
- **Upper band** = Basis + (StdDev of source over the length × multiplier).
- **Lower band** = Basis − (StdDev of source over the length × multiplier).
Unlike a typical BB indicator, the basis, upper, and lower lines are **not drawn**. Only the shaded area between the upper and lower bands is visible, giving a quick, uncluttered read on volatility/price range without adding extra lines to your chart.
**Inputs:**
- **BB Length** (default `20`) — number of bars used for the moving average and standard deviation.
- **BB Source** (default `close`) — price series the calculation is based on.
- **BB StdDev Multiplier** (default `2.0`) — how many standard deviations the bands extend from the basis.
- **BB Fill Color** (default grey) — color of the shaded band.
- **BB Fill Transparency %** (default `85`) — how transparent the shading is (higher = more transparent/subtle).
## Visible-Range Fibonacci Retracement
This tool automatically scans the bars **currently visible on your screen** to find the highest high and the lowest low, then draws the standard Fibonacci retracement levels between them:
`0, 0.236, 0.382, 0.5, 0.618, 0.786, 1`
The retracement direction is auto-detected: if the low occurred before the high in the visible range, it's treated as an uptrend (levels retrace down from the high); otherwise it's treated as a downtrend (levels retrace up from the low). Each level is drawn as a horizontal line spanning the visible range, with an optional price label at the right edge showing the level ratio and its price.
**Inputs:**
- **Show Fib Retracement** — toggles the fib lines on/off.
- **Show Fib Price Labels** — toggles the price labels next to each fib line on/off.
**Important behavior to understand:** the lines update to reflect the highest high/lowest low of whatever range you're viewing when you scroll or zoom the chart, but Pine Script only allows a script to redraw on the arrival of new bar/tick data or when the chart is reloaded — not on every scroll/zoom gesture by itself. In practice this means the levels catch up shortly after you stop interacting with the chart (or on the next price update), rather than tracking your viewport in real time. Because of this, the tool is a **discretionary visual aid** meant for manual chart reading, not a deterministic signal — it should not be used as input to automated strategies or backtests, since its output depends on your current viewport rather than a fixed, reproducible calculation.
## How to use
- Use the grey BB fill as quick visual context for current volatility — a wide band suggests an expansive/volatile market, a narrow band suggests consolidation.
- Use the fib levels as an on-the-fly support/resistance reference for whatever swing high/low is currently in view — zoom or scroll to the price range you care about, let the chart refresh, and read the levels as potential reaction zones.
- Combine both: watch for price reacting near a fib level while inside or near the BB shaded zone for added confluence.
## Settings summary
| Input | Default | Description |
|---|---|---|
| BB Length | 20 | Number of bars for the SMA basis and standard deviation. |
| BB Source | close | Price series used for the Bollinger Bands calculation. |
| BB StdDev Multiplier | 2.0 | Multiplier applied to standard deviation to set band width. |
| BB Fill Color | grey | Color of the shaded area between the bands. |
| BB Fill Transparency (%) | 85 | Transparency of the BB shading. |
| Show Fib Retracement | true | Toggles drawing of the fib retracement lines. |
| Show Fib Price Labels | true | Toggles price labels next to each fib line. |
## Limitations
- The fib retracement only redraws when new bar/tick data arrives or the chart reloads — it does not update live as you scroll or zoom, due to a Pine Script platform limitation.
- Not intended for automated strategy logic or backtesting: the visible-range calculation is viewport-dependent and not deterministic across runs.
- The script keeps an internal history array of bar times/highs/lows that grows as the chart's loaded history grows, which can add a small amount of memory/processing overhead on very long chart histories.
---
Last updated (UTC): 2026-09-13 08:41:01 UTC
Chỉ báo