Chỉ báo
Phân dạng Fractal

Trade Grader [Time & Price ICT)Trade Grader
A Protocol-Based Trade Scoring System for Disciplined ICT Traders
What Is This Indicator?
Trade Grader is a real-time trade scoring and checklist system built specifically for traders following the ICT methodology, as taught by Frank369 (The Matrix Unlocked). It sits directly on your TradingView chart and grades every potential trade setup from D (worst) to A++ (perfect) — so you never have to second-guess whether a trade is worth taking.
The indicator is divided into two sections that must be completed in order:
• 📊 High Timeframe (HTF) Checklist — 1H: Confirms the big picture is aligned before you even think about entering.
• 📈 Low Timeframe (LTF) Checklist — 5m/1m: Confirms precise entry conditions once the HTF is fully validated.
How It Works
Step 1 — Complete the HTF Checklist First
The LTF checklist is locked until all 3 HTF conditions are met:
1. ✅ Orderflow Identified (1H) — Is the 1H trend clearly bullish or bearish?
2. ✅ POI / POIs Identified (1H / 15m) — Have you marked your Points of Interest?
3. ✅ DOL Identified — Do you know your Draw on Liquidity?
If any HTF item is missing → automatic Grade D → NO TRADE. No exceptions.
Step 2 — Complete the LTF Checklist
Once the HTF is 100% confirmed, the LTF section unlocks:
1. ✅ Price now at POI — Is price actually at your identified level?
2. ✅ SMT Identified (min. 10m SMT) — Is there Smart Money Tool divergence present?
3. ✅ CISD on NQ & ES — Change In State of Delivery confirmed on both instruments?
4. ✅ CISD on NQ, ES & YM (OVERRIDE) — All 3 instruments confirmed? This overrides item 3 and upgrades your grade.
Step 3 — Read Your Grade
The indicator scores your setup and displays the result instantly:
Why This Indicator Will Change How You Trade
🛡️ It Protects You From Yourself
The number one reason traders lose money is not a lack of knowledge — it’s a lack of discipline. You know the rules. But in the heat of the moment, emotions take over. Fear of missing out, impatience, boredom — these push you into trades that don’t meet your criteria. Trade Grader acts as your personal rule enforcer, right on your chart. If the grade isn’t A, A+, or A++, the indicator tells you loudly and clearly: NO TRADE.
🎯 It Eliminates Overtrading
Overtrading is one of the most common ways retail traders blow accounts. Every time you take a low-quality trade, you’re not just risking your capital — you’re risking your confidence and your consistency. Trade Grader forces you to slow down and only act when your full protocol is confirmed. No more “close enough” setups. No more “I think this might work.” Only structured, graded, high-probability setups.
📋 It Builds Trading Discipline Like a Checklist Pilot
Commercial pilots don’t take off without completing their pre-flight checklist — no matter how experienced they are. Trade Grader brings that same level of procedural discipline to your trading. Every item must be checked. Every box must be ticked. Only then does the system give you the green light to trade.
🧠 It Removes Emotional Decision-Making
When you’re staring at a chart and price is moving fast, your brain wants to act. Trade Grader slows you down and forces you to think systematically instead of emotionally. By the time you’ve gone through the checklist, you either have a valid setup — or you don’t. There’s no grey area.
📈 It Trains You to See Only High-Quality Setups
Over time, using this checklist consistently will rewire how you see the market. You’ll naturally start pre-screening setups in your head before even opening the indicator. Your eye for confluences, timing, and structure will sharpen — because you’ve been forced to look for them on every single trade.
Key Features
• 🔒 HTF Lock System — LTF checklist is greyed out and locked until all HTF items are confirmed
• 🎓 Live Grade Display — Updates in real time as you toggle items on/off in settings
• 🟢 TRADE! / 🔴 NO TRADE — Clear, bold verdict so there’s no confusion
• 🩶 Clean Silver/Grey Design — Minimal and professional, won’t distract from your chart
• 📍 Repositionable — Place the table in any corner of your chart
• 👁️ Toggle Checklist Visibility — Show or hide the full checklist, keeping only the grade and verdict if preferred
Who Is This For?
This indicator is built for traders who:
• Follow the ICT / Zeussy / Frank369 methodology
• Trade NQ, ES, YM (Nasdaq, S&P 500, Dow Jones futures)
• Struggle with overtrading or taking setups that don’t fully meet their criteria
• Want a systematic, rule-based approach to trade execution
• Are committed to improving their trading psychology and discipline
Final Note
Knowing when NOT to trade is just as important as knowing when to trade.
Most traders focus all their energy on finding entries. But the best traders know that patience and selectivity are what separate consistent profitability from blown accounts. Trade Grader is your accountability partner — sitting on your chart every session, reminding you of your rules, and making sure you only pull the trigger when everything lines up.
Grade A and above only. Everything else is noise.
Chỉ báo

MSNR CISD SMT DivergenceCOMPLETE EXECUTION CHECKLIST
Check 15M+ MSNR — What's the HTF bias? (HH/HL = longs, LL/LH = shorts)
Mark PDH/PDL/11:00 Open — Where is price relative to key levels?
Wait for Session Liquidity Sweep — Asian/London/US high or low taken?
Confirm SMT Divergence — Is correlated asset confirming or diverging?
Check CISD Level — Is there a delivery level at the sweep zone?
Enter at FVG — Is there a gap for precise entry?
Target opposite liquidity — BSL ↔ SSL, PDH ↔ PDL
Chỉ báo

Smart Money Trend Engine
WHAT IT DOES
Smart Money Trend Engine (SMTE) is a fully original all-in-one indicator
built in Pine Script v6 that combines institutional Smart Money Concepts
with a dynamic trend coloring system. Instead of using separate indicators
for trend direction and market structure, SMTE displays everything on a
single clean overlay: bar colors change based on confirmed structural
breaks, the background reflects the active trend phase, and Smart Money
elements (BOS, CHoCH, Order Blocks, FVG, Liquidity Sweeps) are layered
on top in a way that is readable and not cluttered.
The result is a chart that tells a complete institutional story at a
glance where the trend is, where it changed, where institutions were
active, and where the next likely reaction zones are.
━━━━━━━━━━━━━━━━━━━━━━━━━━━━━━━━━━━━━━━━
WHAT MAKES IT ORIGINAL
Most trend-coloring indicators use moving average crossovers to determine
bar color. SMTE uses a fundamentally different approach: bar color is
driven by confirmed Smart Money structure breaks (BOS), not by price
position relative to a moving average. This means the color change is
tied to institutional order flow logic, not to a lagging indicator.
Three original components separate SMTE from existing public scripts:
1. Structure-driven bar coloring
Bars turn green when a bullish Break of Structure (BOS) is confirmed.
Bars turn red when a bearish BOS is confirmed. The color persists
until the next structural event, making the trend state visually
stable and easy to read even across long periods. Unlike EMA-based
coloring, the color does not flicker on every candle.
2. Intelligent CHoCH detection
A Change of Character (CHoCH) is only marked when the market
genuinely reverses after a confirmed trend — not on every first BOS
after a pullback. The indicator tracks consecutive BOS counts in each
direction and only triggers CHoCH after a real directional shift.
The CHoCH candle is colored orange to stand out from the green/red
trend bars, giving traders an immediate visual warning of a potential
trend change without constant false signals.
3. BOS streak counter
The dashboard tracks how many consecutive bullish or bearish BOS
events have occurred. Two or more BOS in the same direction confirms
a genuine trend. One BOS alone is treated as a potential structure
break but not yet confirmed. This filter significantly reduces the
number of false trend signals.
━━━━━━━━━━━━━━━━━━━━━━━━━━━━━━━━━━━━━━━━
THE FOUR VISUAL LAYERS
Layer 1 Bar and Background Color
Green bars and green background: confirmed bullish BOS. Institutions
are breaking upward structure. Price is in a bullish trend phase.
Red bars and red background: confirmed bearish BOS. Institutional
selling pressure is dominant and structure is breaking downward.
Orange bars (single candle only): CHoCH detected. This is the exact
candle where the market changed character. High alert moment.
Layer 2 Smart Money Structure
BOS lines (blue dashed for bullish, red dashed for bearish) connect
the structural pivot to the current bar, showing exactly where the
break occurred. CHoCH labels appear in orange and only when the trend
genuinely reverses. Labels are kept small and positioned away from
price to avoid visual clutter.
Layer 3 — Order Blocks and FVG
Bullish Order Blocks (green boxes) mark demand zones where institutions
previously accumulated long positions. Bearish Order Blocks (red boxes)
mark supply zones. Box height is ATR-based for precision. Fair Value
Gaps (FVG) are shown as thin shaded areas between candles where price
left an imbalance — these often act as magnet zones for future price
retracement.
Layer 4 — Liquidity Sweeps
Blue water drop labels appear when price wicks below a recent low and
closes back above (bullish sweep). Red drops appear when price wicks
above a recent high and closes back below (bearish sweep). These mark
moments where stop-losses were hunted before a potential reversal.
━━━━━━━━━━━━━━━━━━━━━━━━━━━━━━━━━━━━━━━━
HOW TO USE
Step 1 — Read the bar color
Green bars mean the last confirmed structural event was a bullish BOS.
Red bars mean the last confirmed structural event was a bearish BOS.
Stay with the color. Trade in the direction of the dominant color and
avoid counter-trend positions unless a CHoCH appears.
Step 2 Watch for CHoCH
A single orange candle means CHoCH. This is the earliest warning that
the trend may be changing. Do not immediately reverse — wait for
confirmation from the next BOS in the new direction. CHoCH alone is
a warning, not a signal.
Step 3 — Count BOS streaks
Check the Dashboard for Bull BOS and Bear BOS counters. Two or more
BOS in a row in the same direction confirms a genuine trend. One BOS
is fragile and easily reversed. Trade with higher conviction when the
streak counter shows 2 or more.
Step 4 — Use Order Blocks for entries
When price returns to a green Order Block in a bullish trend (green
bars), that is a high-probability demand zone. When price returns to
a red Order Block in a bearish trend (red bars), that is a supply zone.
Use these for precise entry planning rather than chasing breakouts.
Step 5 — Combine with FVG and Sweeps
A liquidity sweep followed by a CHoCH followed by a new BOS in the
opposite direction is the highest quality reversal setup this indicator
can show. All three elements aligning is rare and significant.
FVG zones often act as the first target after a sweep and CHoCH.
Step 6 — Read the Dashboard
SMC Bias shows the current structural direction. Last Event shows the
most recent structural event. Bull BOS and Bear BOS counters show
streak strength. Liq Sweep and FVG show real-time status of the
current bar.
━━━━━━━━━━━━━━━━━━━━━━━━━━━━━━━━━━━━━━━━
CALCULATION LOGIC
BOS detection:
Pivot high confirmed = ta.pivothigh(high, ms_len, ms_len)
Pivot low confirmed = ta.pivotlow(low, ms_len, ms_len)
Bull BOS = new pivot high > previous pivot high
Bear BOS = new pivot low < previous pivot low
CHoCH logic:
bull_choch = bull_bos AND previous trend was bearish AND bear_count >= 1
bear_choch = bear_bos AND previous trend was bullish AND bull_count >= 1
(Requires at least one confirmed BOS in the opposite direction first)
BOS streak counter:
bull_count increments on each bull_bos, resets to 0 on bear_bos
bear_count increments on each bear_bos, resets to 0 on bull_bos
Bar coloring:
Green = last bull_bos (not CHoCH)
Red = last bear_bos (not CHoCH)
Orange = CHoCH candle only (single bar)
Order Block height:
zone_center = (high + low) / 2 at pivot bar
zone_top = zone_center + ATR(14) x 0.25
zone_bot = zone_center - ATR(14) x 0.25
Fair Value Gap:
bull_fvg = low - high > 0 AND gap_size / close >= min_pct
bear_fvg = low - high > 0 AND gap_size / close >= min_pct
Liquidity Sweep:
bull_sweep = low < lowest(low, N) AND close > that level AND close < that level
bear_sweep = high > highest(high, N) AND close < that level AND close > that level
━━━━━━━━━━━━━━━━━━━━━━━━━━━━━━━━━━━━━━━━
SETTINGS OVERVIEW
Trend Colors:
Fast EMA, Slow EMA, Trend EMA — reference lines on chart
Show EMA lines — toggle EMA display
Show background — toggle trend background coloring
Background opacity — how transparent the background is (80-97)
Smart Money:
Pivot length — bars used for structural pivot detection (default 20)
Show BOS / CHoCH — toggle structure labels and lines
Show Order Blocks — toggle demand/supply zones
OB lookback — pivot length for Order Block detection
Show Fair Value Gaps — toggle FVG boxes
Min FVG size (%) — minimum gap size to display
Show Liq Sweeps — toggle liquidity sweep markers
Sweep lookback — bars used to identify significant highs and lows
Dashboard:
Show Dashboard — toggle info panel
━━━━━━━━━━━━━━━━━━━━━━━━━━━━━━━━━━━━━━━━
ALERTS INCLUDED
Bullish CHoCH detected
Bearish CHoCH detected
Bullish Liquidity Sweep
Bearish Liquidity Sweep
Strong Buy: CHoCH plus Sweep aligned bullish
Strong Sell: CHoCH plus Sweep aligned bearish
━━━━━━━━━━━━━━━━━━━━━━━━━━━━━━━━━━━━━━━━
COMPATIBILITY
Works on all assets — Crypto, Forex, Stocks, Futures, Indices.
Works on all timeframes.
Best results on 1H, 4H, and Daily for swing trading.
For scalping use 5m to 15m with reduced pivot length (8 to 12).
No repainting. All signals calculated on confirmed bar close.
No request.security() calls. No lookahead bias.
━━━━━━━━━━━━━━━━━━━━━━━━━━━━━━━━━━━━━━━━
DISCLAIMER
This indicator is provided for educational and informational purposes
only. It does not constitute financial advice or a recommendation to
buy or sell any asset. Smart Money Concepts are a trading methodology
and not a guarantee of market direction. Past structural patterns do
not guarantee future price behavior. Always apply your own analysis,
use proper risk management, and never risk more capital than you can
afford to lose. The author is not responsible for any trading losses
incurred from use of this indicator.
━━━━━━━━━━━━━━━━━━━━━━━━━━━━━━━━━━━━━━━━
Chỉ báo

Imbalance Finder DynamicImbalance Finder Dynamic - This will show you when price filled a FVG and by how much by highlighting the FVG.
Chỉ báo

Liquidity Heatmap - Fran PinedaLiquidity Heatmap — Fran Pineda is a multi-timeframe liquidity visualization indicator designed to help traders identify potential buy-side and sell-side liquidity areas on the chart.
The indicator scans several intraday and higher timeframes to detect confirmed pivot highs and pivot lows. These pivots are then displayed as visual liquidity marks:
Green marks highlight potential sell-side liquidity areas, usually found around previous swing lows where long-position stops may be resting.
Red marks highlight potential buy-side liquidity areas, usually found around previous swing highs where short-position stops may be resting.
The purpose of this tool is not to predict price direction, but to provide a cleaner visual map of where liquidity may be located before price reacts, sweeps, or expands.
Main features:
- Multi-timeframe liquidity mapping.
- Intraday and higher timeframe pivot detection.
- Visual red and green liquidity marks.
- Optional filtering of lower timeframe levels.
- Adjustable pivot sensitivity.
- Alerts for green liquidity marks.
- Alerts for red liquidity marks.
- Combined alert for any liquidity mark.
- Clean overlay directly on the price chart.
Because the indicator is based on confirmed pivots, marks appear only after the required confirmation bars. This helps reduce noise, but it also means the marks are not generated instantly on the current candle.
This is not a buy or sell signal system. It is a market context tool for traders who work with liquidity, swing points, stop zones, and multi-timeframe structure.
Use it as a liquidity map, not as a crystal ball. The market still has the final word.
Chỉ báo

CNPS2-Bollinger BandThis is a trend following trading system based on breakout signals of Bollinger Bands, served to VN30F1M
Chiến lược

Bridge Wealth & CO. - MTF Probability Setupindicator that uses multiple strategies combined together in one indicator
Chỉ báo

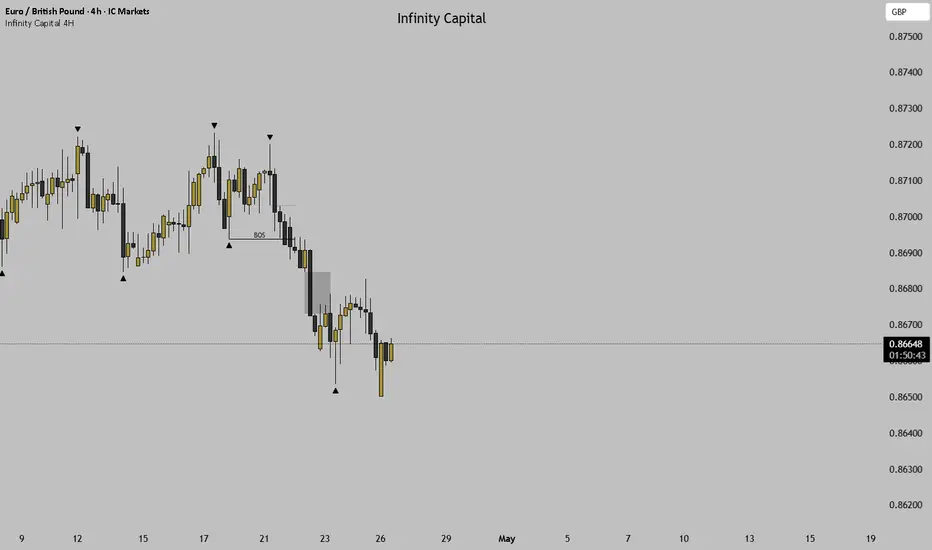
Infinity Capital 4HTEST !!
Infinity Capital 4H indicator
Features:
- Market structure (Highs & Lows)
- Break of Structure (BOS)
- Change of Character (CHoCH)
- Fair Value Gaps (FVG)
- Liquidity Sweeps (wick-based)
- Supply & Demand zones (customizable)
Fully customizable settings for clean price action analysis.
Chỉ báo
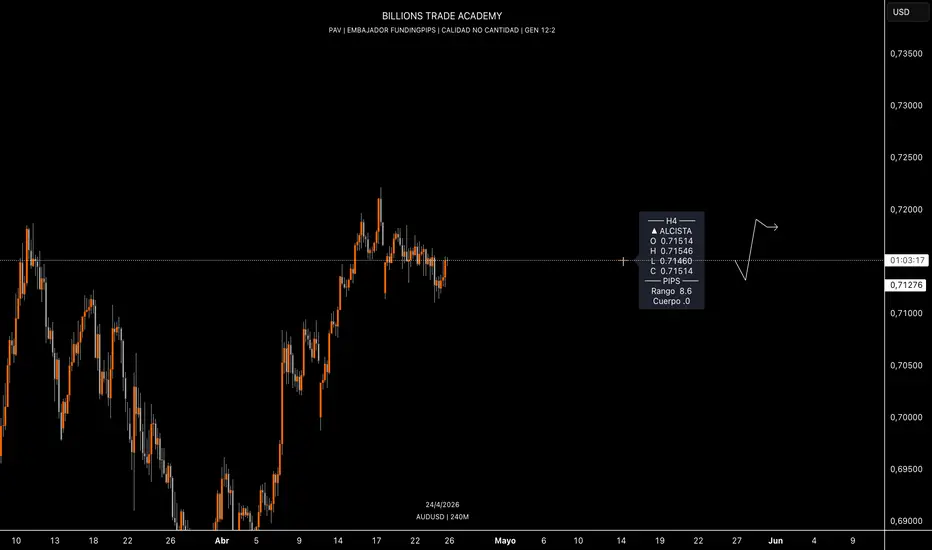
BT Vela RXEl indicador sirve para marcar e identificar la anatomía de la vela, es decir: Podemos observar su formación de la vela anterior, también podemos observar la impresión de velas de otras temporalidades desde el gráfico que estoy observando. En otras palabras, puede ver la formación actual de una vela de mayor temporalidad para así detectar, posibles manipulaciones o rupturas en tiempo real. El indicador cuenta adicionalmente con un contador de velas para poder enumerar el estado de su formación.
Chỉ báo
August sweepDetecta Sweeps en diferents temporalitats
Eliminat el "nivell protector" visual (ja no es dibuixen aquestes línies discontínues)
↕️ Invertides les fletxes: sweep de màxim → Sweep ↓ (perquè el moviment esperat és cap avall), sweep de mínim → Sweep ↑. També invertides al panell scanner.
✅ Afegida casella "Només últim Sweep" i "Només últim CHoCH" (per defecte activades)
🔧 Afluixat el CHoCH: ara la invalidació mira close en comptes de high/low, perquè abans una sola metxa el cancel·lava i per això no en veies
Chỉ báo

Chỉ báo

Chỉ báo

Luke's liquidity sweep mechanical modelthis is a mechanical entry model that uses liquidity sweeps, MSS and the fib retracement level.
Essentially all we want to see is a liquidity sweep, price break a fractal high or low, break structure,come back to the 0.618 level and enter for a fixed 1:3
Chỉ báo

Hydra EMA Fusion V1🧠 Hydra EMA Fusion V1
Hydra EMA Fusion V1 est un indicateur multi-timeframe conçu pour simplifier la lecture du marché en fusionnant plusieurs EMA en une seule ligne par timeframe.
🔷 Concept
Au lieu d’utiliser plusieurs EMA séparées, cet indicateur combine :
EMA rapides
EMA intermédiaires
EMA lentes
➡️ Le tout pondéré pour créer une ligne synthétique unique.
⚙️ Fonctionnement
🔹 4 timeframes affichées simultanément :
🔵 TF1 (1 min) → Micro structure
🟢 TF2 (15 min) → Intraday
🟠 TF3 (1H) → Structure
🔴 TF4 (4H) → Macro
Chaque ligne représente une fusion pondérée de 3 EMA.
📏 Compression & Distance
L’indicateur mesure l’écart (%) entre les lignes Hydra :
TF1 ↔ TF2
TF2 ↔ TF3
TF3 ↔ TF4
➡️ Permet d’identifier :
📉 Compression (marché en attente)
📈 Expansion (marché en mouvement)
⏱️ Timer de compression
Quand deux lignes deviennent très proches :
➡️ Un timer démarre automatiquement
👉 Plus le temps augmente, plus la probabilité d’un mouvement fort augmente.
📊 Tableau intégré
Un panneau affiche en temps réel :
Distance entre les TF
Temps de compression
➡️ Lecture rapide du contexte marché.
🎯 Utilisation
✅ Détection des phases d’accumulation
✅ Identification des breakouts potentiels
✅ Confirmation de tendance multi-timeframe
🔥 Idéal avec :
Order Blocks
Fibonacci
RSI multi-timeframe
🧠 Résumé
Hydra EMA Fusion transforme plusieurs EMA complexes en une lecture simple :
➡️ 4 lignes = état complet du marché
➡️ Compression = opportunité
➡️ Expansion = mouvement
Indicateur conçu pour les traders cherchant précision, clarté et timing.
Affichage de fibo lZ.txt en cours...
Chỉ báo

Hybrid Round Numbers [LuxAlgo]Smart Round Number Indicator (MES & MNQ)
This indicator highlights key psychological price levels and helps traders focus on where price is most likely to react—without cluttering the chart.
🔑 Core Features
Automatic Detection
Detects MES and MNQ automatically
Applies optimized spacing:
MES → 100 / 50 / 25
MNQ → 1000 / 500 / 100
🎯 Two Display Modes
1. Full Mode
Displays all Major, Medium, and Minor levels
Ideal for big-picture analysis and mapping liquidity zones
2. Proximity Mode (Scalping Focus)
Shows only the nearest levels above and below price
Reduces clutter for precision trading
🟦 Reaction Zones
Each level includes a shaded zone (customizable in ticks)
Represents areas where price is likely to:
react
reverse
consolidate
🚨 Two-Tier Alerts
Zone Touch: Price enters the reaction zone
Level Sweep: Price crosses the exact round number
🎨 Full Customization
Adjust:
spacing (auto or manual)
colors
line styles (solid, dashed, dotted)
line thickness
number of levels shown
Customize Major, Medium, and Minor levels independently
🧠 Smart Logic
Prevents overlapping levels
Automatically prioritizes Major levels over Medium
Keeps charts clean and readable
📍 Improved Visibility
Right-aligned labels and extended lines
Clean layout optimized for real-time decision-making
⚡ Best Use Case
Ideal for scalpers and intraday traders
Helps identify:
liquidity sweeps
reaction zones
high-probability entry and exit levels
Chỉ báo

Chỉ báo

xxxx!!!!!RPS Bot Alertsxxxxx!!!!RPS BOT ALTER for cyprto - Bitcoin, Solana, Etherium etc.
70-80% accuracy.
Trading time frame is 1 HR
Chỉ báo

Session Open Lines PRO (Final Clean)This indicator can show you session open times on chart drawing a dotted line.
Chỉ báo

Pullback Marker (Inside Bars Ignored) by Shadow Quant TraderPullback Marker (Inside Bars Ignored)
This indicator is designed to identify pullback highs and pullback lows while completely ignoring inside bars.
How it works:
Every inside bar is skipped from the counting logic.
If multiple candles remain inside the range of the mother candle, all of them are ignored until a real breakout candle appears.
The indicator then evaluates only the real candles, not the inside bars.
Pullback high logic:
A pullback high is marked when the middle real candle forms the highest high compared to the candles before and after it.
If the next candle has the same high, the indicator waits.
If a later real candle then forms a lower high, the first candle of that equal-high sequence is marked as the pullback high.
Pullback low logic:
A pullback low is marked when the middle real candle forms the lowest low compared to the candles before and after it.
If the next candle has the same low, the indicator waits.
If a later real candle then forms a higher low, the first candle of that equal-low sequence is marked as the pullback low.
Features:
Ignores all inside bars in a mother-candle chain
Marks only valid pullback highs and lows
Handles equal-high and equal-low cases correctly
Uses arrows placed close to candles for clear chart reading
Chỉ báo

Chỉ báo

Chỉ báo

Market Structure SwingsThis indicator marks price swings in three levels: regular, intermediate, and major. It helps show which highs and lows are minor turns and which are more important structure points.
Chỉ báo
