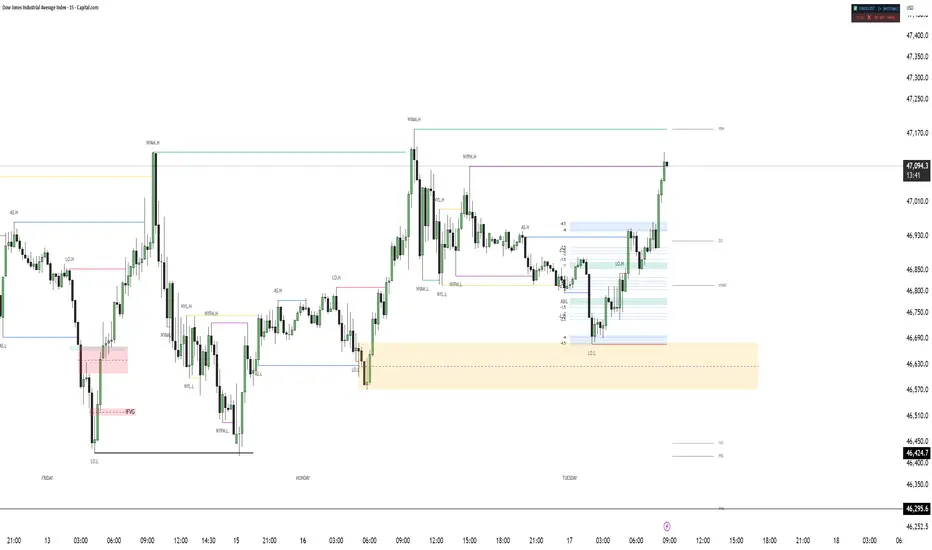
NO BULLSHIT ICT MACROs OVERLAYThis indicator simply gives you a clean visualisation of every ICT macro on every top of the hour.Chỉ báocủa ChonkyTradez5
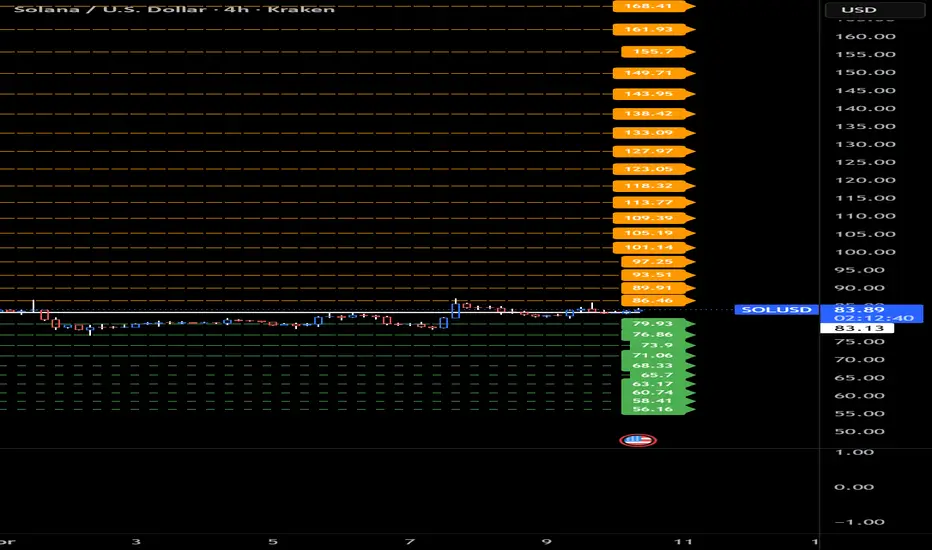
4% Grid Bot - Locked Right LabelsThis Grid allows you to set your own Percentages and can start and stop at what ever levels you want.Chỉ báocủa Stocktitian13
Turtle Soup_Long Sys1 & Sys2 Gold stepped line — System 1: the rolling 20-day high. Price closing above it is an S1 long breakout, labeled S1 ▲ Teal stepped line — System 2: the rolling 55-day high. Breakout labeled S2 ▲▲ and takes priority over S1 if both fire simultaneously Gold fill zone — the band between S1 and S2 highs — shows you where you’re in “no man’s land” between the two systems Coral stepped line — 10-day low channel, the original S1 exit rule Orange stepped line — 20-day low channel, the original S2 exit rule Orange fill — shaded zone between the two exit channels so you can visually see the exit buffer below price Purple stepped line — the ATR trailing stop. Starts at 2× ATR below entry, trails up in 0.5 ATR increments as price advances and as pyramid units are added. Never moves down. Disappears when flat Dashboard table — live S1/S2 levels, both exit channel lows, current ATR value, and trade status showing system type + number of units Labels — S1 ▲ on 20-day breaks, S2 ▲▲ on 55-day breaks, +2U / +3U / +4U on pyramid adds, EXIT when the trade is closedChỉ báocủa richierichtwo6
MSS MTF Dashboard by GhostWskaźnik MSS MTF Dashboard by Ghost wyświetla zmiany struktury trendu na wszystkich interwałach od M1 do MN. Wyświetla zarówno MSS powstałe w Internalach jak i w Externalach. Pomaga to skupić się na jednym wykresie. Chỉ báocủa Ghost_202473
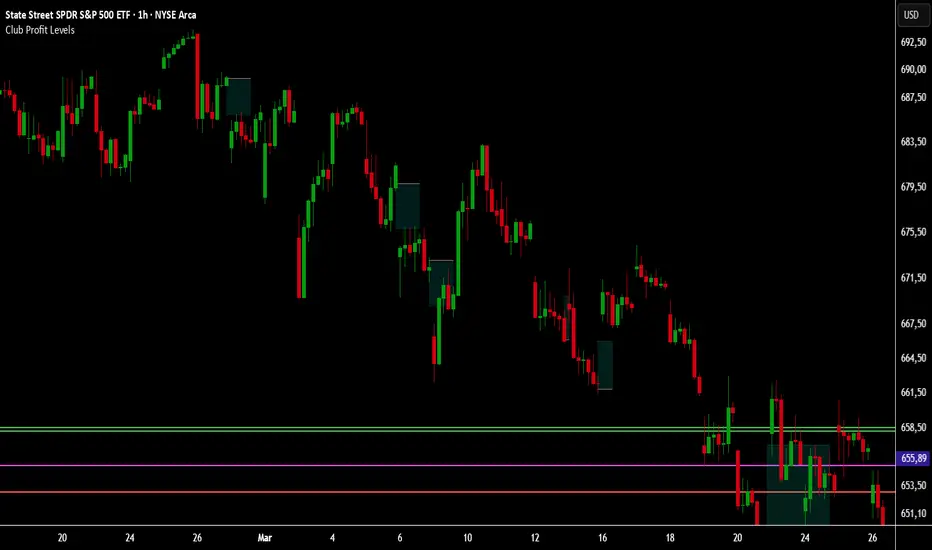
Club Profit LevelsScript diseñado para identificar niveles clave en el SPY con un enfoque claro y simplificado. Este indicador marca zonas relevantes basadas en la acción del precio, eliminando el ruido innecesario y facilitando la toma de decisiones en momentos clave del mercado, especialmente en el cierre de sesión. Está optimizado para traders que buscan precisión, consistencia y una lectura limpia del gráfico sin saturarse de múltiples activos o indicadores. Ideal para complementar estrategias enfocadas en timing y ejecución eficiente.Chỉ báocủa Estefidepaz306
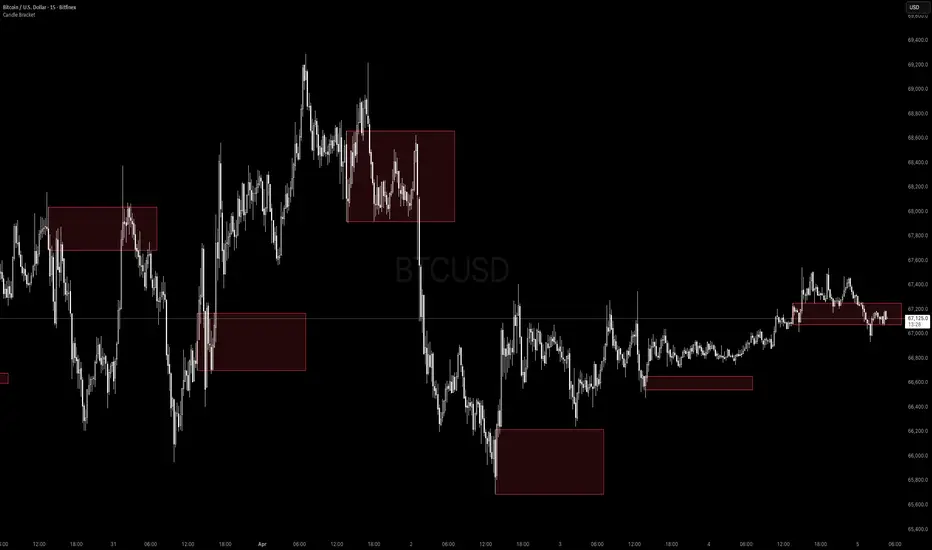
Candle Bracket - Mark Any HTF Candle's Range at a Specific TimeWhat It Does Candle Bracket draws a visual range box using the High and Low of any higher timeframe candle at a user-defined time of day. Set it to the 9:30 AM 15-minute candle and you get the Opening Range. Set it to the London open, the New York open, or any key session candle — the indicator marks it automatically, every day. Use Cases - Opening Range Breakout (ORB) - Mark the 9:30 or 9:45 AM candle as your initial range - Session Opens - London (3:00 AM ET), New York (9:30 AM ET), Asia (8:00 PM ET) - News Candles - Mark a recurring economic release time (e.g. 8:30 AM CPI/NFP candle) - Custom Reference Ranges - Any time-based candle you want as a daily anchor Settings - Fixed Timeframe - The HTF candle to pull from (e.g. 15, 30, 60, D) - Target Hour / Minute - The exact time of the candle you want to mark - Timezone - Defaults to America/New_York. Adjustable for any global session - Rectangle Width (Bars) - How far the box extends to the right - Box Color + Opacity Full visual customization How to Use It 1. Set the timeframe to match your candle of interest (e.g. '15' for a 15-minute candle) 2. Set the target time to the candle's open time (e.g. '9:30' for the NY open candle) 3. The box draws automatically on every matching candle going back in history 4. Use the High and Low of the box as your key levels breakout, rejection, or retest Notes - Works on any asset and any chart timeframe - Keeps the last 20 boxes by default to manage memory efficiently - Best used on intraday charts (1m, 5m, 15m) when targeting session-level candlesChỉ báocủa SkywardProtocolCập nhật 32
OB signals plus liquidity intakeComment lire ce script sur ton graphique ?Le Triangle "OB BUY" (Vert) :Le prix est descendu plus bas que les $X$ dernières bougies (il a "mangé" les stops).Il a immédiatement réintégré et clôturé au-dessus du haut de la bougie précédente.L'Order Block est la zone tracée en vert. C'est ici que tu attends un test pour entrer.Le Triangle "OB SELL" (Rouge) :Le prix est monté plus haut que les $X$ dernières bougies (chasse aux stops des vendeurs).Il a clôturé en dessous du bas de la bougie précédente.L'Order Block est la zone en rouge.Conseils de pro pour filtrer les signaux :Le Lookback (Période) : Par défaut, j'ai mis 10. Si tu l'augmentes (ex: 20 ou 30), le script cherchera des prises de liquidité sur des sommets/creux plus importants, ce qui donne des signaux plus rares mais plus puissants.La Confluence : Ne prends pas tous les signaux. Cherche ceux qui arrivent pendant la phase de Manipulation de ton script AMD précédent.Le Target : Quand tu entres sur un signal "OB Buy", ton premier objectif (TP1) devrait être le sommet de l'Accumulation.Teste-le sur une unité de temps comme le M5 ou le M15 pour voir comment il réagit lors des ouvertures de sessions ! Est-ce que la logique te semble claire ?Chỉ báocủa peacefulOil3405126
SR Breakout Arrows# SR Breakout Arrows - Documentation > **Version**: v1.0 > **Author**: jeffprotrader168 > **Pine Script Version**: v6 > **License**: Mozilla Public License 2.0 --- ## 📊 Overview A fractal-based Support/Resistance breakout detection indicator. Uses `ta.pivothigh` / `ta.pivotlow` to identify local highs and lows as S/R levels, then signals with arrows when price breaks through these levels. Features optional RSI/CCI filtering and anti-repaint protection. Works on all markets and timeframes. Ported from MQL4 (originally by Barry Stander 2004 / Lennoi Anderson 2015 / rewritten by Jeff Reed). --- ## 🎯 Key Features - **Fractal-based S/R Detection**: Confirms fractals with 2 bars on each side, auto-extends horizontal lines until next fractal - **Breakout Arrow Signals**: Draws triangle arrows below/above bars when close breaks S/R levels - **Anti-Repaint Guarantee**: Signals only confirmed after bar close by default; historical arrows never disappear - **RSI/CCI Filtering**: Optional dual-filter to reduce false breakouts - **Deduplication**: Each S/R level triggers only one signal, preventing consecutive duplicate arrows - **Bilingual Interface**: English / Traditional Chinese toggle - **Full Color Customization**: S/R lines and arrow colors are fully configurable --- ## ⚙️ Configuration ### ⚙️ Basic Settings | Parameter | Default | Description | |-----------|---------|-------------| | `i_language` | EN | Language selection (EN / Traditional Chinese) | ### 📊 Signal Settings | Parameter | Default | Range | Description | |-----------|---------|-------|-------------| | `i_signal_dots` | 3 | | Minimum bars after fractal before breakout is valid; higher = more conservative | | `i_apply_to_close` | true | — | When enabled, signals only appear after bar closes (anti-repaint) | ### 🔍 RSI/CCI Filter | Parameter | Default | Range | Description | |-----------|---------|-------|-------------| | `i_rsicci_filter` | false | — | Enable RSI+CCI dual filtering | | `i_rsi_period` | 14 | | RSI calculation period | | `i_rsi_overbought` | 75.0 | — | RSI overbought level (buy signals require RSI below this) | | `i_rsi_oversold` | 25.0 | — | RSI oversold level (sell signals require RSI above this) | | `i_cci_period` | 14 | | CCI calculation period | | `i_cci_buy_level` | 50.0 | — | CCI buy threshold (buy signals require CCI above this) | | `i_cci_sell_level` | -50.0 | — | CCI sell threshold (sell signals require CCI below this) | ### 🎨 Display | Parameter | Default | Description | |-----------|---------|-------------| | `i_show_arrows` | true | Show breakout arrows | | `i_show_sr_lines` | true | Show S/R extension lines | | `i_res_color` | Red | Resistance line color | | `i_sup_color` | Blue | Support line color | | `i_arrow_up_color` | Blue | Breakout up arrow color | | `i_arrow_dn_color` | Magenta | Breakout down arrow color | --- ## 📈 Visual Elements ### Chart Elements - **Resistance Line** (red stepline): Extends horizontally from upper fractal high until a new upper fractal appears - **Support Line** (blue stepline): Extends horizontally from lower fractal low until a new lower fractal appears - **Breakout Up Arrow** (blue triangle ▲ + BUY): Below the breakout bar, indicating bullish breakout - **Breakout Down Arrow** (magenta triangle ▼ + SELL): Above the breakout bar, indicating bearish breakout ### Color Scheme | Element | Default Color | Description | |---------|--------------|-------------| | Resistance Line | Red | Current resistance level | | Support Line | Blue | Current support level | | Breakout Up Arrow | Blue | Resistance Breakout: BUY | | Breakout Down Arrow | Magenta | Support Breakout: SELL | --- ## 🔔 Alert Conditions ### Alert 1: SR Breakout: BUY **Trigger Condition**: Close price breaks above resistance level (all filter conditions passed) **Message Format**: `{ticker} Resistance Breakout: BUY at {close} ({interval})` ### Alert 2: SR Breakout: SELL **Trigger Condition**: Close price breaks below support level (all filter conditions passed) **Message Format**: `{ticker} Support Breakout: SELL at {close} ({interval})` ### Alert 3: SR Breakout: Any **Trigger Condition**: Any direction breakout signal **Message Format**: `{ticker} S/R Breakout at {close} ({interval})` --- ## 💡 Usage Tips 1. **Best Timeframes**: M15 to H4; fractals are more reliable on higher timeframes 2. **Complementary Indicators**: Pair with trend indicators (MA, ADX) to confirm breakout direction 3. **Trading Hours**: Avoid low-liquidity sessions (e.g., late Asian session) where breakout quality is lower 4. **Risk Management**: Arrows are entry references; combine with fixed or ATR-based stop-loss ### Suggested Configurations **Conservative** (fewer false breakouts): ``` i_signal_dots = 5 i_rsicci_filter = true i_rsi_overbought = 70, i_rsi_oversold = 30 ``` **Aggressive** (fast reaction): ``` i_signal_dots = 1 i_rsicci_filter = false ``` **Balanced** (recommended default): ``` i_signal_dots = 3 i_rsicci_filter = false i_apply_to_close = true ``` --- ## 🔍 Technical Details ### Algorithm Explanation The indicator follows a three-step process: **Step 1: Fractal Detection** Uses `ta.pivothigh(high, 2, 2)` and `ta.pivotlow(low, 2, 2)` to detect local highs and lows. Requires 2 bars on each side for confirmation, consistent with the classic fractal definition. When a fractal is detected, the corresponding S/R level is updated and the bar counter resets. **Step 2: S/R Extension and Counting** Each bar increments the counter until a new fractal resets it. The counter ensures breakouts occur sufficiently far from the fractal (`>= i_signal_dots`), avoiding false signals near the fractal point. **Step 3: Breakout Detection** When close price exceeds the S/R level, the counter meets the threshold, and the level hasn't been broken before, a breakout signal fires. Optional RSI/CCI filtering further screens low-quality breakouts. ### Anti-Repaint Mechanism | Layer | Mechanism | Description | |-------|-----------|-------------| | 1 | `barstate.isconfirmed` gate | Only evaluates breakout after bar close | | 2 | `var` persistence | State accumulates bar-by-bar; historical results are fixed | | 3 | `last_broken_res/sup` dedup | Each S/R value triggers only once | ### Performance Considerations - All visuals use `plot()` / `plotshape()` — no dynamic drawing object limits - RSI/CCI computed once per bar, referenced via function to avoid redundant calls --- ## 📝 Version History | Version | Date | Changes | |---------|------|---------| | v1.0 | 2026-04-03 | Initial release: full port from MQL4 to Pine Script v6 | --- ## 📌 FAQ ### Q1: How does this differ from the MQL4 version? A: Core logic (fractal → S/R → breakout) is identical. The Pine version removes MQL4-specific GlobalVariable persistence (Pine auto-recalculates all history on load), arrow symbol codes (replaced with `plotshape`), and notification channel toggles (managed by TradingView platform). Adds color customization and bilingual interface. ### Q2: Why are some breakouts missing arrows? A: Possible reasons: (1) `i_signal_dots` is set too high — not enough bars since fractal; (2) RSI/CCI filter is enabled but conditions aren't met; (3) The S/R level was already triggered by a previous breakout (dedup mechanism). ### Q3: Can both up and down arrows appear on the same bar? A: Yes. Up and down breakouts are evaluated independently, allowing simultaneous signals in extreme market conditions. ### Q4: What happens with `i_apply_to_close = false`? A: The latest unconfirmed bar participates in breakout evaluation, which may cause arrows to appear then disappear (repainting). Recommended to keep the default value `true`. --- ## 📞 Support & Feedback For any questions or suggestions about this indicator, please feel free to open an Issue or Discussion. --- *Last Updated: 2026-04-03* Chỉ báocủa jeffprotrader1681144
ICT DAILY BIAS PRO [SOURCE CODE]//Source code ICT-focused TradingView indicator that combines daily bias, session structure, and multi-timeframe context in one script. It auto-handles New York DST (UTC-4/UTC-5), tracks rolling D-1/D-2 day data, and computes expansion-based bullish or bearish bias logic. The script draws custom session and HTF candles, killzone shadow boxes, liquidity markers, and dynamic 50% continuation/violation zones. It includes advanced modules for imbalances (FVG/OG/VI), CISD levels, SMT divergence versus a comparison symbol, and optional dashboards/debug views. Overall, it is built as a configurable “all-in-one” intraday framework for ICT-style bias confirmation, manipulation detection, and execution guidance.Chỉ báocủa abdirahmansm02163
ICC Continuation Engine v3ICC Continuation Engine v2 — How It Works Core Concept Identifies high-probability continuation trades by confirming that price has pulled back within an established trend and is resuming in the original direction — across multiple timeframes simultaneously. Timeframe Stack (Top-Down) LevelTimeframePurposeBiasWeekly + DailyOverall trend directionStructure4H + 1HIntermediate momentum alignmentExecutionChart TFEntry signal trigger All three levels must agree before any signal fires. ICC Phase Sequence Indication — Trend aligned, momentum building (MACD + RSI + volume) Pre-Breakout — Price compressing near day high/low with rising MACD Correction — Price pulls back to Fast EMA without breaking trend structure Continuation — Price breaks above the correction range → trade entry triggered Supporting Layers Supply & Demand Zones — Pivot-based zones with ATR padding; institutional reactions flagged Day High / Low — Live intraday levels updated each session Pivot Trendlines — Auto-drawn from swing highs/lows, extended right Risk Model — Auto-calculates entry, stop, T1 (1.5R), and T2 (3.0R) on every continuation signal Session Filter Uses input.session() with "America/Chicago" timezone Default window: 7:00 AM – 4:00 PM CT (editable via TradingView's native session picker) Toggle ON/OFF without losing your time settings All signals, bgcolors, and alerts are blocked outside the window Status Table (top-right) Shows live values for: Trade Type, HTF Bias, Structure, Phase, RSI, MACD Histogram, Volume Spike, Day High/Low, Trade Plan, and Session Status.Chỉ báocủa hary349veo319
SCALP PRO v2 - Advanced Multi-Timeframe Scalping IndicatorSCALP PRO v2 is a comprehensive, momentum-based scalping indicator designed for day traders who demand precision. It seamlessly merges the classic Opening Range Breakout (ORB) strategy with advanced Multi-Timeframe (MTF) analysis and Smart Money Concepts (SMC) to deliver high-probability trade setups. Key Features: Dynamic ORB Strategy: Automatically plots the Opening Range High and Low based on your customizable time inputs (default 9:30 - 9:45) to capture early session volatility. 4-Layer Multi-Timeframe Confluence: Daily Bias: Filters the macro trend using the Daily SMA 20 slope and EMA 200. 1H Structure: Confirms intraday momentum via the 1H EMA 8/21 cross and VWAP trajectory. 15M SMC Integration: Systematically detects Fair Value Gaps (FVG), Order Blocks (OB), and Candle Range Theory (CRT) setups to validate strong institutional levels. 5M Execution: Identifies pullbacks to key Fibonacci retracement zones (Golden & Premium) aligning with the EMA 8, EMA 21, and VWAP. Smart Filtering System: Integrates Bollinger Bands to prevent entering at overextended extremes (buying the top / selling the bottom), alongside a strict candle strength filter and a customizable signal cooldown mechanism to avoid overtrading. Clean Visuals & Key Levels: Keeps your chart clutter-free while automatically plotting Yesterday's High/Low/Close, Today's High/Low, and clear visual markers for standard and "Strong" Buy/Sell signals. Built-in Alerts: Ready-to-use alert conditions for every setup so you never miss a prime entry.Chỉ báocủa wal2hdez1131
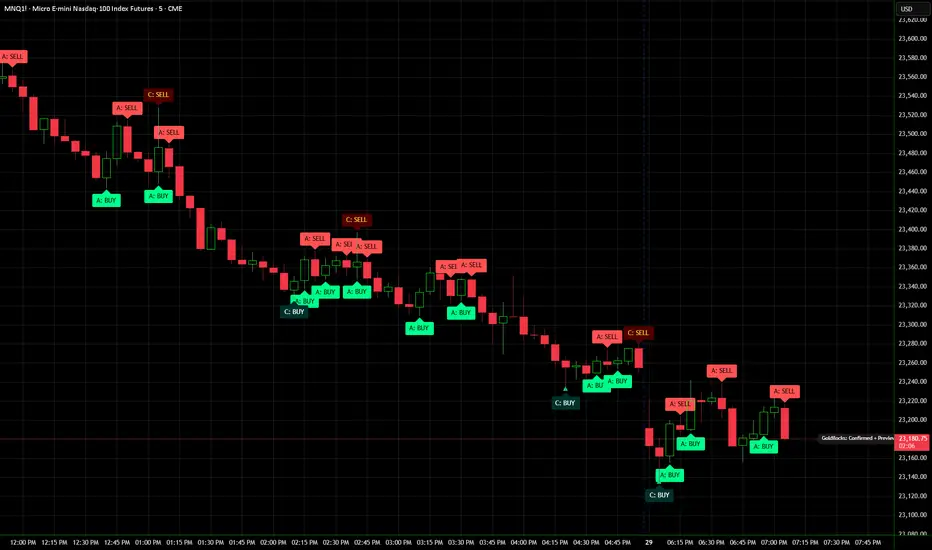
Goldilocks Pivot Fractals v3.0v3.0 UPDATE — Three Signal Modes This update adds a Signal Mode engine to the classic Williams Fractals algorithm, giving traders three detection methods from zero-delay scalping signals to fully confirmed swing pivots. WHAT'S NEW Signal Mode Dropdown (Settings → Signal Mode): Confirmed — The original Williams Fractals logic. Detects pivot highs and lows by requiring n bars on each side to confirm the fractal pattern. Signals are mathematically confirmed but arrive after the lookback window completes. Best for swing traders and higher timeframes (15m, 1H, 4H, Daily) who prefer certainty. Labels display as C: BUY / C: SELL. Zero-Lag — Fires on the forming bar using momentum-reversal detection. No lookforward bars required. When smoothed momentum crosses zero and the bar closes in the signal direction, the signal fires at bar close with zero delay. Built for scalpers on fast instruments and lower timeframes (1m, 2m, 5m). Labels display as Z: BUY / Z: SELL. Confirmed + Preview — Runs both engines at the same time. Alert labels (A: BUY / A: SELL) appear instantly when the zero-lag engine detects a momentum reversal. Confirmed labels (C: BUY / C: SELL) stamp later when the Williams Fractal pattern fully validates. Early signal plus confirmed stamp, side by side on the same chart. ADDITIONAL IMPROVEMENTS • All arrow markers converted to zoom-proof labels — arrows hold their shape at every zoom level instead of shrinking to invisible lines • Independent toggles for Shapes, Alert Labels, and Buy/Sell Labels — show exactly what you want, hide what you don't • Arrow size control (tiny through huge) • Alert label size control (independent sizing) • Directional alert label colors — green background for A: BUY, red background for A: SELL with black text for high contrast on dark charts • Sensitivity control for Zero-Lag mode (Low / Normal / High) • On-chart mode tag displays the active signal mode • Full alert support across all modes HOW TO USE For scalping: Set Signal Mode to Zero-Lag. On a 2-minute MNQ chart, the move can be 20-40 points in two bars. Waiting for a confirmed fractal means watching someone else's profit. Zero-Lag fires when the turn starts. For swing trading: Set Signal Mode to Confirmed. The classic Williams Fractal algorithm with n-bar confirmation on each side. Let the pattern prove itself. For both perspectives: Set Signal Mode to Confirmed + Preview. The A: labels give you the real-time alert, the C: labels confirm or invalidate. Use them together for higher- conviction entries. Adjust the Periods (n) setting to control the confirmation window in Confirmed mode. Lower values detect smaller pivots more frequently. Higher values filter for larger, more significant swing points. Works on any liquid market — futures, forex, crypto, equities, indices. Use with trend confluence tools for best results. — NPR21 Chỉ báocủa NPR21123
Kevy Key Hour SetupKevy Key Hour Setup is a precision timing indicator built around the 3rd 5-minute candle of each hour as the primary directional trigger for NQ/MNQ futures and other liquid instruments. At the start of each new hour, the indicator draws a zone box around the first candle of that hour to establish the broader hourly context. At the 10-minute mark, the 3rd 5-minute candle begins forming — this is the key candle. Once it closes at the 15-minute mark, the zone is officially locked with high and low boundary lines, a 50% midline, color-coded range fill (red above mid, green below mid), price labels, and configurable profit targets above and below. Break signals fire the moment price closes outside the 3rd candle's range — a green LONG label below the bar on a topside break, a red SHORT label above the bar on a downside break. A max range filter prevents signals from firing on wide, choppy candles. Two sets of offset lines above and below the hourly candle high/low provide additional entry and trigger reference levels. Built-in alerts: 🕐 New Hour Open — prep for the setup ✅ Zone Set at 15-min mark — 3rd candle closed, zone is live 🟢 LONG Trigger — close broke above 3rd candle high 🔴 SHORT Trigger — close broke below 3rd candle low The Market Has a Rhythm Every hour, institutional algorithms and market makers reset. The first 10 minutes of each hour (:00-:10) is the initial price discovery phase — market makers are feeling out where liquidity sits, running stops, and establishing the opening range for that hour. This is noise. You don't want to trade it. The 3rd Candle Is the Tell The 3rd 5-minute candle (:10-:15) is where the market starts to reveal its hand. By the time the first two candles have printed, the initial volatility has settled and a cleaner directional bias is beginning to form. The high and low of that 3rd candle represent the first meaningful range where both buyers and sellers have had a fair chance to respond to the hour's opening move. It's not random — it's the first candle of the hour where smart money has had time to position. Why the Range Matters The high and low of the 3rd candle become your decision levels. Price respecting and holding above the midline signals buyer control. Price sitting below the midline signals seller control. When price breaks and closes outside the range entirely, it signals that one side has won the argument for that hour and a directional move is likely to follow. The break is not a prediction — it's a confirmation. The Max Range Filter If the 3rd candle is too wide, the setup is disqualified. A wide candle means the market was already volatile and indecisive during that window — the range is too sloppy to use as a clean trigger. A tight, well-defined range produces a higher quality setup because the risk is defined and the breakout is more decisive. The Offset Lines The offset lines above and below the hourly candle give you a buffer zone around the key levels. Price often pokes through a level before committing, so the offset lines help you avoid getting triggered by a wick and instead wait for a more meaningful push through the level. The Hourly Box The hourly box drawn at the open of each hour gives you the broader context — it shows you where the market started the hour and how far price has moved relative to that opening candle. If the 3rd candle break aligns with price moving away from the hourly open in the same direction, that's added confluence. The Bottom Line The setup works because it's built on market structure that repeats every hour across liquid instruments. Institutions operate on schedules, algorithms reset on the hour, and liquidity cycles follow predictable rhythms. The 3rd candle is simply the first clean, unmanipulated read of where that hour wants to go — and the break of its range is your entry signal into that move. Chỉ báocủa kevystocks2296
Smash Reversal(MastersinMarkets)Smash Reversal (MastersinMarkets) Description The Smash Reversal is a price-action-based technical indicator designed to identify exhaustion points in the market. It targets "Smash Bar" setups, which occur when a price trend overextends significantly beyond recent historical boundaries before showing signs of a reversal. This tool helps traders visualize these specific high-velocity exhaustion moments on any timeframe, providing a systematic way to monitor trend shifts without relying on lagging oscillators. Core Logic The script identifies two distinct phases for a valid signal: The Smash Bar (Exhaustion) : For a bullish setup, a bar must close below the lowest low of the user-defined lookback period. For a bearish setup, it must close above the highest high of that period. Price Action Filter : The logic incorporates an isOutside check to ignore "Outside Bars," ensuring that indecisive market range expansions do not trigger false exhaustion signals. Confirmation Trigger : A signal is only plotted when the current bar’s price breaks the high (for buys) or low (for sells) of the preceding Smash Bar, confirming that momentum has officially shifted. Uniqueness : This indicator is unique because it combines relative price extremes with a strict confirmation requirement. While many reversal scripts trigger immediately upon a new low or high, the Smash Reversal requires: A specific close-to-low/high relationship. The exclusion of indecisive "Outside Bar" volatility. Secondary price action confirmation before the signal appears. This multi-step validation is designed to protect traders from "falling knives" in strong trending environments. Key Features : Dynamic Lookback Inputs: Traders can independently adjust the "Smash Buy" and "Smash Sell" lookback periods to suit different market volatilities. Visual Background Highlights: The script automatically shades the background of a valid Smash Bar (exhaustion candle) to alert the trader before the actual signal is triggered. Non-Repainting Signals: The shapes are plotted using an offset to ensure that once a signal is confirmed and the bar closes, it remains fixed on the chart. How to Use : Identify the Setup: Look for the highlighted background areas on your chart. This indicates a potential "Smash" exhaustion is occurring. Wait for the Triangle: Only enter a trade when the SeaGreen (Bullish) or Black (Bearish) triangle appears, as this signifies that price has successfully broken the Smash Bar’s extreme. Settings Adjustment: If trading highly volatile assets like Nifty or Bank Nifty, consider increasing the lookback period to filter out minor price fluctuations. Disclaimer : Trading involves significant risk. This indicator is a tool for technical analysis and does not constitute investment advice. Past performance, as shown in any historical chart examples, is not a guarantee of future results. The future is fundamentally unknowable, and traders should always use appropriate stop-loss orders and risk management.Chỉ báocủa MastersinMarkets1186
Multi Timeframe Fractal Map [Herman]Multi Timeframe Fractal Map This script is a multi-timeframe chart-reading framework that evaluates how the current candle interacts with the previous candle’s range across several timeframes, then combines that higher-timeframe context with intermarket comparison, structural execution levels, and session reference prices on one chart. The core concept behind the script is a range interaction and acceptance/rejection model: first, higher timeframe candles are reconstructed on the active chart, then the current higher timeframe candle is compared with the previous higher timeframe candle, then the script evaluates whether price is accepting expansion beyond that prior range or rejecting it, then correlated markets are checked for confirmation or divergence, and only after that are lower timeframe structural levels used for execution reference. The script does not generate automated buy/sell orders. Its purpose is to organize context first and execution second. Why these components are combined In discretionary intraday trading, traders often read: higher timeframe structure on one chart, range interaction and liquidity events on another, intermarket confirmation separately, execution levels on lower timeframes, and session anchors such as PDH/PDL or Daily Open somewhere else. This separation can lead to inconsistent interpretation. This script combines these elements because each one evaluates a specific stage of price behavior: range interaction defines direction, intermarket comparison evaluates confirmation, and lower-timeframe structure is only used after that context is established. The intended order is: define higher timeframe structure, classify current interaction with the previous higher timeframe range, check whether correlated markets confirm or diverge, establish current price location using reference levels, use lower timeframe structural levels only after that context is already defined. For that reason, the script is not intended as a group of unrelated tools. Each part is included to evaluate a different stage of the same chart-reading process. 1) Higher timeframe candle reconstruction The script reconstructs multiple higher timeframe candles directly on the active chart. For each selected higher timeframe, it maintains rolling values for: open, high, low, close, and time. These values are built dynamically from lower timeframe data, so the candles update while they are still forming. This allows the script to show: the current developing HTF candle body and wick, prior completed HTF candles, current HTF range expansion, and countdown information for the active HTF candle. The purpose of reconstruction is to keep higher timeframe structure visible on the execution chart instead of requiring the user to switch layouts. 2) Higher timeframe range interaction model For each selected higher timeframe, the script compares the current candle with the previous candle’s range. Using the previous candle as C1 and the current candle as C2, it evaluates: sweep high when C2 high exceeds C1 high, sweep low when C2 low breaks below C1 low. It then evaluates where C2 closes relative to C1: close above C1 high = acceptance above the prior range, close below C1 low = acceptance below the prior range, sweep without close beyond the boundary = rejection / failed expansion. If neither side is swept, or if both sides are swept without clear directional acceptance, the state is treated as neutral. This classification defines whether price is: expanding and being accepted, expanding but being rejected, or not interacting with the prior range in a meaningful way. 3) Candle progression logic (Candle 2 / Candle 3) The script evaluates sequential HTF candle behavior. Candle 2 A Candle 2 condition is identified when: the previous candle has a defined direction, the current candle interacts with the prior extreme (high or low), and the current candle closes back through or beyond that level. This marks a potential reversal attempt. Candle 3 A Candle 3 condition requires: a valid prior Candle 2, directional continuation, and a close condition relative to the prior range (configurable strength). This marks follow-through after the initial reaction. The purpose of this progression is to distinguish between: an initial reaction at a level, and confirmed expansion following that reaction. 4) HTF classification table The classification table summarizes the same range interaction logic across all active higher timeframes. For each timeframe, the script uses: C2 high, low, close, and C1 high, low. Classification rules: LONG → C2 closes above C1 high SHORT → C2 closes below C1 low AVOID → all other cases, including: both sides swept, no sweep, sweep without acceptance. This output is deterministic and reflects current HTF behavior. A combined bias is calculated by counting agreement across timeframes. It summarizes alignment, not prediction. 5) Intermarket comparison (SMT) The script compares correlated index markets to evaluate confirmation or divergence. General conditions: bearish divergence → one market forms a higher high while another does not confirm, bullish divergence → one market forms a lower low while another does not confirm. This comparison is aligned with the same reconstructed HTF structure. Its purpose is to evaluate whether a move is supported across markets or shows relative weakness. 6) Sweep visualization The script highlights sweep behavior directly on higher timeframe candles. A sweep occurs when price moves beyond a previous HTF high or low. The subsequent close determines whether that move is accepted or rejected. This is part of the same range interaction model and is not a separate signal. 7) CISD structural execution levels CISD levels are derived from changes in candle direction on lower timeframes, using the open price of the candle where the directional shift occurs. The script tracks these levels as: pending → identified but not yet confirmed, confirmed → price closes beyond the level. These levels represent local structure and are intended for execution reference only after higher-timeframe context is established. For example, if a higher timeframe shows acceptance above the previous range and correlated markets confirm the move, a CISD break in that direction can be used as execution alignment. 8) HTF imbalance (FVG) The script evaluates imbalance using non-overlapping price ranges: bullish imbalance → earlier high is below a later low, bearish imbalance → earlier low is above a later high. If price trades back through the zone, it is considered invalidated. These zones are shown in the context of reconstructed HTF candles. 9) Reference levels (location) The script plots: Previous Day High / Low, Previous Day midpoint (50%), Daily Open, Midnight Open, 4H Open. These levels define location only and are not used for directional classification. 10) Optional time segmentation The script can divide the session into fixed time blocks and track their high and low. This allows observation of: compression, expansion, and failed expansion within repeated time intervals. How to use the script The script is intended to be used in sequence: Observe higher timeframe candles to define structure. Evaluate how the current candle interacts with the previous HTF range. Determine whether expansion is accepted or rejected. Check intermarket comparison for confirmation or divergence. Review multi-timeframe classification for alignment. Use reference levels to determine location. Use CISD levels for execution only if higher-timeframe context is aligned. Lower timeframe signals should not be used independently. Intended use This script is intended for traders who: use multi-timeframe analysis, focus on range interaction and structural behavior, use intermarket comparison as context, and require structured decision-making on one chart. Not intended as an automated trading system, a standalone signal generator, or a guarantee of future performance. Credits Portions of the higher timeframe candle reconstruction were adapted from open-source work by Çağrı Dikici and are used with permission. Disclaimer This script is provided for analytical and educational purposes only. It does not constitute financial or investment advice. All trading involves risk.Chỉ báocủa helmans1399 1.3 K
One shot, One killOne Shot, One Kill One Shot, One Kill is a precision-based indicator designed for traders who focus on executing a single high-probability trade using key daily levels and automatic breakout trigger zones. The idea is simple: wait for the right moment and strike once when the market confirms direction. Key Features 1️⃣ Daily Key Levels (Open, High, Low) The indicator automatically plots the most important levels of the current trading day: Daily Open (Yellow line) Daily High (Green line) Daily Low (Red line) These levels often act as liquidity zones and reaction points where the market tends to make decisive moves. 2️⃣ Automatic Buy Stop & Sell Stop Levels The indicator dynamically creates two trading trigger levels based on a selected base price: Buy Stop level above the price Sell Stop level below the price These levels help traders prepare for momentum breakouts or directional confirmation trades. 3️⃣ Fully Customizable Distance You can easily adjust: Distance in points from the base price Number of forward bars for projection Line style (solid, dotted, dashed) Line thickness This makes the indicator adaptable to different markets such as: Futures (MNQ, NQ, ES) Forex Crypto Indices 4️⃣ Clean and Minimalist Design The indicator was built with a clean chart philosophy, showing only the most essential information needed to execute a trade. Perfect for traders who prefer: Scalping Momentum trading Breakout strategies Precision-based entries Philosophy Behind the Indicator The concept of One Shot, One Kill is based on discipline and patience: Wait for the right setup, execute once, and capture the move. No unnecessary noise. Just clear levels and precise execution.Chỉ báocủa sebascamach1130
MNQ Fractal SFP & FVG MasterOverview: This script is a Multi-Timeframe (MTF) execution assistant designed specifically for the Micro E-mini Nasdaq 100 (MNQ). It mechanically automates the visual detection of the "Fractal SFP Model"—a high-probability mean-reversion strategy that capitalizes on algorithmic stop-hunts and subsequent institutional displacement. How It Works (The Logic): The indicator runs natively on the 5-Minute (M5) chart while quietly pulling 15-Minute (M15) data in the background to calculate institutional rejection wicks without requiring you to switch timeframes. Phase 1: The Trap (M15 SFP): The script scans the background M15 timeframe for a Swing Failure Pattern. It mathematically defines a valid "trap" as an M15 candle where the sweep wick is at least 1.5x larger than the physical body of the candle, proving violent institutional rejection of a price level. Phase 2: The Displacement (M5 FVG): Once a trap is confirmed, the script actively scans the current M5 chart for a 3-candle Fair Value Gap (FVG) forming in the opposite direction. This proves that institutional order flow has stepped in and created a structural void. Phase 3: The Confluence: If a valid M5 FVG prints within a customizable lookback window (default 3 bars) of an M15 trap, the system locks in the setup and fires a trigger. Visual Guide: Green/Red Shaded Boxes: Highlights valid 5-Minute Fair Value Gaps natively on the chart. The boxes extend to the right until mitigated. Green Triangle (Up): Prints below the candlestick when a Bullish M15 Sweep perfectly aligns with a new Bullish M5 FVG. Red Triangle (Down): Prints above the candlestick when a Bearish M15 Sweep perfectly aligns with a new Bearish M5 FVG. Execution Protocol & Rules of Engagement: This is an alert-driven alert system, not a blind autotrader. It includes native TradingView alert conditions (🚨 BULLISH FRACTAL SFP and 🚨 BEARISH FRACTAL SFP). The Human Filter: When an alert fires and a triangle prints, the trader must manually verify that the M15 trap wick actively pierced a mapped 1-Hour (H1) structural liquidity pool (e.g., London High/Low, Previous Session High/Low). The Kill Switch: If the trigger prints in the middle of a choppy range, it is algorithmic noise. The setup is ignored. The Green Light: If the trigger prints exactly at a predefined H1 structural line, the trader calculates risk and places a limit order at the nearest boundary of the highlighted FVG.Chỉ báocủa Toddzilla12
Volume ClockFULL DESCRIPTION The Volume Clock displays real-time volume data across multiple timeframes in a single compact table. Monitor volume activity from 1 minute up to 1 month without switching charts. HOW IT WORKS Each column represents one timeframe. The table updates on every tick showing the current candle volume compared to the previous candle and the 20 bar average. WHAT EACH ROW SHOWS TF Label The timeframe for that column. Header turns green when current volume exceeds the previous candle. Turns red when below. Current Volume The volume accumulating on the current candle in real time. Displayed in K or M format for readability. Cell flashes gold when volume exceeds twice the average. Previous Candle Volume The completed volume from the candle that just closed. Prefixed with P for Previous. Compare this to current volume to see if participation is growing or shrinking. VS AVG The current volume divided by the average volume over the last 20 bars. A reading of 1.5x means 50 percent above the average. Hidden in Compact mode. STATUS A plain English label translating the ratio. EXTREME above 3.0x VERY HIGH 2.0 to 3.0x HIGH 1.5 to 2.0x ABOVE 1.2 to 1.5x NORMAL 0.8 to 1.2x BELOW 0.5 to 0.8x LOW 0.3 to 0.5x DEAD below 0.3x SETTINGS Table Mode Compact shows Label Volume Status only. Normal adds VS AVG. Full shows all rows. Font Size Tiny Small Normal or Large. Volume Average Length Default 20 bars. Adjust to suit your trading style. Slots 1 to 15 Each slot has its own on/off toggle minutes input box color and font color. Set any timeframe from 1 minute to 43200 minutes which equals one month. COMPATIBILITY Works on all instruments including futures equities crypto and forex. Optimized to stay within the 40 request.security call limit so it works on all TradingView plans including the free plan. Best applied to a 1 minute or 5 minute chart so all slot timeframes display correctly. TECHNICAL NOTE Previous candle volume uses lookahead on historical bars for display purposes. Current bar data is not affected. This is standard practice for displaying completed candle data from higher timeframes. DISCLAIMER This indicator is for informational and educational purposes only. It does not constitute financial advice and does not generate buy or sell signals. Volume data on forex pairs represents tick volume not actual traded contracts. Always conduct your own research and analysis before making any trading decisions. Past performance is not indicative of future results. Trading involves risk including the possible loss of principal.Chỉ báocủa Dougie_dee76
Timeframe ClockTITLE Timeframe Clock SHORT DESCRIPTION A multi-timeframe countdown clock that shows the time remaining on up to 15 timeframes simultaneously. FULL DESCRIPTION ━━━━━━━━━━━━━━━━━━━━━━━━ The Timeframe Clock displays a real-time countdown timer for multiple timeframes in a single table. See exactly how much time remains before each candle closes across all your key timeframes at once — without switching charts. FEATURES ━━━━━━━━━━━━━━━━━━━━━━━━ • Up to 15 customizable timeframe slots • Countdown timer per slot • Open and Close price per timeframe • Direction indicator per timeframe • Percent time remaining • Hot Warm Cool color system — red under 20 percent — gold 20 to 50 percent — green over 50 percent • Sync flash — last 60 seconds turns aqua • Fully customizable colors • Compact Normal Full modes • Works on all instruments including futures crypto forex and stocks • Optimized for free and pro plan users HOW TO USE ━━━━━━━━━━━━━━━━━━━━━━━━ Add the indicator to your chart. Each slot shows a countdown to the next candle close on that timeframe. When multiple slots turn red or flash aqua at the same time it indicates a multi-timeframe sync point where several candles are closing simultaneously. For best results apply to a 1 minute or 5 minute chart so all slot timeframes display correctly. Customize each slot with your preferred timeframe colors and display options in the settings panel. NOTE ━━━━━━━━━━━━━━━━━━━━━━━━ This indicator is for informational and timing purposes only. It does not generate buy or sell signals. Always conduct your own analysis before making any trading decisions. Past performance is not indicative of future results.Chỉ báocủa Dougie_dee129
MTF ATR Wave (5m, 15m, 30m) by ogudora█ MTF ATR Wave (5m, 15m, 30m) by ogudora A minute-timeframe ATR Supertrend companion indicator, designed to work alongside "MTF ATR (1H, 4H, 1D, 1W, 1M) with databox" — filling the gap between intraday micro-structure and higher-timeframe trend analysis. █ WHAT IT DOES This indicator plots ATR-based Supertrend lines for 5-minute, 15-minute, and 30-minute timeframes simultaneously on a single chart. It uses a gradient color system where shorter timeframes appear lighter and longer timeframes appear darker, giving you an instant visual read on how momentum is building — or fading — across minute-level structure. █ WHY "WAVE"? After a sell-off, recovery doesn't happen all at once. It cascades: the 5m Supertrend flips up first, then the 15m follows, and finally the 30m confirms. Watching these layers light up in sequence — like a wave rolling in — tells you whether a bounce has real traction or is just a dead cat. █ KEY FEATURES ◆ Gradient Supertrend Lines 5m (lightest) → 15m (medium) → 30m (darkest). Uptrend linewidth=2, downtrend linewidth=1, so the indicator stays visually subordinate to the parent 1H/4H/1D lines. ◆ Trend-Change Circles (●) A small dot appears at the exact price level where each timeframe's Supertrend flips direction. ◆ Warning / Break Signals (⚠️ / ⚡) ⚠️ Warning: Price breaks below an uptrend Supertrend line (potential trend failure). ⚡ Break: Price breaks above a downtrend Supertrend line (potential trend reversal). Cooldown timers and daily count limits prevent signal spam. ◆ Reba Monitor (Recovery Progress Scorecard) A table (top-left, off by default) scoring recovery health out of 9 points: • ATR Score (0–3): How many of the 3 minute-TF Supertrends are in uptrend • MA Score (0–6): Whether price is above the 20/50/200 EMA on 1-minute and 5-minute charts Judgment labels: 🔴 Reba Fail → ⚪ Neutral → 🟡 Signs → 🟢 In Progress → 🟢 Confirmed ◆ Status Table (Databox) Top-right table (off by default) showing for each timeframe: TF | ↑↓ | Line Value | Deviation % | 100-Share Loss | Frozen Support | Missed-Move % ◆ 4 Color Presets Switch the entire color scheme with one dropdown: 1. Green × Red (default) 2. Red × Blue (fully separates from the parent indicator's green/red) 3. White × Black (monochrome, zero interference with any overlay) 4. Cyan × Magenta ◆ Plot-Budget Optimised Uses only 31 plot calls, leaving ample headroom to run alongside the parent indicator (which uses ~33) within TradingView's 64-plot limit. █ HOW TO USE 1. Add this indicator alongside "MTF ATR (1H, 4H, 1D, 1W, 1M) with databox" 2. On a 1-minute or 5-minute chart, you'll see layered Supertrend lines cascading from 5m (closest to price) to 30m (furthest) 3. After a sell-off, watch the gradient flip from red to green — 5m first, then 15m, then 30m 4. Enable the Reba Monitor (Master Control) to get a numerical score confirming whether the bounce is holding above key EMAs 5. If the parent indicator's highlighter washes out the colors, try switching to the "Red × Blue" or "Cyan × Magenta" preset for contrast █ RECOMMENDED SETTINGS • Best viewed on 1m or 5m charts • Pair with the parent indicator for full multi-timeframe coverage (1m → 1M) • Status Table and Reba Monitor are OFF by default to keep the chart clean — enable when needed • Individual colors and transparency can be fine-tuned via TradingView's style settings (gear icon → each plot line) █ ALERTS • 5m / 15m / 30m Warning and Break alerts • Reba Score ≥ 7 (strong recovery signal) • Reba Score = 9 (full confirmation) • Reba Score ≤ 1 (recovery failure)Chỉ báocủa ogudora081213
Signal Goat HH HL LH LL Extension LinesHH HL LH LL Extension Lines automatically identifies Higher Highs, Higher Lows, Lower Highs, and Lower Lows using pivot-based market structure logic. It draws horizontal extension lines from confirmed swing points so traders can easily spot trend direction, key reaction levels, and possible structure breaks. With customizable pivot length and lookback period settings, this indicator is useful for traders who want a clean and simple way to map market structure on any timeframe.Chỉ báocủa GoatsSignals11125
Standalone SMT: Institutional Precision (V2 Fix)SMT between correlated markets. Hopefully this helps.Chỉ báocủa L83rG83r19
volumes candlesIn volume candles, if the body is 2x, it appears in blue color; otherwise, it appears in red.”Chỉ báocủa sudhakar_kb14