Zero-Lag Multi-Divergence v6 - Scalper NBDivergence pops early. Look for moves on your oscillator after divergence pops. Best used on 10min or higher timeframes.Chỉ báocủa buche177936
Dual Opening Range FibonacciSD For DOW and GOLD / Best to time it on this scenario On a day without new's DOW moves from -4 to -4 on londong ( if london took out one of the sides of AS range ( High or Low) and reverses in session time ) so smooth takes possible (82% of the time)Chỉ báocủa mehrojiddin15255
kNN Market Architecture [LuxAlgo]The kNN Market Architecture indicator is a professional-grade market structure framework that utilizes a k-nearest neighbors (kNN) machine learning classifier to validate price pivots across multiple time horizons. By integrating a dynamic detection engine, cumulative volume delta analysis, and a range-based volume profile, this tool provides a multi-layered hierarchical view of price action to identify high-probability reversal and breakout zones. 🔶 USAGE The indicator identifies and classifies market structure into three distinct layers: Short-Term (ST), Medium-Term (MT), and Long-Term (LT). Unlike traditional pivot indicators that rely on static lookbacks, each point must pass a kNN similarity test based on relative volatility and volume features to be validated and plotted. 🔹 Multi-Scale Bias Analysis Users can define which structural layer (ST, MT, or LT) dictates the overall market bias. When price is trading above the most recent validated high of the selected term, the candles and dashboard will reflect a bullish bias. Conversely, trading below the recent validated low indicates a bearish bias. This allows for seamless "top-down" analysis within a single chart view. 🔹 The Delta Tank When a structural level is active (not yet breached), a "Delta Tank" label appears at the price line. This tool tracks the cumulative volume and delta (buying vs. selling pressure) since the level was formed. A green icon with a high fill percentage indicates aggressive buying defending a support level or attacking resistance. A red icon suggests selling pressure is mounting, potentially signaling an upcoming Break of Structure (BOS). The percentage value represents the delta-to-total-volume ratio, providing a metric for the "exhaustion" or "strength" of a specific level. 🔹 Anchor Volume Profile The indicator includes a dynamic Volume Profile that anchors itself specifically to the current active structural range. This profile calculates volume distribution between the most recent validated High and Low of your chosen Bias Source, allowing you to see exactly where the most "fair value" was traded within the current trading range. 🔶 ADVANTAGES OVER TRADITIONAL METHODS The kNN Market Architecture offers several significant improvements over standard market structure indicators: Noise Filtering via Machine Learning: Traditional pivot indicators plot every mathematical high/low within a window. The kNN classifier filters these by comparing the "signature" (volatility and volume) of the current point against historical successful pivots. If a pivot lacks the necessary confidence, it is ignored, leading to much cleaner charts. Volatility-Adjusted Detection: Most indicators use a fixed lookback (e.g., 10 bars). This script uses a dynamic engine that expands during high volatility and contracts during low volatility, ensuring the structure remains relevant regardless of market speed. Contextual Volume Data: While standard indicators only show price, this tool layers Volume Delta and Volume Profiles directly onto the structure points, providing the "why" behind price movements. 🔶 DETAILS 🔹 Auto-Adjust Sensitivity The core of the detection engine is its ability to adapt to changing market conditions. When "Auto-Adjust Sensitivity" is enabled, the script calculates a volatility ratio by comparing the current ATR to its long-term average. During periods of high volatility, the engine automatically expands the detection window. This ensures that the indicator requires more significant price movement to confirm a new structure point, preventing "false positives" during erratic price swings. In low-volatility environments, the window contracts, making the engine more sensitive to subtle structural shifts. 🔹 kNN Validation Engine For every potential price pivot, the engine analyzes features such as Relative ATR and Relative Volume. It compares these features against a historical database of previous pivots. If the current point does not meet the "Confidence Threshold" (the average score of its k-nearest neighbors), it is discarded. 🔶 SETTINGS 🔹 Dynamic Engine Structure Sensitivity: Controls the base lookback for pivot detection. Auto-Adjust Sensitivity: Enables volatility-based scaling of the detection engine. 🔹 kNN Classifier k-Nearest Neighbors: The number of historical neighbors to compare against the current pivot. Confidence Threshold: The minimum similarity score required to validate a structure point. 🔹 Visual Hierarchy ST/MT/LT Toggles: Enables or disables the visibility of Short, Medium, and Long-term structures. Bias Source: Choose which term (Auto, LT, MT, ST) governs candle coloring and the Volume Profile. Color Candles by Bias: Toggles the gradient candle coloring based on the current range position. 🔹 Volume Profile Show Volume Profile: Toggles the structural range-based profile. Profile Rows: Adjusts the vertical granularity (price bins) of the profile. Profile Width (%): Controls the horizontal scale of the profile. Chỉ báocủa LuxAlgo1010 4.8 K
MTF CISD Trade System + Alerts🔹 Introduction This indicator, MTF CISD Trade System + Alerts, identifies high-probability trade entries by detecting Change in State of Delivery (CISD) events across up to six user-defined timeframes simultaneously, and only triggering an entry signal when every enabled timeframe agrees on directional bias — confirmed by a matching CISD on the chart's own timeframe. The core idea is this: when the market's delivery mechanism — the way price is being distributed or accumulated by institutional participants — shifts in the same direction across multiple timeframes at once, that convergence is meaningful. A single timeframe CISD is noise. Six timeframes aligning and then confirming on your entry timeframe is a structurally significant event. No model of institutional order flow or delivery state is perfect. CISD is a proxy — a price-action-based inference about intent, not direct visibility into the order book. I'll address this limitation honestly throughout. 🔹 The Premise 🔸 What is "Delivery"? Markets don't move randomly. Price is delivered from one level to another by participants with directional intent. When a large participant — a bank, fund, or algorithm with size — wants to accumulate a long position, they need sellers. When they want to distribute, they need buyers. The process of filling that intent leaves observable footprints in price structure. Delivery state refers to the current directional intent baked into recent price action. Is the market delivering price upward — making higher closes, respecting higher opens, absorbing sell-side resistance? Or is it delivering downward — closing below opens, treating prior bullish structure as supply? The key insight is that delivery doesn't change instantaneously. It tends to persist. A market that has been delivering bullishly for the past several candles is more likely to continue doing so than to suddenly reverse — until it shows you structural evidence of a state change. That evidence is what CISD captures. 🔸 The Mechanics of a CISD Consider a concrete example. Assume price has been in a bearish delivery phase. The most recent non-inside bearish candle closed at $99 with an open of $101. That open — $101 — becomes a bull target: a structural level that, if reclaimed on a close, suggests the market is no longer delivering bearishly. Now assume price trades sideways for a few candles and then a candle closes at $102. The prior close was at $100, meaning price was below $101 going into this candle and has now closed above it. That crossover — price transitioning through the open of a prior bearish candle — is a Bullish CISD. Why does the open matter and not, say, the high or the body midpoint? Because the open of a directional candle represents where price started before commitment was expressed. Reclaiming it suggests that commitment is being challenged at the source. It's the most structurally defensible level to use without access to actual order book data. The inverse applies for Bearish CISD: the open of the last non-inside bullish candle becomes a bear target, and a close below it — crossing from above — signals a shift toward bearish delivery. Inside candles are excluded. A candle whose high is lower than the prior high and whose low is higher than the prior low is an inside candle — it expresses no directional commitment of its own. Using it to set a target would contaminate the signal with indecision. The indicator skips inside candles entirely when updating targets. 🔸 Why Multiple Timeframes? A single CISD on a 5-minute chart happens dozens of times per session. Most are meaningless. They represent micro-fluctuations in a market that is, at higher timeframes, still clearly trending in the opposite direction. The core challenge in intraday trading is timeframe alignment: you want to be trading with the higher timeframe bias, not against it. A bullish 5-minute CISD during a bearish hourly, daily, and weekly structure is a counter-trend scalp at best, a trap at worst. Lo and MacKinlay (1988) documented that returns at different frequencies are not independent — price structure at higher timeframes significantly conditions the distribution of outcomes at lower timeframes. This is the academic underpinning of what traders know empirically: trade with the higher timeframe, not against it. When the Weekly, Daily, H4, H1, M15, and M5 have all individually confirmed a bullish CISD — meaning delivery has demonstrably shifted to bullish on every relevant timeframe — the probability that a long entry will find follow-through is structurally higher than any single-timeframe setup could provide. Six-timeframe alignment is rare. That rarity is the filter. 🔸 The Confirmation Gate — Why Not Enter Immediately on Alignment? This is a subtle but critical design decision, and one that separates this system from a naive multi-timeframe crossover. When a higher timeframe — say, the hourly — registers its CISD and becomes the final piece needed for full bearish alignment, the current 5-minute candle might already have a bullish CISD baked into it. That candle existed before the alignment completed. It's not a response to bearish alignment — it's a relic of the prior bullish structure. Entering short on that candle would be entering against the very confirmation you're requiring. You'd be using a bullish local signal as a short entry trigger simply because the timing happened to coincide with a higher timeframe shift. The indicator solves this with a pending state. The moment full alignment is achieved, the system arms a directional pending flag and waits. It does not enter. It listens. The entry only fires when the next local CISD — the one that occurs after alignment is confirmed — appears in the correct direction. A bearish pending state requires a new bearish CISD on the chart timeframe. A bullish pending state requires a new bullish CISD. The entry is always a fresh confirmation, never a recycled one. 🔹 How It Works 🔸 CISD Detection Engine The indicator runs an identical CISD detection function on every timeframe, including the local chart timeframe and all six user-selected higher timeframes via request.security. For each timeframe, it maintains two levels: Bull target — the open of the most recent non-inside bearish candle Bear target — the open of the most recent non-inside bullish candle A Bullish CISD fires when the prior close was at or below the bull target and the current close is above it. A Bearish CISD fires when the prior close was at or above the bear target and the current close is below it. State updates — the "Last CISD" label in the table — only occur on confirmed (closed) bars. This prevents the state from flickering during the formation of a live candle. What you see in the table reflects the last completed directional shift, not a mid-bar reading. Small green triangles below bars mark Bullish CISD events on the chart timeframe. Small red triangles above bars mark Bearish CISD events. These are visual anchors showing you where delivery shifts are occurring locally — independently of whether alignment is achieved. 🔸 Multi-Timeframe Alignment Table In the top-right corner, a compact table displays the current CISD state for each of the six configured timeframes. Green (Bullish) — that timeframe's last confirmed CISD was bullish Red (Bearish) — that timeframe's last confirmed CISD was bearish Gray (Neutral) — insufficient history or no CISD has fired yet Full alignment — all enabled timeframes showing the same state — triggers a green or red background on the chart. This background is persistent: it stays active for the entire duration that alignment holds, giving you a continuous visual context for the trade environment. Individual timeframes can be enabled or disabled. Disabling a timeframe removes it from the alignment calculation entirely — it doesn't count for or against alignment. This lets you configure the system for your specific trading style, whether that's a 3-timeframe approach for faster setups or all 6 for maximum confluence. 🔸 Entry Signals Larger triangles — green below the bar for longs, red above the bar for shorts — mark actual entry signals. These only appear when: All enabled timeframes are aligned in the same direction The CISD confirmation gate is armed (alignment was freshly achieved or is ongoing) A new local CISD fires in the matching direction The entry falls within the configured time window and day-of-week filter Entries are taken at the close of the confirmation candle. This is an important assumption: in practice, you would place a limit order at the close price or enter at the open of the next candle. Bar-close entries are the most common convention for CISD-based strategies because the CISD itself is only confirmed on the close. 🔸 Trade Lines and Risk Management When an entry fires, the indicator automatically draws three horizontal lines extending forward in time: Blue (Entry) — the close price at the moment of entry Red dashed (Stop Loss) — the open of the entry candle by default, or the low of the prior candle for longs / high of the prior candle for shorts if the "Use Previous Candle for SL" option is enabled Green dashed (Take Profit) — calculated as Entry + (Risk × RR Ratio) for longs, Entry − (Risk × RR Ratio) for shorts The Risk-Reward Ratio is fully adjustable. The default is 2.0, meaning TP is twice the distance of SL from entry. Increasing this improves the reward per trade but will reduce win rate as price needs to travel further to close the trade as a winner. Decreasing it improves win rate at the cost of expected value per trade — there is a direct tradeoff. The stop loss placement assumption matters significantly. Using the entry candle's open assumes you're targeting the candle where delivery shifted as your invalidation point — if price returns to that open, the CISD failed. Using the prior candle's extreme gives the trade slightly more room but widens risk. Neither is universally superior — it depends on the volatility of the instrument and the timeframe you're trading. Lines extend bar-by-bar until alignment breaks, at which point the trade is considered closed. 🔸 Session and Day-of-Week Filters The entry filter uses America/New_York timezone with automatic DST adjustment. You set a start and end hour/minute in Eastern time, and the indicator computes whether each potential entry candle's close time falls within that window. This matters because CISD setups during illiquid hours — Asian session for US equities, overnight for forex majors during off-hours — tend to produce false alignment from low-volume price drift rather than genuine institutional delivery shifts. Restricting entries to the primary session for your instrument significantly reduces noise. Days of the week are individually toggleable. Sunday and Saturday are off by default. Mondays and Fridays around major economic events are worth monitoring carefully — many traders prefer to disable Friday entries to avoid holding through weekend gaps. 🔸 Performance Statistics Table In the bottom-left, a live stats table tracks: Total Trades — all entry signals that fired within the allowed session Wins — trades where price reached the TP level before alignment broke Losses — trades where price hit the SL level, or alignment broke before either level was reached Win Rate — wins as a percentage of total trades There are limitations here worth stating clearly. The stats count a trade as a loss if alignment breaks before either TP or SL is hit — which is the conservative assumption. In live trading, you might hold the trade past alignment if your personal rules allow it. The stats reflect the mechanical rules of the system as coded, not all possible discretionary interpretations. 🔹 Closing Remarks CISD is one of the more structurally sound price-action concepts available to retail traders because it is anchored to a specific, objectively defined level — the open of a prior directional candle — rather than a subjective pattern or a lagging average. It doesn't predict the future. It identifies where delivery has demonstrably shifted and asks whether the market is confirming that shift across the timeframes that matter to you. This system is not a black box that prints money. Full six-timeframe alignment is rare by design. When it occurs, you are looking at a market that has, at every relevant structural level, shifted its delivery state in the same direction. That's meaningful context — not a guarantee. The most important thing this system can do for your trading is force discipline: you cannot enter unless structure agrees. You cannot enter on a stale signal. You cannot override the session filter in the code. The rules are the rules. Use it as a confluence tool. Study the setups it finds. Understand why some hit TP and others break alignment early. The patterns in that data will teach you more about your instrument than any indicator description can. 🔹 References Market Microstructure & Timeframe Dependency Lo, A. W., & MacKinlay, A. C. (1988). Stock market prices do not follow random walks: Evidence from a simple specification test. Review of Financial Studies, 1(1), 41–66. Easley, D., & O'Hara, M. (1992). Time and the process of security price adjustment. Journal of Finance, 47(2), 577–605. Order Flow and Directional Delivery Hasbrouck, J. (1991). Measuring the information content of stock trades. Journal of Finance, 46(1), 179–207. Glosten, L. R., & Milgrom, P. R. (1985). Bid, ask and transaction prices in a specialist market with heterogeneously informed traders. Journal of Financial Economics, 14(1), 71–100. Multi-Timeframe Analysis Müller, U. A., Dacorogna, M. M., Davé, R. D., Pictet, O. V., Olsen, R. B., & Ward, J. R. (1993). Fractals and intrinsic time — a challenge to econometricians. Olsen & Associates Research Group, Zurich.Chỉ báocủa Resonant_Trader88596
Money Flow Curvature PredictorIntroduction Most traders view oscillators like the Money Flow Index (MFI) as lagging tools—waiting for a zero-line crossover or an overbought/oversold signal before taking action. However, by the time a crossover occurs on a high-timeframe asset like Bitcoin, the "meat" of the move is often already over. The Money Flow Curvature Predictor is designed to solve this lag. It is a sophisticated momentum tool that analyzes the internal acceleration of money flow to identify "Rounding Bottoms" and "Rounding Tops" before they result in a price breakout. The Philosophy: Momentum follows Curvature Price follows momentum, but momentum follows its own curvature. Think of a car coming to a stop: before the car actually stops (the zero-cross), the driver must first let off the gas and apply the brakes (the curvature shift). By measuring the 2nd Derivative (Acceleration) of the Money Flow, we can detect when the "braking" process has begun, allowing us to anticipate a trend reversal bars before the rest of the market sees it. How It Works The script uses a three-layered approach to analyze market energy: The Money Flow Cloud: A high-precision replication of centered money flow (MFI 60), normalized to show the balance of volume-weighted buying and selling pressure. Curvature Engine (The Secret Sauce): Slope (1st Derivative): Measures the current speed of the money flow. Acceleration (2nd Derivative): Measures the rate of change in that speed. When Money Flow is deep in the red but acceleration turns positive, the "curve" is rounding out—a fractal signal of an impending bullish shift. The Confidence Filter: To eliminate the "noise" often found in momentum oscillators, we implemented: Extreme Zone Threshold: Only signals when Money Flow is at exhaustive levels (deep red or high green). Persistence Filter: Requires the curvature to stay consistent for a user-defined duration (Min Rounding Duration) before a High-Confidence dot is plotted. Visual Guide The Cloud: Green indicates net inflow; Red indicates net outflow. Small Circles: Initial detection of a rounding pattern. These are "early warnings." Large Solid Circles: High-Confidence signals. These occur when the rounding is sustained and happening at extreme exhaustive levels. Momentum Columns: The "leading edge" of the wave. When these columns flip color while the cloud is still at an extreme, a reversal is imminent. How to Trade with it Early Entry (The Aggressive Approach): Look for the first "Early Warning" dots when the Money Flow is at an extreme low/high. This is often where "Smart Money" begins to accumulate or distribute. Confirmed Entry (The Conservative Approach): Wait for the Large High-Confidence dots to appear. This confirms that the momentum shift isn't just a flicker, but a sustained structural change in the flow of money. Divergence Hunting: Use the Momentum Columns to find cases where the Cloud is making a lower low, but the Columns (Slope) are already making higher highs. This is a powerful precursor to "V-Bottom" recoveries. Best For: Assets: Bitcoin, Ethereum, and High-Volatility Equities. Timeframes: Optimized for the 1H, 4H, and Daily charts to capture macro swing shifts. Technical Details Version: Pine Script v6 Calculation Base: Center-Normalized MFI (Money Flow Index) Smoothing: EMA-based signal processing to reduce derivative noise. Final Thoughts: Thank you to lux algo's quant tool. This powerful tool allowed me to create a complex idea i would have never been capable of creating on my own. Within a short period of time my idea turned into a reality fast. Let me know your thoughts and good luck. Chỉ báocủa Uniden20246
Structure Break & Liquidity SweepStructure Break & Liquidity Sweep Structure Break & Liquidity Sweep is a market structure indicator built around real-time swing detection, liquidity sweep identification, and structure-based confirmation tools. This version is based on the open-source Smart Money Concepts framework originally published by LuxAlgo, with additional modifications and visual extensions focused on swing labeling, sweep visualization, directional signaling, and chart readability. Overview The indicator combines several structure-analysis modules into one script: internal market structure swing market structure liquidity sweep detection swing point visualization order blocks equal highs and equal lows fair value gaps premium / discount zones previous day / week / month levels optional LONG / SHORT confirmation signals The goal of the script is not to predict the market, but to help traders organize price action using objective structural references. Core logic The script tracks two structure layers: 1. Internal structure This layer reacts faster and highlights shorter-term BOS / CHoCH behavior. 2. Swing structure This layer is slower and reflects broader structural pivots and higher-level directional shifts. The script also detects swing highs and swing lows using pivot logic. These points can be displayed visually on the chart and optionally labeled as: SH = Swing High SL = Swing Low On top of that, the script identifies liquidity sweeps when price trades beyond a previously detected swing level and then closes back through it. These events can optionally be marked with white sweep triangles and SW labels. Included tools Structure detection Internal BOS / CHoCH Swing BOS / CHoCH Liquidity tools Swing highs / lows Sweep detection from wick-based or body-based logic Equal highs / lows Price delivery tools Fair value gaps Internal and swing order blocks Premium / discount zones Context tools Daily / weekly / monthly reference levels Optional candle coloring Optional trend background Optional LONG / SHORT signals derived from structure events Signal logic The optional LONG / SHORT markers are based on structure confirmations selected by the user. Signals can be filtered by: source: Internal, Swing, or Both type: BOS, CHoCH, or All optional cooldown between signals These markers are intended as visual structure confirmations, not as standalone trading advice. What is modified in this version Compared with the original LuxAlgo open-source concept, this version adds and/or customizes: dedicated swing-point markers optional SH / SL text labels dedicated sweep markers with optional SW text simplified visual highlighting for swings and sweeps configurable LONG / SHORT confirmation markers background bias display practical chart-focused visual adjustments Attribution This script is a modified derivative of the open-source Smart Money Concepts script originally published by LuxAlgo. The original structural foundation and parts of the concept come from LuxAlgo’s work. All credit for the original base logic belongs to LuxAlgo. This publication presents a modified version with added visual and functional changes. Notes The script is designed for chart analysis and discretionary trading workflows. It can be used on multiple markets and timeframes. Some modules are more useful in trending conditions, while others can help frame liquidity events in consolidations. Users should test settings according to the instrument and timeframe they trade. Disclaimer This script is provided for educational and informational purposes only. It does not constitute financial, investment, or trading advice. Always use your own risk management and independent judgment.Chỉ báocủa andriimelnykovenftw44167
A candle counterCandle Counter A study indicator that allows you to set a starting point on the chart via date input and automatically count the subsequent candles. Main features: Dashed vertical bar positionable via date input Automatic candle numbering (default 13, customizable) Highlight of the candle with the lowest low (red box) Spike detection: red arrow below candles whose low is below the first candle, green arrow above candles whose high is above the first candle All colors, sizes and positions are fully customizable How to use: Add the indicator to the chart Set the start date in the settings Candles are automatically numbered from the selected bar Chỉ báocủa al100k16
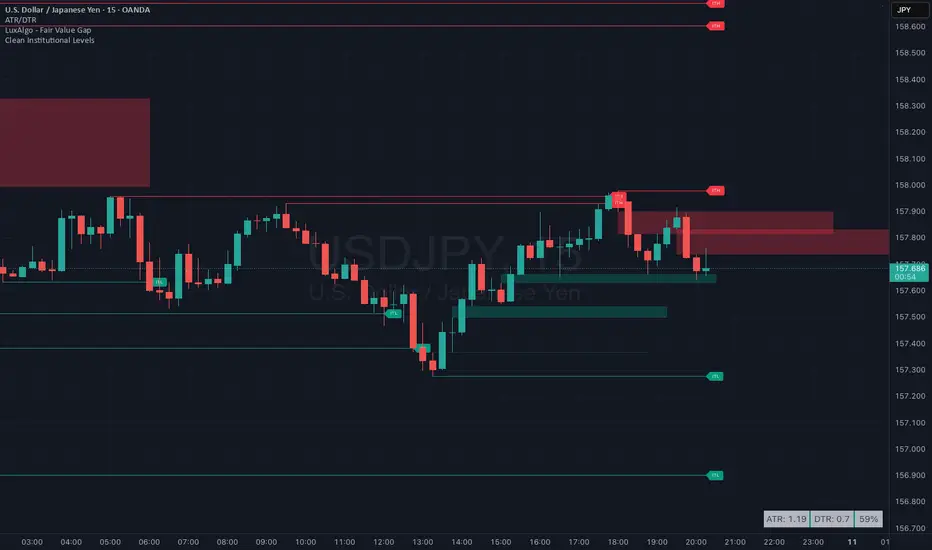
Clean Institutional Levels (ITH/ITL Mitigation)The Clean Institutional Levels indicator is designed for traders who utilize "Intermediate Term Highs" (ITH) and "Intermediate Term Lows" (ITL) to identify key liquidity levels and market structure shifts. Unlike traditional pivot indicators that clutter the chart with boxes or static zones, this script provides a dynamic, real-time tracking system. It projects a precise horizontal line from the moment a structural pivot is confirmed and extends that line indefinitely until it is mitigated (touched) by price action. How it Works The indicator identifies Intermediate pivots using a three-point peak/trough logic: ITH (Intermediate Term High): A pivot high that is flanked by two lower pivot highs. ITL (Intermediate Term Low): A pivot low that is flanked by two higher pivot lows. Once an ITH or ITL is identified, the script draws a thin, professional level from the pivot point to the current bar. The "Mitigation Engine" monitors every price tick; as soon as price crosses the level, the line is "frozen" at that exact bar, providing a clear historical record of where liquidity was swept or the level was tested. Key Features Real-Time Extension: Lines automatically stretch to the right as new candles form until they are hit. Automatic Truncation: Lines stop precisely at the candle of mitigation, showing you exactly when a level became "invalid" or was run. Customizable Strength: Adjust the "Pivot Strength" (Left/Right bars) to filter between minor structural points and major institutional swings. Clean Settings UI: No redundant options. Control line colors, widths, and label visibility with ease. How to Use : Liquidity Targets: Use unmitigated lines as "magnets" for price. Market Structure: Watch for the mitigation of an ITH as a potential sign of bullish intent, or an ITL for bearish intent. Entry Refinement: Use these levels to find precise "Fair Value" areas where price is likely to react after a sweep.Chỉ báocủa ancorman1192
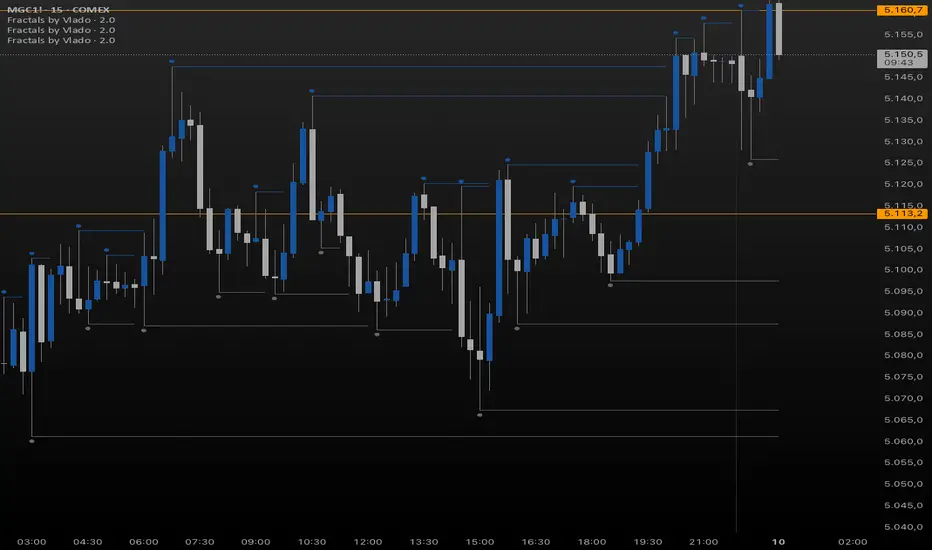
Fractals by VladoAdvanced fractal indicator with persistent horizontal lines. Lines automatically extend until broken by price. Customizable colors and styles. Perfect for identifying support/resistance levels.Chỉ báocủa vladimir_eisenbarth36
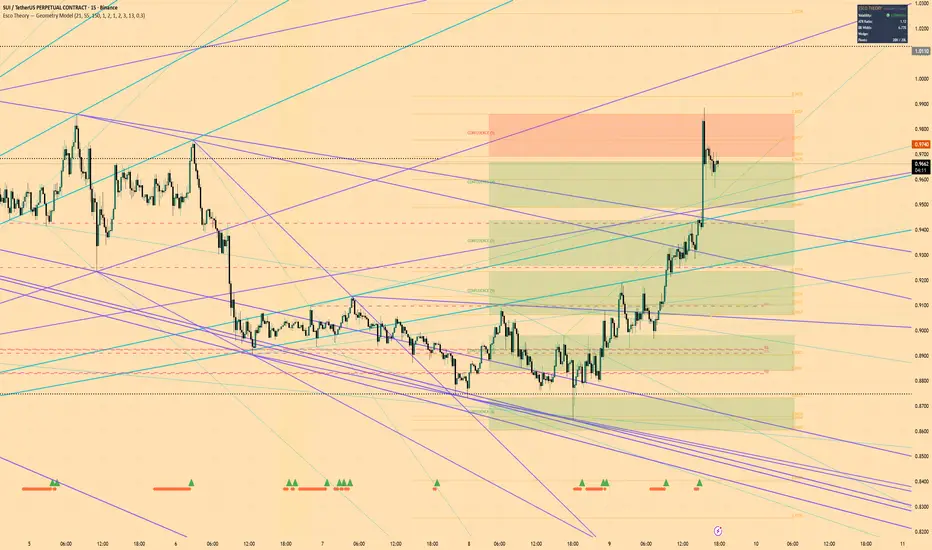
Complex Esco TheoryWHAT IS ESCO THEORY? Esco Theory is a discretionary trading framework built on the belief that markets are liquidity-seeking systems governed by geometric structure, compression-expansion cycles, and pattern repetition across timeframes. This indicator automates the geometric mapping component of the framework — the network of diagonal rails, horizontal levels, and confluence zones that identify where the market is most likely to produce significant reactions. The framework was developed for cryptocurrency perpetual futures (primarily BTC) but works on any liquid market. ━━━━━━━━━━━━━━━━━━━━━━━━━━━━━━━ WHAT THIS INDICATOR DOES 🔷 GEOMETRIC RAILS Automatically detects pivot highs and lows at two significance levels (standard and major cycle) and constructs a network of diagonal trendlines connecting them: • Standard diagonal rails connecting consecutive swing highs and swing lows • Cross-connect rails linking swing highs to swing lows for opposing structural lines • Major cycle rails connecting the most significant pivots on the chart • Fan structure from the cycle bottom (lowest major low) radiating upward through each major high — replicating the ascending rail fan used in Esco's macro analysis • Descending fan from the cycle top (highest major high) through each major low The result is a layered geometric grid where intersections of multiple rails identify high-probability reaction zones. 🟧 HORIZONTAL LEVELS Plots horizontal support and resistance at every detected major pivot price with optional price labels. Standard swing pivots are shown as more subtle dotted horizontals. These represent the structural levels where liquidity accumulates and where the market has historically reacted. 🟢🔴 CONFLUENCE ZONES Scans all detected price levels (major pivots + standard swing pivots) and identifies clusters where 3 or more levels fall within a configurable percentage range. These clusters are highlighted as shaded boxes: • Green zones = confluence below current price (potential support) • Red zones = confluence above current price (potential resistance) Confluence zones are the highest-conviction areas in the framework — where multiple independent structural reasons converge to suggest a significant market reaction. 🟡 COMPRESSION DETECTION Identifies periods of volatility compression using three methods: • ATR Ratio (fast ATR / slow ATR) — when the ratio drops below 0.6, the market is compressing • Bollinger Band Squeeze — when Bollinger Bands contract inside Keltner Channels, a squeeze is active • Wedge Detection — when recent pivot highs are making lower highs AND recent pivot lows are making higher lows, a converging wedge structure is forming Visual signals: • Yellow background shading during compression phases • Orange diamonds at the bottom of the chart during active squeezes • Green triangle when the squeeze fires (expansion begins) • Dashed yellow wedge lines showing the converging structure 🩷 LIQUIDITY LEVELS (Equal Highs & Equal Lows) Detects instances where two or more swing points form at nearly identical price levels. These "equal highs" (EQH) and "equal lows" (EQL) represent concentrated pools of resting stop-loss orders — the liquidity targets that price is drawn toward. Marked with pink dashed lines. 📊 INFO PANEL Real-time status table in the top-right corner showing: • Current volatility state (SQUEEZE / COMPRESSING / EXPANDING) • ATR Ratio value • Bollinger Band Width percentage • Wedge status (active or inactive) • Detected pivot counts ━━━━━━━━━━━━━━━━━━━━━━━━━━━━━━━ HOW TO USE IT 1. IDENTIFY THE ZONE — Look for areas where multiple geometric rails intersect AND a confluence zone box appears. These are the framework's highest-probability reaction areas. 2. WAIT FOR COMPRESSION — When price reaches a high-confluence zone and the indicator shows compression (yellow background, squeeze diamonds, or visible wedge), a significant move is building. 3. WATCH FOR THE TRIGGER — The squeeze fire signal (green triangle) indicates the compression is releasing. Combined with a confluence zone, this is the framework's primary trade signal. 4. MAP YOUR TARGETS — Use the horizontal levels and liquidity markers (EQH/EQL) above and below the current price as structural targets. Price moves between liquidity pools. 5. USE MULTIPLE TIMEFRAMES — Apply the indicator on weekly/daily for macro structure and 4H/1H for tactical setups. When the same confluence zone appears across timeframes, conviction is highest. ━━━━━━━━━━━━━━━━━━━━━━━━━━━━━━━ KEY SETTINGS Swing Detection • Pivot Lookback Length (default 21) — Controls sensitivity for standard pivots. Lower = more pivots, noisier. Higher = fewer, more significant pivots. • Major Pivot Lookback (default 55) — Controls the major cycle pivot detection. Increase for higher timeframes. Geometric Rails • Rail Extension — How far into the future rails project (in bars) • Colors and widths for standard vs major rails • Toggle dashed lines for minor rails to reduce visual clutter Confluence Detection • Confluence Threshold % — How close levels must be to cluster (default 2%). Tighten for precision, widen for more zones. • Min Levels for Confluence — Minimum number of levels in a cluster (default 3). Increase for higher-conviction zones only. Compression • Compression Pivot Length — Controls the wedge detection sensitivity • Background shading toggle Liquidity • Equal High/Low Threshold % — How close swing points must be to count as "equal" (default 0.3%) ━━━━━━━━━━━━━━━━━━━━━━━━━━━━━━━ RECOMMENDED SETUPS BY TIMEFRAME Weekly/Monthly — Set Major Pivot Lookback to 80-100. Focus on the fan structure and horizontal levels for macro cycle mapping. Daily/4-Hour — Default settings work well. Primary timeframe for identifying ECB (Esco Compression Breakout) setups at confluence zones. 1-Hour/15-Min — Reduce Pivot Lookback to 13-15 and Major Pivot to 34-40. Focus on compression detection and liquidity levels for execution timing. ━━━━━━━━━━━━━━━━━━━━━━━━━━━━━━━ BASED ON ESCO THEORY This indicator is one component of the broader Esco Theory framework, which also includes: • The Compression → Expansion Cycle (5-phase model) • The Esco Compression Breakout (ECB) strategy • Multi-Timeframe Confluence analysis • R-Unit risk management system • Liquidity targeting methodology The indicator automates the geometric and structural detection. Trade decisions, directional bias, and risk management remain discretionary — as intended by the framework. ━━━━━━━━━━━━━━━━━━━━━━━━━━━━━━━ DISCLAIMER This indicator is an analytical tool, not financial advice. It does not generate buy/sell signals. All trading involves risk. Use proper risk management and trade only with capital you can afford to lose.Chỉ báocủa escobrypto5539
Smart Daily Levels Pro (PDH/PDL) + FractalsSmart Daily Levels Pro (PDH/PDL) + Fractals is a professional-grade technical analysis tool designed to automatically plot key liquidity levels and market structure. This indicator is a perfect fit for traders utilizing Smart Money Concepts (SMC), Price Action, or intraday breakout strategies. Key Features: - Historical PDH/PDL Levels: Automatically draws Previous Day Highs and Lows. You can customize the lookback period (up to 20 days). - Smart Line Termination: Level lines extend precisely until they are touched or crossed by the price, clearly showing where liquidity has been swept. - Visual Touch Markers: Clean circles appear at the exact bar where the price first hits a level, allowing for instant analysis of price reaction. - Integrated Fractals: Built-in fractal detection (3 or 5-bar) to identify local pivot points, featuring visual offsets to keep your charts clutter-free. - Day Separators: Subtle vertical lines to provide a clear visual boundary between trading sessions. - Full Customization: Total control over colors, line styles (solid, dashed, dotted), and transparency to match any chart theme. Описание (Russian) Smart Daily Levels Pro (PDH/PDL) + Fractals — это профессиональный инструмент для технического анализа, который автоматически отрисовывает ключевые уровни ликвидности и структуру рынка. Индикатор идеально подходит для трейдеров, работающих по стратегиям Smart Money (SMC), Price Action или внутридневным пробоям. Основные возможности: - Исторические уровни PDH/PDL: Автоматическое построение максимумов (High) и минимумов (Low) предыдущих дней. Вы сами выбираете глубину истории (до 20 дней). - Умная остановка линий: Линия уровня тянется ровно до того момента, пока цена не коснется её. Это позволяет наглядно видеть снятую ликвидность. - Визуальные маркеры касаний: В местах первого касания уровня (пробоя) появляются аккуратные круги, что помогает быстро анализировать реакцию цены. - Настраиваемые Фракталы: Встроенная система фракталов (3 или 5 баров) для определения локальных разворотных точек с визуальным смещением для чистоты графика. - Разделители дней: Тонкие вертикальные линии для четкого визуального отделения одной торговой сессии от другой. - Гибкая кастомизация: Полный контроль над цветами, стилями линий (сплошная, пунктир, точки) и прозрачностью.Chỉ báocủa kutsCập nhật 1143
Fractal Retracement [Jamallo](2025) Intro FRAMA is a moving average that adapts its speed based on fractal geometry — specifically, the fractal dimension (D) of recent price action. When price is trending strongly (low fractal dimension), it moves fast. When price is choppy/ranging (high fractal dimension), it slows down. This makes it far more responsive than a standard EMA or SMA. Breakdown: The indicator wraps this with a continuous range logic layer: the filtered line = k only moves if price breaks beyond the FRAMA ± ATR-based range, creating a stepped/ratcheting effect that filters out noise. Two sets of bands are plotted around the filtered line, scaled by ATR multiplied by user-defined multipliers (tight at 0.5×, medium at 1.0×). They're smoothed with a short EMA to reduce jitter, and filled with gradient colors for visual clarity. Direction is simply determined by whether k is rising or falling, and colors everything green (uptrend) or pink/red (downtrend). END In short, it's a noise-filtered trend indicator useful for identifying trend direction, dynamic support/resistance , and gauging how far price has retraced from the trend baseline.Chỉ báocủa Jamallo221155
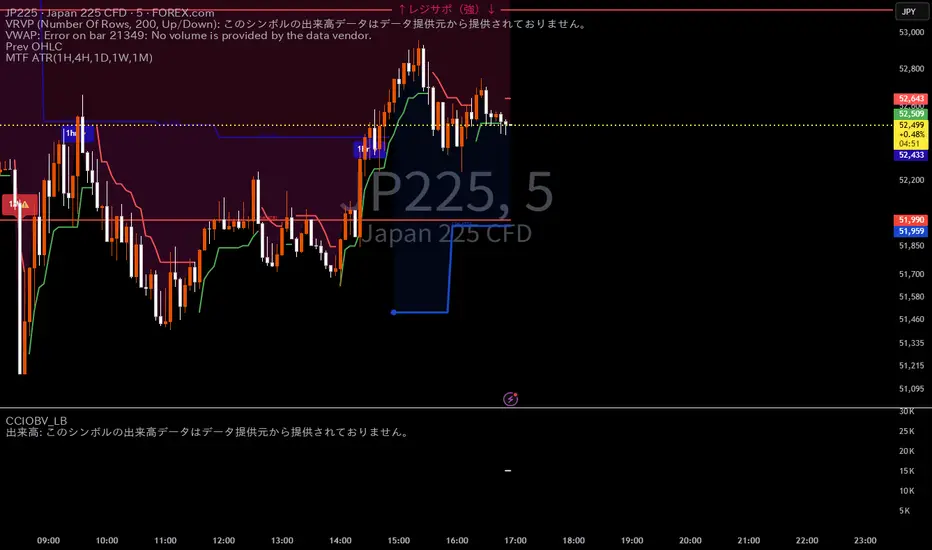
MTF ATR(1H,4H,1D,1W,1M) with ATH and Heat line# MTF ATR (1H, 4H, 1D, 1W, 1M) with ATH and Overheating Line ## Overview A multi-timeframe ATR-based Supertrend indicator that displays trend lines across five timeframes — 1 Hour, 4 Hour, 1 Day, 1 Week, and 1 Month — on a single chart. Designed for swing traders who use ATR (Average True Range) as the core framework for trend-following and risk management. This indicator lets you see the key support/resistance levels across multiple timeframes at a glance, helping you make better decisions about entries, exits, and position sizing without switching between charts. --- ## Key Features ### Multi-Timeframe Supertrend (1H / 4H / 1D / 1W / 1M) Each timeframe calculates its own Supertrend line based on ATR, providing a layered view of trend structure from intraday to macro: - **1H Supertrend** — Short-term trend for timing entries and exits. Color: Blue. - **4H Supertrend** — Medium-term trend bridging intraday and swing timeframes. Color: Purple. - **1D Supertrend** — Primary swing trading trend. Color: Green (up) / Dark Red (down). - **1W Supertrend** — Macro trend filter. Color: Pink. - **1M Supertrend** — The longest-term trend context, useful for identifying secular trend direction and major structural support/resistance. Color: Red. The 1D, 1W, and 1M Supertrend lines are all calculated using confirmed (closed) data from the prior period. This means the line does not move during the current day/week/month — the goalpost stays fixed, giving you a stable reference point for decision-making. ### Overheating Line (v2) A unique profit-taking guide built on top of the daily Supertrend. The Overheating Line marks the level where price has extended significantly beyond the Supertrend — a zone where mean reversion risk increases. **Formula:** `Current Day Realtime Supertrend + (Previous Day Confirmed ATR × Multiplier)` This hybrid design gives you the best of both worlds: - The **starting point** (realtime ST) adapts to gap-ups and intraday price action. - The **threshold** (previous day's ATR × multiplier) is fixed, so the target does not shift as the day progresses. The default multiplier is 1.3× ATR, adjustable in settings. The Overheating Line is hidden on daily and higher timeframes by default (designed for intraday use), but this can be toggled. ### Overheating Touch Signals (Optional, Default: OFF) When enabled, the indicator tracks intraday interaction with the Overheating Line: - 🔥 **Touch Signal** — Price (high) reaches the Overheating Line for the first time that day. - ❄️ **Break Signal** — After touching, price closes back below the Overheating Line (potential reversal confirmation). ### Overheating Status Table A real-time dashboard (top-right corner) displaying: - **ST Deviation Ratio** — Distance from Supertrend measured in ATR multiples. Color-coded: green (safe), orange (approaching), red (overheated). - **Distance to Overheating Line** — Absolute and percentage. - **Overheating Line Value** — Exact price level. - **Base ATR (Previous Day)** — The fixed ATR used for calculation. - **Current Day ST** — Realtime Supertrend value. - **Today's Touch Status** — Whether the line has been touched. - **Post-Touch Tracking** (when touched) — Elapsed time, max drawdown from touch, and whether price has broken back below the line. Hidden on daily+ timeframes by default. ### Warning & Break Signals Available for 1H, 4H, 1D, and 1W timeframes: - **⚠️ Warning** — Price closes below the uptrend Supertrend line (potential trend weakening). - **⚡ Break** — Price closes above the downtrend Supertrend line (potential trend reversal to upside). Signal cooldowns vary by timeframe to avoid noise: | Timeframe | Warning Cooldown | Break Cooldown | Max per Period | Reset | |-----------|-----------------|----------------|----------------|-------| | 1H | 4 hours | 1 hour | Unlimited | — | | 4H | 4 hours | 1 hour | 2 per day | Daily | | 1D | 4 hours | 1 hour | 2 per day | Daily | | 1W | 4 days | 4 days | 2 per week | Weekly | The 1M Supertrend does not generate warning/break signals — it serves purely as a structural trend reference. ### All-Time High (ATH) Finder Automatically detects and draws a horizontal line at the all-time high, extending to the right edge of the chart. Includes a label with the exact ATH value. Useful for breakout targets and overhead resistance identification. --- ## Color Scheme | Timeframe | Up Trend | Down Trend | |-----------|----------|------------| | Current TF | Green | Red | | 1H | Blue (#1848cc) | Dark Blue (#210ba2) | | 4H | Purple (#7b1fa2) | Dark Purple (#4e0f60) | | 1D | Green (#4caf50) | Dark Red (#8c101a) | | 1W | Pink (#f06292) | Dark Pink (#c2185b) | | 1M | Red (#f44336) | Dark Red (#b71c1c) | | Overheating | Orange (#ff9800) | — | | ATH | Lime | — | --- ## Timeframe Visibility By default, 1H and 4H Supertrends (along with their signals and labels) are hidden when viewing daily or higher timeframes to reduce clutter. The 1D, 1W, and 1M Supertrends are always visible regardless of chart timeframe. This behavior can be changed in settings. --- ## Master Controls Four master toggles to quickly show/hide elements across all timeframes: - **Master Highlighter** — Background shading between price and Supertrend. - **Master Signals** — All warning/break signal labels. - **Master Up Trend** — All uptrend lines and trend-change circles. - **Master Down Trend** — All downtrend lines and trend-change circles. --- ## Settings Per Timeframe Each timeframe has independent settings: | Setting | Current TF | 1H | 4H | 1D | 1W | 1M | |---------|:---:|:---:|:---:|:---:|:---:|:---:| | ATR Period | ✓ | ✓ | ✓ | ✓ | ✓ | ✓ | | ATR Multiplier | ✓ | ✓ | ✓ | ✓ | ✓ | ✓ | | ATR Method | ✓ | ✓ | ✓ | ✓ | ✓ | ✓ | | Show/Hide | — | ✓ | ✓ | ✓ | ✓ | ✓ | | Labels | — | ✓ | ✓ | ✓ | ✓ | ✓ | | Warning/Break | — | ✓ | ✓ | ✓ | ✓ | — | | Highlighter | — | ✓ | ✓ | ✓ | ✓ | — | Default ATR Period is 10 and Multiplier is 1.0 for all timeframes. --- ## Alerts | Alert | Description | |-------|-------------| | Buy / Sell | Current timeframe trend change | | 1H / 4H / 1D / 1W Warning | Price breaks below uptrend Supertrend | | 1H / 4H / 1D / 1W Break | Price breaks above downtrend Supertrend | | 1W / 1M Trend Change | Weekly or monthly trend direction change (up/down) | | Overheating Touch | Price reaches the Overheating Line | | Overheating Break | Price falls back below the Overheating Line after touch | --- ## Recommended Usage 1. **Trend Alignment** — Look for trades where 1D, 1W, and 1M trends are all aligned (all in uptrend). The more timeframes aligned, the higher the conviction. 2. **Structural Context with 1M** — The monthly Supertrend acts as the "line in the sand" for secular trend direction. When price is above the 1M line and the 1M trend is up, the broader environment favors long positions. 3. **Profit Taking** — Monitor the Overheating Line and ST Deviation Ratio. When the ratio approaches or exceeds the multiplier (default 1.3×), consider scaling out or tightening stops. 4. **Stop Loss Reference** — The 1D Supertrend provides a natural swing stop level. The 4H or 1H lines can serve as trailing stops for more aggressive management. The 1W and 1M lines serve as wider structural stops for position trades. 5. **Warning as Early Alert** — A ⚠️ warning does not mean the trend is over, but it flags that price has temporarily dipped below the Supertrend — a signal to watch closely rather than panic. --- ## Technical Notes - The 1D, 1W, and 1M Supertrends use previous-period confirmed data (`lookahead_off`), ensuring lines do not repaint or shift during the current period. - The Overheating Line's realtime component uses `lookahead_on` intentionally to reflect intraday price action for the starting point, while keeping the ATR threshold fixed from the prior day. - This indicator is an overlay and works on any instrument and timeframe. It is primarily designed for use on 5-minute to 1-hour charts for Japanese and US equities. - Due to TradingView's 64-plot limit, EMA overlays and background highlighters for the current timeframe and monthly timeframe are not included. The 1M Supertrend displays trend lines and labels only (no highlighter or warning/break signals).Chỉ báocủa ogudora0812Cập nhật 11
Previous Day Levels + Extentionhelp in predefined levels from yesterday low to Yesterday high and beyond. Also has pre defined Yesterday close mark and Friday close mark with PDh & PDL.Chỉ báocủa Force11Force14
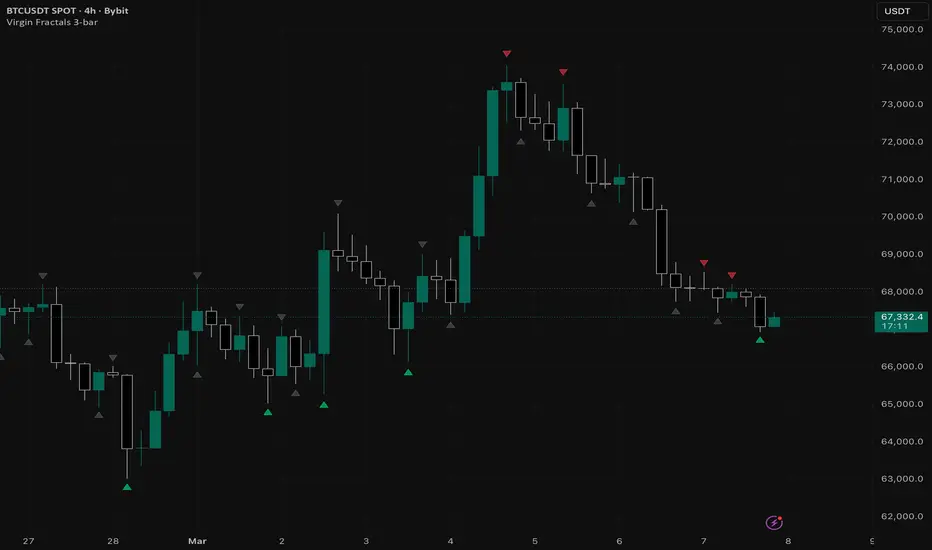
Virgin Liquidity Fractals (3-bar)This indicator highlights virgin 3-bar fractals — untouched liquidity levels where stops tend to accumulate — and automatically turns them gray once the market sweeps them, giving you an instant visual map of where liquidity has been taken or still remains. By clearly exposing resting liquidity and recent stop hunts, it helps traders anticipate high-probability reversals, traps, and breakout continuation zones.Chỉ báocủa kostya-samoylov60
MTF ATR(1H,4H,1D,1W) with ATH and Heat line# MTF ATR (1H, 4H, 1D, 1W) with ATH and Overheating Line ## Overview A multi-timeframe ATR-based Supertrend indicator that displays trend lines across four timeframes — 1 Hour, 4 Hour, 1 Day, and 1 Week — on a single chart. Designed for swing traders who use ATR (Average True Range) as the core framework for trend-following and risk management. This indicator helps you instantly see where the key support/resistance levels are across multiple timeframes, so you can make better decisions about entries, exits, and position sizing without switching between charts. ## Key Features ### Multi-Timeframe Supertrend (1H / 4H / 1D / 1W) Each timeframe calculates its own Supertrend line based on ATR, providing a layered view of trend structure: - **1H Supertrend** — Short-term trend, useful for timing entries and exits on intraday charts. Color: Blue. - **4H Supertrend** — Medium-term trend, bridges intraday and swing timeframes. Color: Purple. - **1D Supertrend** — Primary swing trading trend. Uses previous day's confirmed data so the line does not shift intraday. Color: Green (up) / Dark Red (down). - **1W Supertrend** — Macro trend filter. Uses previous week's confirmed data so the line remains fixed throughout the week. Color: Pink. The 1D and 1W Supertrend lines are calculated using confirmed (closed) data from the prior period. This means the line does not move during the current day/week — the goalpost stays fixed, giving you a stable reference point for decision-making. ### Overheating Line (v2) A unique profit-taking guide built on top of the daily Supertrend. The Overheating Line marks the level where price has extended significantly beyond the Supertrend — a zone where mean reversion risk increases. **Formula:** `Current Day Realtime Supertrend + (Previous Day Confirmed ATR × Multiplier)` This hybrid design gives you the best of both worlds: - The **starting point** (realtime ST) adapts to gap-ups and intraday price action. - The **threshold** (previous day's ATR × multiplier) is fixed, so the target does not shift as the day progresses. The default multiplier is 1.3× ATR, adjustable in settings. The Overheating Line is hidden on daily and higher timeframes by default (designed for intraday chart use), but this can be toggled in settings. ### Overheating Touch Signals (Optional, Default: OFF) When enabled, the indicator tracks intraday interaction with the Overheating Line: - 🔥 **Touch Signal** — Price (high) reaches the Overheating Line for the first time that day. - ❄️ **Break Signal** — After touching, price closes back below the Overheating Line (potential reversal confirmation). ### Overheating Status Table A real-time dashboard (top-right corner) showing: - **ST Deviation Ratio** — How far price has traveled from the Supertrend, measured in ATR multiples. Color-coded: green (safe), orange (approaching), red (overheated). - **Distance to Overheating Line** — Absolute price distance and percentage. - **Overheating Line Value** — The exact price level. - **Base ATR (Previous Day)** — The fixed ATR value used for calculation. - **Current Day ST** — The realtime Supertrend value. - **Today's Touch Status** — Whether the Overheating Line has been touched today. - **Post-Touch Tracking** (if touched) — Time elapsed since touch, maximum drawdown from touch price, and whether price has broken back below the line. The table is hidden on daily and higher timeframes by default. ### Warning & Break Signals Each timeframe (1H, 4H, 1D, 1W) generates two types of signals: - **⚠️ Warning** — Price closes below the uptrend Supertrend line (potential trend weakening). - **⚡ Break** — Price closes above the downtrend Supertrend line (potential trend reversal to upside). Signals are throttled to avoid noise: minimum 4-hour cooldown for warnings, 1-hour for breaks, with a maximum of 2 signals per period (daily reset for 4H/1D, weekly reset for 1W). ### All-Time High (ATH) Finder Automatically detects and draws a horizontal line at the all-time high price, extending to the right edge of the chart. Includes a label showing the exact ATH value. Useful for identifying breakout targets and overhead resistance. ### EMA Overlay (Optional) Toggle EMA 20 / 50 / 200 on the chart for additional trend context. Default: OFF. ## Color Scheme | Timeframe | Up Trend | Down Trend | |-----------|----------|------------| | Current TF | Green | Red | | 1H | Blue (#1848cc) | Dark Blue (#210ba2) | | 4H | Purple (#7b1fa2) | Dark Purple (#4e0f60) | | 1D | Green (#4caf50) | Dark Red (#8c101a) | | 1W | Pink (#f06292) | Dark Pink (#c2185b) | | Overheating | Orange (#ff9800) | — | | ATH | Lime | — | ## Timeframe Visibility By default, the 1H and 4H Supertrends (along with their signals and labels) are hidden when viewing daily or higher timeframes to keep the chart clean. The 1D and 1W Supertrends are always visible regardless of chart timeframe. This behavior can be changed in the "Timeframe Control" settings. ## Master Controls Four master toggles let you quickly show/hide elements across all timeframes at once: - **Master Highlighter** — Background shading between price and Supertrend. - **Master Signals** — All warning/break signal labels. - **Master Up Trend** — All uptrend lines and trend-change circles. - **Master Down Trend** — All downtrend lines and trend-change circles. ## Settings Per Timeframe Each timeframe (Current TF, 1H, 4H, 1D, 1W) has independent settings: - ATR Period (default: 10) - ATR Multiplier (default: 1.0) - ATR Calculation Method (SMA of TR vs. RMA/Wilder) - Show/Hide toggle - Label display - Warning/Break signals (1H, 4H, 1D, 1W) - Highlighter fill ## Alerts The following alert conditions are available: - Buy/Sell (current timeframe trend change) - 1H / 4H / 1D / 1W Warning (price breaks below uptrend ST) - 1H / 4H / 1D / 1W Break (price breaks above downtrend ST) - 1W Trend Change (up/down) - Overheating Touch (price reaches the Overheating Line) - Overheating Break (price falls back below the Overheating Line after touch) ## Recommended Usage 1. **Trend Alignment** — Look for trades where 1D and 1W trends are aligned (both in uptrend). Use 1H and 4H for entry timing. 2. **Profit Taking** — Monitor the Overheating Line and ST Deviation Ratio. When the ratio approaches or exceeds the multiplier (default 1.3×), consider scaling out or tightening stops. 3. **Stop Loss Reference** — The 1D Supertrend provides a natural swing stop level. The 4H or 1H lines can serve as trailing stops for more aggressive management. 4. **Warning as Early Alert** — A 1D ⚠️ warning does not mean the trend is over, but it flags that price has temporarily dipped below the Supertrend — a signal to watch closely rather than panic. ## Notes - The 1D and 1W Supertrends use previous-period confirmed data (`lookahead_off`), ensuring the line does not repaint or shift during the current period. - The Overheating Line's realtime component uses `lookahead_on` intentionally, as it needs to reflect intraday price action for the starting point while keeping the ATR threshold fixed. - This indicator is an overlay and works on any instrument and timeframe, though it is primarily designed for use on 5-minute to 1-hour charts for Japanese and US equities.Chỉ báocủa ogudora0812Cập nhật 37
Fibonacci Rainbow Bollinger BandsBollinger bands with fibonacci levels as a rainbow background on the price chart.Chỉ báocủa NotoriousPyro23
Liquidities (Pivot Levels)Liquidities — Indicator Guide Overlay: Yes (liquidity lines, HTF levels, and sweep markers drawn directly on the price chart) What Is This Indicator? WO Liquidities with HTF is a liquidity mapping tool that combines two distinct layers of analysis on a single chart. The first layer automatically detects internal liquidity pools — the highs and lows formed by recent price pivots — and tracks whether they have been swept or are still intact. The second layer draws the most significant higher timeframe reference levels: Previous Day High/Low, Previous Week High/Low, Previous Month High/Low, Weekly Open, and Daily Opening price. Together these two layers give you a complete picture of where liquidity sits on both a micro and macro level, without needing to switch between charts or load multiple separate indicators. Layer 1 — Internal Liquidity (Pivot Levels) Internal liquidity levels are identified using pivot highs and pivot lows based on the selected lookback period. These represent areas where stop orders from retail traders accumulate — above swing highs and below swing lows — making them natural targets for institutional price delivery. How Lines Behave When a new pivot high is confirmed, a purple line is drawn extending to the right. The line continues extending forward as long as the level has not been touched. This signals that the liquidity above that high is still intact and available to be swept. When price crosses above the pivot high, the level is considered swept. The line immediately changes to a dotted gray style and stops extending — it becomes a historical record of a consumed liquidity level. If the Sweep Markers option is enabled, a large × symbol appears directly at the sweep point in the original line color, clearly marking the exact bar where the level was taken out. The same logic applies symmetrically for pivot lows, with a teal/cyan color indicating unswept low liquidity. What This Tells You An unswept pivot high above current price is a draw on liquidity — price may be magnetically pulled toward it before reversing. An unswept pivot low below current price serves the same function on the downside. When a level gets swept and the × marker appears, it signals that the liquidity hunt has occurred and a reversal becomes more probable from that point. Layer 2 — Higher Timeframe Key Levels Six optional HTF reference levels can be displayed, each drawn as a horizontal line starting from the exact bar where that high or low was formed and extending to the right with a labeled price tag. PDH — Previous Day High is drawn as a solid orange line. This is the most active intraday reference level and is frequently targeted during the early hours of a new session. PDL — Previous Day Low is drawn as a dashed orange line. The dashed style distinguishes lows from highs visually at a glance. PWH — Previous Week High is drawn as a solid red line with width 2. Weekly levels represent major institutional reference points and often act as significant resistance zones. PWL — Previous Week Low is drawn as a dashed red line with width 2. PMH — Previous Month High is drawn as a solid green line with width 3. Monthly levels are the widest macro reference levels on the chart and are relevant primarily for swing and position traders. PML — Previous Month Low is drawn as a dashed green line with width 3. WO — Weekly Open is drawn as a solid white line marking the price at which the current week opened. This level is commonly used as a bias reference — price above WO suggests a bullish weekly bias and price below suggests bearish. OD — Opening Day is drawn as a solid teal line marking today's daily open price. This is a key mean-reversion reference — price frequently returns to the daily open before continuing in the session's direction. All HTF lines are anchored to the exact timestamp where the high or low occurred on the chart, not just drawn from the current bar, giving you accurate visual context for how far price has traveled from those levels. Settings Reference Liquidity Settings Pivot Lookback (default: 15) — the number of bars to the left and right used to confirm a pivot high or low. A higher value means only more significant, wider pivots are detected and labeled as liquidity levels. A lower value creates more frequent but shallower levels. For higher timeframes like 4H or Daily, consider increasing this to 20–30. For scalping on 1-minute or 5-minute charts, values of 5–10 work better. Levels Visibility Each of the six HTF levels has its own toggle. Show Daily Levels and Show Weekly Levels are on by default. Show Monthly Levels, Weekly Open, and Opening Day are off by default and can be enabled individually as needed. Design Internal High Liquidity Color (default: purple) — color of unswept pivot high lines and their sweep markers. Internal Low Liquidity Color (default: teal) — color of unswept pivot low lines and their sweep markers. Broken Level Color (default: muted gray) — color of dotted lines after a level has been swept. Show Sweep Markers (×) — toggles the large × symbols that appear at the exact point where a liquidity level is taken out. Recommended to keep on as it makes swept levels immediately obvious. The HTF level colors (Daily, Weekly, Monthly, Weekly Open, Opening Day) are each independently adjustable. How to Use It — Trading Workflow Step 1 — Identify unswept liquidity pools. Scan the chart for active purple and teal lines that have not yet been touched. These represent live liquidity targets. Price has a structural tendency to move toward these levels before reversing, especially when they align with HTF reference levels. Step 2 — Check HTF levels for confluence. Look at whether the nearest unswept internal liquidity sits near a PDH, PWH, or other HTF level. When an internal pivot high coincides with the Previous Week High or Previous Day High, that area becomes a high-priority liquidity zone — the probability of price being drawn there and then reversing is significantly higher. Step 3 — Watch for the sweep. When price approaches an unswept level, monitor for a wick violation followed by a close back below (for highs) or above (for lows). The × marker will appear automatically when the sweep is confirmed. This is the signal that liquidity has been consumed and a reversal is possible. Step 4 — Trade the reaction. After the × appears, look for a confirmation entry in the opposite direction. For a swept high, look for a bearish close, a break of recent structure, or a rejection candle to enter short. For a swept low, look for the bullish equivalent. The next unswept level in the opposite direction becomes the natural target. Step 5 — Use HTF levels as targets and stops. When managing an open trade, use the HTF lines as take profit targets (trade toward the nearest PDH, PWH etc.) and as stop references (if price reclaims above a swept level, the setup is invalidated). Tips The most reliable sweeps are those that occur during high-liquidity session windows — London open and New York open. A sweep of PDH or PDL during these windows with a quick rejection is one of the cleanest setups in price action trading. The Weekly Open level is particularly useful as a bias filter. If price is above WO and sweeps a pivot low during the week, the bullish weekly bias makes the long setup significantly higher probability. Conversely, a sweep of a pivot high while below WO is a strong bearish setup. Running the indicator on a 15-minute chart with the Pivot Lookback set to 10–15 gives an excellent balance between signal frequency and level significance for intraday trading. Limitations Only the most recent pivot high and pivot low are tracked as active internal liquidity levels at any given time — the indicator does not store and display a full history of all unswept pivots simultaneously. HTF levels update at the start of each new Daily, Weekly, or Monthly candle and reflect only the single most recent completed period. Lines are redrawn on the last bar only, which is standard behavior for time-anchored line rendering in Pine Script.Chỉ báocủa trading_fl0w76
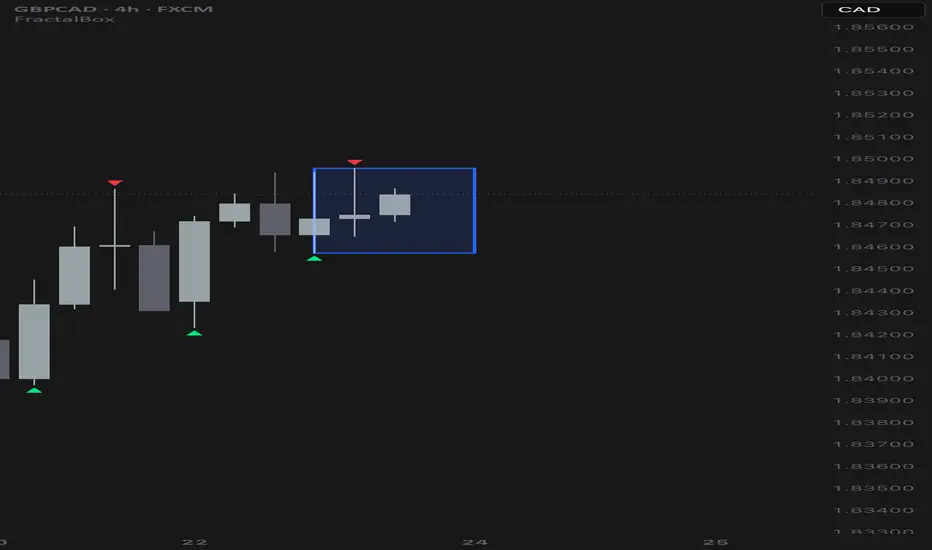
AuctionEnjoyer's 3CFAuctionEnjoyer's 3CF. Fractals AuctionEnjoyer's 3CF. Fractals AuctionEnjoyer's 3CF. Fractals AuctionEnjoyer's 3CF. Fractals AuctionEnjoyer's 3CF. Fractals AuctionEnjoyer's 3CF. Fractals Chỉ báocủa stripathi917
First H4 Candle of WeekThis indicator highlights the first H4 candle of each trading week. When a new week begins, it marks the opening H4 candle directly on the chart and optionally changes its background color for clear visual identification. It is designed to help traders easily track weekly opening momentum and breakout levelsChỉ báocủa Phuphiemzz13
HTF Previous Candle High/LowHTF Previous Candle High/Low is a multi‑timeframe support‑and‑resistance tool designed for traders who rely on higher‑timeframe structure while executing on lower timeframes. The indicator automatically plots the previous candle’s high and low from any selected higher timeframe (HTF), such as 15m, 30m, 1h, 4h, or any custom timeframe supported by TradingView. The levels update automatically at the moment a new HTF candle opens, ensuring the lines always reflect the most recent completed candle. Unlike traditional horizontal rays that extend across the entire chart, this tool allows you to define a custom line length (in minutes) so the levels only extend as far as you want—ideal for scalpers and intraday traders who prefer clean charts. Key Features HTF Selection: Choose any timeframe (15m, 30m, 1h, 4h, etc.) to pull the previous candle’s high and low. Auto‑Updating Lines: The indicator updates the same lines every time a new HTF candle forms—no clutter, no line duplication. Custom Line Length: Define how far the lines extend (in minutes), instead of using full‑screen rays. Color & Width Customization: Independently set the color, transparency, and width for both high and low lines. Timeframe Visibility Control: Choose whether the levels appear on all timeframes, only lower timeframes, only higher timeframes, or only the same timeframe. Clean & Lightweight: Uses minimal resources and avoids unnecessary objects on the chart. Use Cases Intraday traders marking key HTF levels while trading on 1m/5m charts. Scalpers who want HTF structure without cluttering the entire chart. Swing traders who want clear visual confirmation of previous candle boundaries. Anyone who uses HTF highs/lows as liquidity zones, breakout levels, or reaction points. This indicator is designed to be simple, efficient, and highly customizable—giving you full control over how HTF levels appear on your chart.Chỉ báocủa elvisnocoin48
Fractal Power of 3 NQ Reversal ZonesA clean, non-repainting Power of 3 (P³) indicator built for NQ futures traders. Inspired by ICT concepts and popularized by certain traders, this tool maps fractal accumulation, manipulation, and distribution zones across three timeframes and fires signals when price sweeps a zone with SMT divergence confirmation. What it does: Plots previous-bar high/low zones from Daily, 4H, and 1H timeframes as shaded boxes with midpoint levels Detects liquidity sweeps — price wicks beyond a Daily zone boundary then closes back inside Confirms reversals with SMT divergence between NQ and ES (pivot present on one but not the other) Fires a signal only when sweep + divergence align — no noise, no clutter Non-repainting by design. All higher-timeframe data uses lookahead_off, referencing only closed bars. Signals print on confirmed conditions only. How to use it: Watch for red ▼ (short) when price sweeps above the Daily high with bearish NQ/ES divergence Watch for green ▲ (long) when price sweeps below the Daily low with bullish NQ/ES divergence Use the multi-timeframe zones as context — nested zones (e.g., 1H inside 4H inside Daily) mark the highest-conviction areas Built-in alerts for both signals Best on 5m–15m charts for MNQ/NQ scalping. Chỉ báocủa Cascade_IndicatorsCập nhật 14