Simple Fractal BoxesFractal Boxes automatically draw dynamic range boxes from fractal to fractal and extend them forward until price breaks out. Helps you visualize structure, key ranges, and potential breakout zones in real time.Chỉ báocủa Obsidian_FX1161
Fractal BoxesFractal Boxes automatically draw dynamic range boxes from fractal to fractal and extend them forward until price breaks out. Helps you visualize structure, key ranges, and potential breakout zones in real time.Chỉ báocủa Obsidian_FX51
Zeussy MacrosThis macro windows are specific to zeussy's teaching of execution macro windows i first made it for my self but noticed that people could use it if i just publish it so here you go for free 🔹 Features • Automatically locked to New York time (America/New_York) • Fully handles Daylight Saving Time (DST) • Pre-coded macro windows including: 2:42 – 3:15 3:42 – 4:15 4:42 – 5:15 5:42 – 6:15 6:42 – 7:15 7:42 – 8:15 8:42 – 9:15 9:42 – 10:15 10:42 – 11:15 12:42 – 13:15 13:42 – 14:15 • Enable or disable each window individually • Individual color customization per window • Optional master color override • Adjustable border width • Border style selection (Solid / Dashed / Dotted) • Customizable time label size and color • Clean centered time labels under each window 🔹 Designed For Traders who use: • Intraday macro timing models • Session-based liquidity concepts • Time-cycle execution strategies • Structured New York open timing • Precision-based discretionary trading 🔹 Why This Indicator Instead of manually marking intraday windows each day, this script automatically: • Draws session-aligned boxes • Tracks session high and low in real-time • Places clean, centered time labels • Keeps the chart visually structured It removes friction from time-based analysis and lets you focus on execution.Chỉ báocủa The_YosRob29
Rejection Blocks [UAlgo]Rejection Blocks is a market structure and supply demand overlay built to detect and manage rejection based zones that form after liquidity sweeps and structure shifts. The script tracks recent swing highs and swing lows, monitors for sweep style rejection candles around those swing levels, and then requires a confirmation break before registering a Rejection Block as an active zone. Each Rejection Block is visualized as an outer zone plus internal buy and sell strength segments that act like a compact sentiment map. The blocks extend forward over time, respond to mitigation and invalidation rules, and can optionally stop extending or be deleted after mitigation. The script also optionally draws structure annotations such as sweep markers and BOS or CHOCH lines to provide context for why a block formed. This indicator is designed as a complete zone lifecycle engine. It focuses on repeatable rule based detection, strict candle shape filtering for rejection quality, and robust object management so you can keep a clean chart while tracking the most relevant zones. 🔹 Features 1) Pivot Based Market Structure Tracking The engine uses pivot highs and pivot lows to identify the most recent swing high and swing low levels. These levels act as the structure references for: Sweep detection Break of structure detection Change of character detection Swing left bars and swing right bars control how strict the swing confirmation is. 2) Rejection Candle Validation with Sweep Logic A candidate Rejection Block begins with a sweep style candle at a swing level: Bullish rejection candle sweeps below the last swing low and closes back above it Bearish rejection candle sweeps above the last swing high and closes back below it Two sweep modes are available: Wick sweep (open and close inside) Any sweep (close inside) Min sweep distance in ticks can be required to avoid tiny micro sweeps. 3) Optional Candle Shape Filter for Quality Control When enabled, the script enforces a strict rejection candle profile using: Minimum wick to body ratio Minimum dominant wick percent of candle range Maximum opposite wick percent of candle range Maximum body percent of candle range This helps filter out candles that technically sweep but do not display rejection characteristics. 4) Close Location Filters Additional close filters can be applied: None Close in favorable half of the candle range Close beyond open This improves selectivity and allows you to tailor the definition of rejection strength. 5) Flexible Rejection Block Zone Models The zone that is stored and drawn for a Rejection Block can be defined in multiple ways: Wick to Body Open to Extreme Full Candle Body This allows alignment with different trading methodologies, from wick based reaction zones to body based execution zones. 6) Confirmation Window and Pending Candidates Rejection candles do not become active zones immediately. They enter a pending list and require confirmation within a defined window. Confirmation is achieved when price breaks the opposite structure level: Bullish candidate confirms when price breaks above the last swing high Bearish candidate confirms when price breaks below the last swing low If confirmation does not occur within the confirm window, the candidate expires. This prevents old sweeps from creating late zones. 7) Strength Segmentation Inside the Block Each active block contains: An outer zone box representing the full block range An inner buy strength box An inner sell strength box A cap line that marks the maximum inner width boundary Strength is estimated at formation time using one of two models: Close location Close plus wick Inner widths scale based on the computed buy and sell strengths, giving a quick visual of where pressure likely dominated inside the rejection candle. 8) Lifecycle Management: Extension, Mitigation, Invalidation, Aging Blocks are actively managed through their lifecycle: Extension Blocks extend to the right as time progresses. Mitigation Blocks can be marked mitigated by touch or by close inside. After mitigation, the block can optionally stop extending or be deleted. Invalidation Blocks can be invalidated by wick or by close beyond the block boundary, with optional deletion on invalidation. Aging Blocks can be removed after a maximum age in bars to keep the chart focused. 9) Structure Annotations: Sweep, BOS, CHOCH When enabled, the script draws contextual structure lines and labels: SW lines indicating swing sweep context BOS lines for continuation breaks CH lines for change of character A maximum line budget is enforced to respect object limits. 10) Robust Object Budgeting and Cleanup The engine enforces limits for: Maximum blocks Maximum pending candidates Maximum structure lines Old objects are deleted in a controlled way to avoid exceeding TradingView limits and to keep the most relevant zones visible. 🔹 Calculations 1) Candle Parts and Rejection Shape Metrics The script breaks each candle into components: Range Body size Upper wick Lower wick It then normalizes values by range and uses them for shape validation: Dominant wick is lower wick for bullish direction and upper wick for bearish direction Opposite wick is the other side Body percent is body divided by range A rejection candle passes shape checks when dominant wick is large enough relative to body, dominant wick percent exceeds a threshold, opposite wick percent stays below a threshold, and body percent stays below a threshold. 2) Sweep Validation Against Structure Level For bullish direction, sweep requires low to trade below the swing level by a tick margin and close to finish back above the level. For bearish direction, sweep requires high to trade above the swing level by a tick margin and close to finish back below the level. Min sweep ticks sets the margin: sweepMargin equals minSweepTicks multiplied by mintick The wick sweep mode further requires open to remain inside the level on the correct side. 3) Zone Derivation Models Zone bounds are determined from candle anatomy based on the selected RB zone model. Wick to Body: Bullish zone from body bottom to low Bearish zone from high to body top Open to Extreme: Bullish zone from open to low Bearish zone from high to open Full candle: High to low Body: Body top to body bottom These bounds become the candidate block top and bottom. 4) Strength Estimation Base strength uses close location within the candle range: closeLoc equals clamp of (close minus low) divided by range Buy strength equals closeLoc Sell strength equals 1 minus buy strength If Close plus wick is selected, dominant wick contribution is blended into the buy strength calculation using fixed weights. Strength is an approximation and is fixed at formation time. 5) Market Structure Break Detection and Trend State The engine tracks last swing high and last swing low timestamps and prices. It then detects breaks using cross style conditions: Bull break when close crosses above last swing high Bear break when close crosses below last swing low Trend direction is updated on confirmed bars after a break is detected. The engine also tracks the last broken swing timestamp to avoid duplicate structure events on the same swing. BOS and CHOCH are derived by comparing the new break direction to the previous trend direction. 6) Candidate Creation and Pending Queue On confirmed bars, if a rejection candle occurs at the relevant swing level, a Candidate is created with: Formation time Zone top and bottom Direction Buy and sell strength Confirmation level which is the opposite swing level Candidates are pushed into a pending array which is capped by max pending. 7) Candidate Confirmation Within a Window Each pending candidate is evaluated until it either expires or confirms: Expired when time since candidate leftT reaches confirmWindow in bars Confirmed when price breaks the candidate confirmLevel in the direction required for structure confirmation Confirmed candidates are converted into Blocks and added to the active blocks array. 8) Block Construction and Visual Geometry When a block is created, the script draws: Outer box covering the full block range Inner buy and sell boxes split at the zone midpoint Cap line placed at a maximum percentage of the outer width Inner widths are scaled using the block strengths and innerMaxPctOfOuter. A minimum inner width in bars is enforced. 9) Mitigation Detection Mitigation is detected using one of two modes: Touch mode: high low intersects the block range Close Inside mode: close is inside the block range After mitigation, the block can change visual styling, optionally stop extending, and optionally be deleted. 10) Invalidation Detection Invalidation is evaluated when enabled: For bullish blocks, invalidation occurs if price goes below the bottom For bearish blocks, invalidation occurs if price goes above the top This can be evaluated by wick or close depending on invalidation mode. Invalidated blocks can be visually marked and optionally deleted. 11) Aging and Cleanup If max age bars is set, blocks older than that age are removed. Limits on blocks and structure lines are enforced with controlled deletion to respect platform constraints. 12) Visibility Filters Blocks are shown or hidden based on direction toggles: Show bullish blocks Show bearish blocks Structure lines are also gated by a separate toggle and a maximum line budget.Chỉ báocủa UAlgo388
High Volume Impulse Candles (3x/4x)Here’s a polished **description you can use when publishing your High-Volume Impulse Candle indicator** on TradingView: --- ### **Title:** High-Volume Impulse Candles (3x / 4x Thresholds) ### **Description:** This indicator highlights **high-volume impulse candles** on any timeframe, making it easy to spot strong buying or selling pressure in the market. **Features:** * **Orange Candle:** Volume **3×–4×** above the 20-bar average → strong impulse * **Red Candle:** Volume **>4×** above the 20-bar average → extreme impulse * Works on **all timeframes** and is suitable for **BTC and other crypto pairs**. * Simple, clean, and visually intuitive – instantly shows market momentum without clutter. **Usage:** * Use in conjunction with your **trend analysis** (e.g., EMA stack) to identify **high-probability entries**. * Helps detect **potential breakouts, reversals, and explosive moves**. * Works best when combined with **support/resistance levels** or higher timeframe confirmations. **Inputs:** * Volume SMA Length (default: 20 bars) * Impulse Thresholds: Orange (3×), Red (>4×) **Disclaimer:** This indicator is a **tool to identify momentum** and should be used alongside your **risk management and analysis strategy**. Past impulses do not guarantee future price movement. --- If you want, I can also **draft a shorter “TradingView-ready” version** that’s **concise, catchy, and optimized for the public library**, which tends to attract more users. Do you want me to do that? Chỉ báocủa MajorMoves17
MLK Sessions & Levels Here is a concise, professional description in English for your TradingView publication: MLK Sessions & Levels Pro (SMC/ICT) Professional tool for institutional liquidity analysis and session-based execution. 1. Sessions (UTC+1/Berlin Time): Asia: 00:00 – 08:00 Frankfurt: 08:00 – 09:00 (Manipulation Hour) London: 09:00 – 14:00 New York: 14:00 – 22:00 2. Automated HTF Liquidity Magnets: PDH / PDL: Previous Daily High and Low. PWH / PWL: Previous Weekly High and Low. Zero Points: Daily (DO), Weekly (WO), and Monthly (MO) Opens. 3. Technical Features: Gapless Visualization: Optimized code for seamless session transitions on M1/M5 timeframes. Clean Interface: Right-aligned labels and dynamic session boxes for a clutter-free workspace.Chỉ báocủa TRADER_9_ZEROS26
MLK Sessions & Levels ProMLK Sessions & Levels Pro — The Ultimate Liquidity Navigator Welcome to the definitive institutional charting tool by MLK Academy. This indicator is designed for Smart Money (SMC) and ICT-style traders who understand that the market doesn’t move randomly—it moves from one pool of liquidity to another. 🎯 Why MLK Sessions & Levels? In the world of trading, liquidity is fuel. To be a hunter, you must know where the retail crowd hides their stops and where the "Big Players" are building their positions. This script automates your top-down analysis, plotting critical sessions and HTF (High Time Frame) magnets in real-time. 🚀 Key Features: 1. Precision Trading Sessions: Asia Session: The foundational range for the day. Frankfurt Hour (1h): The "Manipulation Window." A dedicated 1-hour block (08:00-09:00) where Frankfurt often sweeps Asia’s liquidity to set the trap for London. London Session: Active from Frankfurt until the New York open. New York Session: Covering the prime volatility from open until the daily close. 2. Institutional Liquidity Magnets (HTF Levels): PDH / PDL: Previous Daily High & Low. The primary targets for intraday sweeps. PWH / PWL: Previous Weekly High & Low. Critical levels for swing points and weekly trend reversals. The Zero Point (Open Prices): Automatic lines for Daily (DO), Weekly (WO), and Monthly (MO) opens. Use these to identify if you are in Premium or Discount zones. 3. Pro-Grade Visuals: Clean, non-cluttering design. Dynamic session boxes that adjust to price volatility. Right-aligned labels for all HTF levels to keep your workspace tidy. 💡 The MLK Strategy: Identify the Magnet: Check your PDH/PDL or PWH/PWL levels. Watch for the Sweep: Look for a price "wick" (Sweep) during the Frankfurt or London open. Execution: Move to the Lower Time Frame (LTF) for a ChoCh (Change of Character) and enter the trade. Statistic Hint: Remember that a "Full Range Sweep" (taking both PDH and PDL in one day) only happens in about 13% of trading days. Trade with the odds! 🛠 Settings: UTC Offset: Default is +2 (Kiev/Europe). Adjust to +3 for Daylight Saving Time. Colors: Fully customizable session box opacity and level colors.Chỉ báocủa TRADER_9_ZEROSCập nhật 14
RSI Fibonacci Analysis [UAlgo]RSI Fibonacci Analysis is an oscillator based Fibonacci mapping tool that projects Fibonacci ratios directly onto RSI swings instead of price swings. The script identifies meaningful pivot highs and pivot lows on RSI, draws a Fibonacci ladder between the most recent alternating swing pair, and then enriches each level with historical retest statistics. This approach aims to answer a practical question: when RSI transitions from one swing extreme to the next, which retracement ratios tend to attract RSI retests most often. The indicator is built for clarity and repeatability. Swing points are detected using a pivot depth setting that confirms highs and lows only after a defined number of bars, reducing noise. A minimum bar gap filter ensures that the Fibonacci anchor points are not too close together. Once a new swing is confirmed, the script draws a connector line between anchors and plots the Fibonacci levels as horizontal lines across the swing window. The distinguishing feature is the integrated statistics engine. Over a configurable lookback of past swing sequences, the script measures how often RSI retests each Fibonacci ratio within a tolerance band. It tracks bullish and bearish swing sequences separately, then shows level strength both on chart labels and in a compact dashboard table. The result is an RSI Fibonacci tool that is not only visual but also descriptive of historical behavior. 🔹 Features 1) RSI Centered Fibonacci Projection Instead of projecting Fibonacci levels on price, the script projects Fibonacci ratios across RSI swing ranges. This can be useful for traders who treat RSI as a structure tool, where oscillator retracements and reactions often precede or confirm price continuation. 2) Pivot Based Swing Detection with Adjustable Depth Swing highs and swing lows are detected on RSI using pivot logic. Swing Depth controls how many bars are required to confirm a pivot. Higher depth creates fewer swings and stronger anchors. Lower depth reacts faster but may produce more frequent levels. 3) Minimum Bar Gap Filter for Cleaner Anchors A minimum distance in bars is enforced between the swing anchors used to draw the current Fibonacci. This avoids drawing ladders on very small micro swings and keeps levels meaningful. 4) Customizable Fibonacci Level Set The script uses a standard Fibonacci set: 0, 0.236, 0.382, 0.5, 0.618, 0.786, 1 Each level is drawn as a horizontal line between the start and end swing timestamps, with an optional thickness adjustment based on statistical strength. 5) Level Strength Statistics with Bull and Bear Separation A built in statistics engine scans historical swing triplets to identify valid zig zag sequences and measures whether the third swing retests near a Fibonacci ratio. Hits are counted separately for bullish swing ranges and bearish swing ranges, producing direction specific behavior profiles. If enabled, the script appends a percent value to each level label, showing how often that level was retested relative to all counted hits for that direction. 6) Strength Weighted Line Thickness When statistics are enabled, the script increases the line width of a Fibonacci level when it represents a larger share of total hits. This provides an at a glance read of which levels historically attract more retests. 7) RSI Gradient Coloring and Context Lines The RSI plot uses a gradient scheme: Above 50, the gradient shifts toward green as RSI approaches higher values Below 50, the gradient shifts toward red as RSI approaches lower values Overbought and oversold reference lines at 70 and 30 are also plotted for context. 8) Dashboard with Directional Hit Breakdown A table dashboard can be displayed in a selectable corner of the chart. It lists each Fibonacci level along with: Bull hits and bull percentage Bear hits and bear percentage Optional row highlighting emphasizes levels that exceed a threshold share of hits on either side, making dominant ratios easier to spot. 🔹 Calculations 1) RSI Computation and Visualization RSI is calculated on a selectable source with a selectable length: float rsiValue = ta.rsi(rsiSource, rsiLength) A gradient color is applied based on whether RSI is above or below 50: color rsiGradient = rsiValue > 50 ? color.from_gradient(rsiValue, 50, 80, color.new(color.green, 50), color.green) : color.from_gradient(rsiValue, 20, 50, color.red, color.new(color.red, 50)) plot(rsiValue, "RSI", color=rsiGradient, linewidth=2) Context lines: hline(70, "Overbought", color=color.new(color.gray, 50), linestyle=hline.style_dotted) hline(30, "Oversold", color=color.new(color.gray, 50), linestyle=hline.style_dotted) 2) RSI Swing Detection Using Pivots Swings are detected using pivot highs and pivot lows on RSI: float ph = ta.pivothigh(rsiValue, swingDepth, swingDepth) float pl = ta.pivotlow(rsiValue, swingDepth, swingDepth) When a pivot is confirmed, it is stored as a Swing object with price, bar index, and direction: if not na(ph) allSwings.unshift(Swing.new(ph, bar_index - swingDepth, true)) if not na(pl) allSwings.unshift(Swing.new(pl, bar_index - swingDepth, false)) The swing list is capped to prevent excessive memory growth. 3) Fibonacci Levels and Current Fib Drawing The script draws a Fibonacci ladder between the most recent pair of alternating swings, with a minimum bar gap condition: Swing lastSwing = allSwings.get(0) Swing prevSwing = allSwings.get(1) if lastSwing.isHigh != prevSwing.isHigh if math.abs(lastSwing.barIdx - prevSwing.barIdx) >= minBarGap Swing start = prevSwing Swing end = lastSwing Levels are derived from the swing range: float diff = end.price - start.price float levelPrice = start.price + (diff * lvl.ratio) A connector line between anchors is also drawn for visual context. 4) Historical Retest Statistics Engine On each new confirmed swing, the script recomputes statistics over a lookback of past swings. It iterates through swing triplets: sStart, sEnd define the fib range sRetest is a later swing used to test retests A valid pattern requires alternating swing types: bool isValidPattern = (sStart.isHigh != sEnd.isHigh) and (sEnd.isHigh != sRetest.isHigh) For valid triplets, it computes the fib range and tests whether the retest swing is close to any fib level. The tolerance is 5 percent of the total range: float lvlPrice = sStart.price + (fibRange * lvl.ratio) float dist = math.abs(sRetest.price - lvlPrice) if dist < (math.abs(fibRange) * 0.05) if isBullish lvl.hitsBull += 1 else lvl.hitsBear += 1 Interpretation: A hit is counted when a retest swing lands within the tolerance band around a Fibonacci ratio Hits are accumulated separately for bullish ranges and bearish ranges 5) Strength Normalization and Label Percentages When drawing the current fib, the script computes total hits for the current direction and converts each level’s hits into a percent: int totalHits = 0 for lvl in levels totalHits += isBullish ? lvl.hitsBull : lvl.hitsBear int pct = int((hits / float(totalHits)) * 100) labelText += " (" + str.tostring(pct) + "%)" Line width is also increased when a level’s strength exceeds thresholds: Strength greater than 20 percent increases width Strength greater than 30 percent increases width further 6) Dashboard Totals and Percent Columns On the last bar, the dashboard computes totals and level percentages separately for bull and bear hits: int totalBull = 0 int totalBear = 0 for lvl in fibLevels totalBull += lvl.hitsBull totalBear += lvl.hitsBear float pctBull = totalBull > 0 ? (lvl.hitsBull / float(totalBull)) * 100 : 0 float pctBear = totalBear > 0 ? (lvl.hitsBear / float(totalBear)) * 100 : 0 These values are printed in the table. Optional highlighting can be applied when either pctBull or pctBear exceeds a threshold, helping dominant levels stand out.Chỉ báocủa UAlgo434
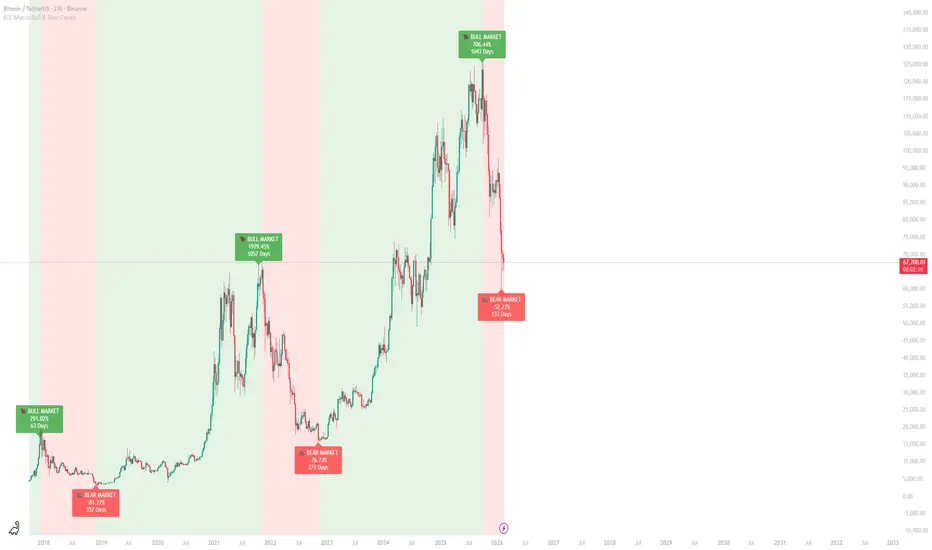
BTC Macro Bull & Bear CyclesPinpoint Accuracy: The script creates a green or red background precisely between the major historical turning points. Smart Floating Labels: As a cycle progresses, the script calculates the exact % change from the bottom/top. It pins the label exactly on the tip of the highest high or the lowest low so it doesn't clutter your candles. Duration: It calculates the exact number of days that specific cycle lasted right up to the week the trend transitioned.Chỉ báocủa Jay_brothersCập nhật 66 1.4 K
Liquidity Raids [UAlgo]Liquidity Raids is a market structure overlay designed to highlight classic liquidity sweep events around recent swing levels. The script continuously maps swing highs and swing lows using pivot detection, projects those levels forward as active lines, and then monitors price behavior around each level to detect a raid. A raid is defined here as a sweep through a prior level followed by rejection back across it within the same bar. This behavior often represents stop runs, liquidity grabs, or failed break attempts. The script separates these events into: BSL sweeps, where buy side liquidity above prior highs is taken and price closes back below the level SSL sweeps, where sell side liquidity below prior lows is taken and price closes back above the level To improve signal quality, an optional relative volume confirmation filter can be enabled. When active, a sweep is only valid if the sweep bar’s volume exceeds a multiple of the recent average, and the script prints the relative volume percentage on the chart for additional context. The indicator also includes practical object management to keep charts clean by limiting the number of active levels and removing invalidated lines automatically. 🔹 Features 1) Automatic Swing Level Mapping via Pivot Highs and Lows The script uses pivot detection to identify meaningful swing highs and swing lows. Each confirmed pivot becomes a projected liquidity level that extends forward in time. These levels represent areas where stops and breakout orders tend to cluster. Pivot Length controls how sensitive the swing detection is. Higher values produce fewer but more significant levels. Lower values react faster and produce more frequent levels. 2) Active Level Projection and Management Each pivot level is drawn as a horizontal line and stored in an internal array. On every new bar, the script updates each active line so it extends to the current bar. A Maximum Active Levels setting prevents chart clutter and controls the number of stored objects. When the limit is exceeded, the oldest level is removed. 3) Clear Sweep Definitions for BSL and SSL Each level is monitored for two outcomes: Sweep and reject Broken and accepted For resistance levels, a BSL sweep requires the bar high to trade above the level while the close finishes at or below the level. A break requires the close to finish above the level. For support levels, an SSL sweep requires the bar low to trade below the level while the close finishes at or above the level. A break requires the close to finish below the level. When a sweep is detected, the level is removed after the event is confirmed. When a level is broken, it is removed to prevent outdated levels from remaining on the chart. 4) Optional Volume Confirmation Using Relative Volume When enabled, sweeps are filtered using Relative Volume (RVOL). The script compares the current bar’s volume to the 20 bar average volume and requires it to exceed a user defined multiplier. This is useful for separating meaningful stop runs from thin market spikes. The script also prints the RVOL percentage near the swept level for quick evaluation. 5) Sweep Highlighting and Labels On a valid sweep, the script highlights the swept level with a bright confirmation line and optionally prints labels: ▼ BSL for buy side liquidity sweeps ▲ SSL for sell side liquidity sweeps Volume information is also displayed as a percentage at the midpoint of the swept segment, positioned above for BSL and below for SSL to reduce overlap. 6) Configurable Visual Styling You can control resistance and support colors independently, choose line style (solid, dotted, dashed), and toggle labels. This makes the overlay adaptable to both clean minimalist charts and more information dense layouts. 7) Alerts for Automation and Monitoring Alert conditions are included for both sweep types. In addition, the script triggers immediate alerts with the close price when a sweep is detected on bar close. This supports both discretionary monitoring and automated notification workflows. 🔹 Calculations 1) Pivot Based Level Detection Swing highs and lows are detected using symmetric pivot logic: float ph = ta.pivothigh(high, pivotPeriodInput, pivotPeriodInput) float pl = ta.pivotlow(low, pivotPeriodInput, pivotPeriodInput) Interpretation: A pivot high is confirmed only after pivotPeriodInput bars to the right A pivot low is confirmed only after pivotPeriodInput bars to the right Confirmed pivot values become new resistance or support liquidity levels 2) Level Storage and Line Creation When a pivot is confirmed, the script creates a line starting at the pivot bar and stores it as a LiquidityLevel object: line newL = line.new(bar_index , ph, bar_index, ph, color = resistanceColorInput, style = getLineStyle(lineStyleInput)) resistanceLevels.push(LiquidityLevel.new(ph, bar_index , newL)) The same logic applies to pivot lows for support levels. To prevent excessive object growth, levels are capped: if resistanceLevels.size() > maxLinesInput (resistanceLevels.shift()).delete() 3) Relative Volume and Volume Filter The script computes average volume over the last 20 bars and converts current volume into a percentage: float volAvg = ta.sma(volume, 20) float volRelative = (volume / volAvg) * 100 The volume filter is satisfied when either the filter is disabled or the current volume exceeds the average multiplied by the chosen multiplier: bool isVolStrong = not useVolFilterInput or (volume > volAvg * volMultiplierInput) 4) Sweep and Break Conditions Each active resistance level is checked for a sweep or a break: bool priceSwept = high > lvl.price and close <= lvl.price bool broken = close > lvl.price Each active support level is checked similarly: bool priceSwept = low < lvl.price and close >= lvl.price bool broken = close < lvl.price Interpretation: A sweep requires a wick through the level and a close back across it A break requires acceptance beyond the level on close 5) Sweep Confirmation Handling and Cleanup When a sweep occurs with strong volume, the script sets a flag for alerts, draws highlight objects, prints labels, and removes the level from active tracking: Resistance sweep flow: if priceSwept and isVolStrong buySweepOccurred := true line.new(lvl.startBar, lvl.price, bar_index, lvl.price, color = C_SWEEP_BUY) resistanceLevels.remove(i).delete() Support sweep flow: if priceSwept and isVolStrong sellSweepOccurred := true line.new(lvl.startBar, lvl.price, bar_index, lvl.price, color = C_SWEEP_SELL) supportLevels.remove(i).delete() If a level is broken, it is removed as invalid: else if broken resistanceLevels.remove(i).delete() 6) Volume Annotation Placement On a sweep, the script computes the midpoint of the level segment in bar index space and prints RVOL percent: int midX = math.round((lvl.startBar + bar_index) / 2) label.new(midX, lvl.price, str.tostring(volRelative, "#") + "% VOL") Placement is above for BSL sweeps and below for SSL sweeps to align with the direction of the liquidity being taken. 7) Alerts Alert conditions and direct alerts are provided: alertcondition(buySweepOccurred, "Buy Liquidity Sweep", "BSL Swept!") alertcondition(sellSweepOccurred, "Sell Liquidity Sweep", "SSL Swept!") The script also triggers runtime alerts including the close price once per bar close when a sweep occurs.Chỉ báocủa UAlgo277
Natural Visibility Graph [UAlgo]Natural Visibility Graph (NVG) is a structure detection indicator that treats price as a time series network. Each bar is interpreted as a node, and nodes are connected if they can “see” each other without intermediate bars blocking the line of sight. This is based on the Natural Visibility Graph concept introduced in complex network theory, where geometric visibility rules convert a time series into a graph. In practical trading terms, NVG measures how structurally important a bar is by counting how many past bars remain visible from it. Bars with high visibility act like pivots that dominate their local environment because they are not easily obstructed by surrounding price action. The script computes this visibility for highs and lows separately, then flags exceptional nodes as hubs using a dynamic, volatility aware thresholding process. The output is a chart overlay that highlights structural peaks and valleys with neon hub markers, draws a horizon style connection to the furthest visible bar, and optionally provides alerts when new hubs appear. It also colors bars according to hub status so structural events stand out instantly. 🔹 Features 1) Natural Visibility Graph Degree for Highs and Lows The indicator calculates an in degree style connectivity score for each bar. Degree represents how many past bars are visible from the current bar under the NVG rule. Highs and lows are handled independently: High graph measures visibility between swing peaks Low graph measures visibility between swing valleys using an inverted obstruction rule This separation helps detect both resistance like peaks and support like valleys without blending them into a single metric. 2) Lookback Controlled Structural Sensitivity Visibility is computed only within a user selected lookback window. Larger values build stronger structural context and produce more selective hubs, but increase computation. Smaller values react faster but focus on local structure. Visibility Lookback directly controls how far the algorithm searches for visible connections. 3) Dynamic Hub Detection with Adaptive Max Degree Instead of using a fixed degree threshold, the script maintains a rolling maximum degree for highs and lows and applies a percentile style threshold. A slow decay mechanism reduces the max gradually over time so the reference level adapts when market structure changes. This keeps hub detection stable across different regimes and helps avoid permanently locking into an old maximum degree that may no longer be reachable. 4) Hub Threshold Percentile Control Hub Threshold defines how strict hub detection is. It is applied as a fraction of the current rolling maximum degree: High hub when degreeH is greater than or equal to maxDegH times threshold Low hub when degreeL is greater than or equal to maxDegL times threshold Higher threshold values mark only the most dominant nodes. Lower values mark more frequent hubs. 5) Neon Web Visual Design The script uses a neon palette to make structural events highly visible: High hubs are marked with a cyan diamond above price Low hubs are marked with a pink diamond below price A dotted horizon beam connects the hub to its furthest visible past node, helping you interpret how far the hub’s influence extends in the visibility sense. 6) Bar Coloring for Instant Structural Context Bars are colored by hub status: Cyan for high hubs Pink for low hubs Muted gray for non hub bars This provides a fast scan view of where the market is producing dominant structural events. 7) Alerts for Structural Peaks and Valleys Alert conditions are provided for both hub types: High Visibility Structural Peak Detected High Visibility Structural Valley Detected These can be used for structural monitoring, swing validation, or confluence with other tools. 🔹 Calculations 1) Natural Visibility Rule for Highs For each past bar i within the lookback, the script checks if the straight line from the current high to the past high is unobstructed by intermediate highs. If no intermediate high reaches or exceeds the projected height on that line, the past bar is visible and the degree increases. Core idea: Current bar at index 0 Past bar at index i Intermediate bars at index k where 1 is the nearest past bar and i minus 1 is just before the past bar Slope and projection: float slope = (high - high ) / float(i) for k = 1 to i - 1 float y_projected = high - (slope * k) if high >= y_projected isVisible := false break If isVisible remains true, degreeH increments and furthestVisIdxH is updated to i, so the script remembers the furthest visible connection for drawing. 2) Natural Visibility Rule for Lows Lows use the inverted valley logic. A past low is visible from the current low if intermediate lows do not fall at or below the projected line, because deeper lows block visibility in a valley sense. float slope = (low - low ) / float(i) for k = 1 to i - 1 float y_projected = low - (slope * k) if low <= y_projected isVisible := false break If visible, degreeL increments and furthestVisIdxL records the furthest visible low node. 3) Rolling Maximum Degree with Slow Decay The indicator maintains rolling maximum degree values for highs and lows. Periodically it applies a slow decay so that the maximum can adapt downwards over time if structural connectivity decreases: var int maxDegH = 5 var int maxDegL = 5 if bar_index % int(lookback/2) == 0 maxDegH := int(math.max(5, maxDegH * 0.95)) maxDegL := int(math.max(5, maxDegL * 0.95)) maxDegH := math.max(maxDegH, degreeH) maxDegL := math.max(maxDegL, degreeL) Interpretation: The max degree never falls below 5 Decay runs every lookback divided by two bars New degrees update the max immediately if a stronger hub appears 4) Hub Classification A bar becomes a hub if its degree reaches a fraction of the current max degree: bool isHubH = degreeH >= maxDegH * threshold bool isHubL = degreeL >= maxDegL * threshold threshold behaves like a percentile control over the observed maximum connectivity. 5) Hub Markers and Horizon Beam When a hub is detected, the script plots a diamond label and draws a dotted line to the furthest visible bar for that hub type: High hub: label.new(bar_index, high, "◈", textcolor=colNeonCyan, style=label.style_label_down) line.new(bar_index, high, bar_index - furthestVisIdxH, high , style=line.style_dotted) Low hub: label.new(bar_index, low, "◈", textcolor=colNeonPink, style=label.style_label_up) line.new(bar_index, low, bar_index - furthestVisIdxL, low , style=line.style_dotted) Interpretation: The beam represents the furthest confirmed visibility connection and gives a visual sense of the hub’s visibility range. 6) Alert Conditions The script exposes alert conditions tied to the hub booleans: alertcondition(isHubH, "NVG High Hub", "High Visibility Structural Peak Detected") alertcondition(isHubL, "NVG Low Hub", "High Visibility Structural Valley Detected") Chỉ báocủa UAlgo1164
Levels [BeNice] Levels is a precision mapping tool for traders who rely on High Timeframe (HTF) levels to define their daily bias. It automates the process of marking Open, High, Low, and Equilibrium (EQ) levels across all major lookback periods. 💎 Key Functionalities Dynamic HTF Mapping: Supports Yearly, Quarterly, Monthly, Weekly, Daily, and H4 timeframes. Monday Range Specialist: Specifically tracks Monday's price action, a vital zone for setting the weekly narrative. EQ (Equilibrium) Tracking: Automatically plots the mid-point of any given period, helping you identify Discount and Premium zones instantly. Clean UI Logic: Features a built-in "anti-overlap" array system. If multiple levels occupy the same price point, the script optimizes the visuals to keep your chart professional and readable. Full Customization: Control line styles (Solid, Dotted, Dashed), colors, text sizes, and line extensions to fit your personal chart aesthetic. 💡 Pro Trading Tip Use these levels as Liquidity Targets or Points of Interest (POI). When price interacts with a Prev. Weekly High or a Monthly Open, look for the Reversal Pro+ SFP signals to confirm high-probability trade entries.Chỉ báocủa sinanbinay51
Smart Money Concepts AI - AdaptiveSmart Money Concepts AI scores every Fair Value Gap and Order Block with a 5-factor quality engine so you can instantly see which zones are worth trading and which are noise. ◈ How It Works This indicator detects three core Smart Money / ICT concepts and layers an AI scoring system on top. Market Structure tracks swing highs and lows to identify Break of Structure (BOS) and Change of Character (CHoCH). BOS means the trend is continuing. CHoCH means it may be reversing. The indicator automatically classifies each break and draws labeled lines on your chart. CHoCH lines are solid and thicker since they're the more significant events. BOS lines are dashed. Both can be toggled independently. Fair Value Gaps (FVGs) are 3-candle imbalances where price moved so fast it left a gap. The indicator detects these automatically and draws scored boxes on the chart. Each FVG gets a quality score from 0 to 100. Higher-scored zones appear more vivid; lower-scored zones fade out. When price fills the gap (mitigation), the box turns dashed. Order Blocks (OBs) are the last opposite candle before a structural break. They represent institutional accumulation or distribution. When a bullish CHoCH/BOS fires, the indicator looks back for the last bearish candle near the swing low and marks it as a demand zone. Bearish OBs work in reverse. Each OB is scored by displacement strength, volume, and trend alignment. ◈ The AI Scoring Engine Every zone gets a 0-100 quality score based on 5 factors: For FVGs: Gap Size vs ATR: sweet spot is 0.3x to 1.5x ATR. Too small = noise, too big = likely fills fast Displacement Strength: body-to-range ratio of the middle candle. Full-body candles = institutional conviction Volume: displacement candle volume vs 20-period average Trend Alignment: does the FVG direction match the EMA trend? Structure Alignment: does it align with the current BOS/CHoCH direction? For Order Blocks: OB Size: tighter zones (0.3-1.0 ATR) score higher for precision Post-OB Displacement: how far price moved after leaving the OB. Bigger moves = stronger institutional interest Volume, Trend, and Structure: same alignment checks as FVGs The score directly controls visual opacity. High-scoring zones are vivid and prominent, low-scoring zones are subtle and transparent. You can filter to "High Only" to hide zones scoring below 50. ◈ Signals Signals fire when price enters a scored FVG zone with structural and trend alignment. If a scored Order Block overlaps the FVG, the score increases further. ★ Bright signals = high confluence (score ≥ 70 default). FVG + OB overlap + structure + trend all confirm. ○ Dim signals = moderate confluence (score ≥ 50). The setup exists but not all factors align perfectly. By default, only ★ bright signals are shown to keep the chart clean. You can enable dim signals in settings if you want to see every zone touch. A configurable cooldown (default 10 bars) prevents signal spam. All signals are non-repainting. They only appear on confirmed bar closes. ◈ How to Read the Dashboard SMC AI ◈: header Structure: current direction (▲ BULLISH / ▼ BEARISH / — RANGING) with bias label Trend(50): whether the EMA trend agrees with structure (✓ ALIGNED = go / ✗ COUNTER = caution) Best FVG: quality score of the highest-rated active FVG in the current direction, with visual bar Best OB: quality score of the highest-rated active Order Block, with visual bar Signal: last signal state (★ LONG / ○ SHORT / — WAITING) with the actual entry score Zones: count of active bull/bear FVGs and OBs on chart The Signal row shows the actual score from when the signal fired, so it always matches the label on the chart. ◈ Recommended Settings Forex (EUR/USD, GBP/JPY) 1H to 4H: Swing Length 5, ATR 14, Trend EMA 50, Signal Cooldown 10 Forex scalping 15min: Swing Length 3, ATR 10, Trend EMA 34, Signal Cooldown 5 Crypto (BTC, ETH) 1H to 4H: Swing Length 5, ATR 14, Trend EMA 50, Signal Cooldown 10 Gold / Commodities 4H to Daily: Swing Length 7, ATR 14, Trend EMA 50, Signal Cooldown 15 Indices (NAS100, SPX500) 15min to 1H: Swing Length 3 to 5, ATR 10, Trend EMA 34, Signal Cooldown 8 For aggressive setups: Lower Min Signal Score to 40, enable dim signals, show more FVGs (8 to 10) For conservative setups: Raise Min Signal Score to 70, filter FVGs to "High Only", increase cooldown ◈ Key Features ✓ Non-repainting: all signals confirmed on bar close ✓ AI zone scoring: 5-factor quality engine, 0-100 per zone ✓ Visual hierarchy: opacity reflects score, you instantly see what matters ✓ Mitigation tracking: filled FVGs and broken OBs fade automatically ✓ Rich tooltips: hover any signal for full breakdown ✓ 9 alert conditions: BOS, CHoCH, bull/bear signals, AI-confirmed signals ✓ Signal clutter control: cooldown + dim toggle keeps charts clean ✓ Fully customizable: colors, zone counts, thresholds, all adjustable ✓ 100% original code: not derived from any existing script ◈ What This Is NOT This is not a "paint arrows and win" indicator. SMC/ICT trading requires understanding context. Where is structure pointing? Which zones are institutionally significant? Is the trend aligned? This indicator helps you answer those questions faster by scoring every zone objectively. Always use proper risk management. Past performance does not guarantee future results. Happy trading.Chỉ báocủa DefinedEdge44843
Trend-o-MeterTrend-O-Meter: Smart Fractal Power Balance Indicator Fractal-based trend strength meter showing real-time bull/bear power. Chỉ báocủa Radjon115
Candle 2 (C2 Engulfing) [ArionAlgo]Candle 2 (C2 Engulfing) This indicator focuses on Candle 2 (C2) as the primary displacement event within a structured engulfing framework. Instead of treating Candle 3 as the main expansion, this model emphasizes C2 as the true momentum shift — highlighting where liquidity is taken and price begins delivering in the new direction. 🔹 Core Concept • Candle 2 represents displacement: the decisive shift in order flow that signals potential continuation or reversal. • Candle 3 serves as optional follow-through expansion, confirming momentum after displacement occurs. • An optional Strict C2 rule enforces higher-probability structure by requiring the close to occur inside or beyond the Candle 1 body on the correct side. 🔹 What the Script Does • Detects bullish and bearish C2 displacement conditions based on engulfing behavior and structural rules. • Marks C2 and C3 events directly on the chart with clear visual labels. • Builds dynamic zones from candle structure to help traders frame reaction areas and refine entries. • Plots optional levels derived from prior candle structure for additional context. 🔹 Customization & Control • Independent toggles for Candle 2 displacement and Candle 3 expansion. • Optional reversal filter using swing extremes. • Wick-threshold filtering to avoid weak or inefficient candles. • Adjustable colors, transparency, levels, and zone visibility for clean integration into any chart style. 🔹 Alerts Built-in alerts trigger on confirmed C2 displacement and C3 expansion at bar close, making it easy to integrate into discretionary or rule-based workflows. This script is shared freely with the trading community in hopes it helps someone refine their understanding of price delivery and create meaningful opportunities through disciplined trading. It is a visual framework — not financial advice — so always apply sound risk management. — ArionAlgo Chỉ báocủa ArionAlgo49
YY fx profx piyasasında al-sat modeli nadaraya ile beraber kullanımı ile 15dk grafiklere entegreChỉ báocủa yumutborsa247
Bob's Matrix 2.0 - Signal StrengthSuggested Title: Institutional Matrix & Signal Strength Description: This indicator is a comprehensive battle station designed for high-precision institutional trading, based on Smart Money Concepts (SMC) and Fractal Timeframe Confluence. Its primary goal is to eliminate subjectivity and confirm market direction through total data alignment. How does it work? The indicator analyzes in real-time the Bias of 5 key timeframes: Daily (D1), 4 Hours (H4), 1 Hour (H1), 15 Minutes (15M), and 5 Minutes (5M). It uses a price-action logic comparing opening and closing prices to determine who controls the order flow at every level of the market. Key Features: Institutional Matrix: A dynamic visual panel showing Bullish (BULL) or Bearish (BEAR) bias across all fractals. Signal Strength: A proprietary algorithm that calculates the percentage of confluence between all timeframes. 100% / 0%: Full institutional alignment (High Probability). 40% - 60%: Accumulation or retracement zone (Indecision). SMC Optimized: Ideal for confirming entries after a Liquidity Sweep, a CHoCH (Change of Character), or when mitigating an Order Block. Manipulation Detection: Easily identify when lower timeframes (M5/M15) are fighting the major trend, helping you avoid common market traps. How to Trade it: For professional execution, follow the Institutional Cascade workflow: Check the Daily bias to establish the master direction. Wait for the H1 setup to align with the Daily trend. Look for your entry trigger on M5/M15 only when the Signal Strength exceeds 80%, ensuring you are trading alongside "Smart Money." "The market is a device for transferring money from the impatient to the patient."Chỉ báocủa JorgeG25510
Alpaca-trade V3S-GodMode Synced Strategy คือเครื่องมือ All-in-One สำหรับเทรดเดอร์สาย ICT / SMC (Smart Money Concepts) ที่ออกแบบมาเพื่อการเทรด Gold (XAUUSD) และ Futures โดยเฉพาะ รวบรวมเครื่องมือวิเคราะห์โครงสร้างราคาและเวลา (Time & Price) ที่สำคัญที่สุดไว้ในหน้าจอเดียว พร้อมระบบ Clean Chart ที่ช่วยให้กราฟไม่รก 🚀 Key Features (ฟีเจอร์หลัก): 1. 🏛️ Market Structure & Trend Trend Filter: กรองเทรนด์หลักด้วย EMA 200 (ปรับแต่งได้) VWAP: เส้นค่าเฉลี่ยถ่วงน้ำหนักปริมาณการซื้อขาย Swing Detection: ระบุจุด Swing High/Low อัตโนมัติ (เลือกดูย้อนหลังหรือดูแค่ปัจจุบันได้) 2. ⏰ Time & Sessions Session Ranges: กล่องแสดงช่วงเวลา Asia, London, และ New York พร้อมเส้นกึ่งกลาง (Mean Threshold) Daily Levels: เส้นราคาสำคัญประจำวัน (Previous Day High/Low, True Day Open, New Day Open) Clean Chart Mode: โหมดพิเศษแสดงผลเฉพาะสัปดาห์ปัจจุบัน ช่วยให้โหลดกราฟไวและไม่รกตาย้อนหลัง 3. 🧠 ICT Concepts & Macros ICT Macro Tracker: ติดตามช่วงเวลา Macro สำคัญ (เช่น 02:50, 09:50) พร้อมเส้นราคาเปิดของช่วงเวลานั้นๆ Quarterly Theory: เส้นแบ่งช่วงเวลา 90 นาที (Q1-Q4) และ Micro Cycles (23 นาที) SMT Divergence: ตรวจจับความขัดแย้งของราคากับสินทรัพย์อ้างอิง (เช่น DXY) 4. 💎 Smart Money & Entry Models Inversion FVG (IFVG): แสดง Fair Value Gaps ที่ถูกทำลายและเปลี่ยนหน้าที่เป็นแนวรับ/ต้าน (Credit: LuxAlgo logic) CISD (Change in State of Delivery): ระบบแจ้งเตือนจุดกลับตัวเมื่อเกิดการกวาด Liquidity + FVG + Displacement ในช่วง Killzone 5. 🏆 Gold Special Features Round Numbers: เส้นแนวรับแนวต้านจิตวิทยา (Psychological Levels) สำหรับทองคำ ปรับระยะห่างได้ (เช่น ทุกๆ $5 หรือ $10) 6. 🛠️ Quality of Life Dashboard & Watermark: แสดงสถานะและชื่อระบบแบบมืออาชีพ Customizable: ปรับสี เปิด/ปิด ฟีเจอร์ต่างๆ ได้ตามใจชอบผ่านเมนูตั้งค่า ⚠️ Disclaimer: เครื่องมือนี้มีไว้เพื่อช่วยในการวิเคราะห์ทางเทคนิคเท่านั้น ไม่ใช่คำแนะนำทางการเงิน การลงทุนมีความเสี่ยง ผู้ใช้งานควรศึกษาและบริหารความเสี่ยงด้วยตนเอง ------------------------------------------------------------- Here is the English Version of the description, ready for you to copy and paste into TradingView! 😎 📝 V3S-GodMode Synced Strategy Title: V3S-GodMode Synced Strategy Description: V3S-GodMode Synced Strategy is an All-in-One trading toolkit designed specifically for ICT / SMC (Smart Money Concepts) traders focusing on Gold (XAUUSD) and Futures markets. It consolidates the most critical Price Action and Time analysis tools into a single, comprehensive indicator, featuring a "Clean Chart Mode" to keep your workspace uncluttered and professional. 🚀 Key Features: 1. 🏛️ Market Structure & Trend Trend Filter: Filters the primary market direction using a customizable EMA 200. VWAP: Displays the Volume Weighted Average Price for intraday analysis. Swing Detection: Automatically identifies Swing Highs and Swing Lows (Toggle available for historical or current data only). 2. ⏰ Time & Sessions Session Ranges: Visual boxes for Asia, London, and New York sessions, complete with a Mean Threshold (50%) line. Daily Levels: critical daily price levels, including Previous Day High/Low (PDH/PDL), True Day Open (TDO), and New Day Open (NDO). Clean Chart Mode: A unique feature that displays data only for the current week, significantly improving chart loading speed and reducing visual noise from historical data. 3. 🧠 ICT Concepts & Macros ICT Macro Tracker: Tracks essential Macro windows (e.g., 02:50, 09:50) and plots the opening price line for each specific macro period. Quarterly Theory: Vertical dividers for 90-minute cycles (Q1-Q4) and Micro Cycles (23-minute intervals). SMT Divergence: Detects divergences between the asset price and a reference asset (e.g., DXY) to spot potential reversals. 4. 💎 Smart Money & Entry Models Inversion FVG (IFVG): Highlights Fair Value Gaps that have been invalidated and flipped their role to support or resistance (Credit to LuxAlgo logic). CISD (Change in State of Delivery): An alert system identifying potential reversal points based on Liquidity Sweeps + FVG + Displacement occurring specifically within Killzones. 5. 🏆 Gold Special Features Round Numbers: Automatic psychological support and resistance lines for Gold, with adjustable increments (e.g., every $5, $10, or custom values). 6. 🛠️ Quality of Life Dashboard & Watermark: Displays the system status and indicator name with a professional look. Fully Customizable: Toggle any feature on or off and customize colors to match your personal trading style via the settings menu. ⚠️ Disclaimer: This tool is intended for technical analysis assistance only and does not constitute financial advice. Trading involves significant risk. Users should conduct their own research and manage their risk accordingly.Chỉ báocủa CayenneGT161
Static Opening Range Boxes - Customizable Timeframes and ORBS Visual script that displays opening range orbs for selected time frames, number of orbs to retain, length of orbs customizable. Chỉ báocủa OrderbookMechanics31
Previous Candle High/Low/Mid - Timeframe Select - Custom Lines A simple but useful visual overlay that continuously updates and displays the prior candles High, Mid and Low levels of a selected time frame. With the ability to change the thickness, length and color of each line. Chỉ báocủa OrderbookMechanics1170
HTF Candle hourHTF candlestick builder indicator to view 3 HTFs Includes timestamps and editable HTF 1, 2 Color and text can be edited in the indicator builder sectionChỉ báocủa sjlver91Cập nhật 33133
Multi-TF Candle CounterThis indicator counts candles starting from a specific date across up to 4 different timeframes at once. It's designed to help traders track market cycles and identify potential turning points using the Denizhan number sequence. Key Features: ✅ Multi-Timeframe Support Current chart timeframe 5-minute candles 15-minute candles 1-hour candles ✅ Smart Label Placement Shows higher timeframe counts only on the first candle of that period Example: On a 1-minute chart, the 5m counter only appears every 5 minutes Prevents chart clutter while maintaining accuracy ✅ Number Sequence Highlighting Automatically highlights special numbers: 1, 3, 7, 13, 21, 31, 43, 57, 73... These numbers follow the pattern: n² - (n-1) Special numbers appear in RED for easy identification ✅ Fully Customizable Enable/disable each timeframe independently Choose custom colors for each timeframe Set label position (High, Low, Close, Open) Single start/end date applies to all timeframes Toggle special number highlighting on/off How to Use: Add to Chart: Apply the indicator to any chart Set Date Range: Confirm the start and end dates (applies to all timeframes) Enable Timeframes: Turn on the timeframes you want to track Customize Colors: Set different colors for each timeframe to distinguish them Watch for Red Numbers: Special Denizhan numbers appear in red as potential turning points Use Cases: Cycle Tracking: Monitor how many candles have passed since a significant event Multi-Timeframe Analysis: See relationships between different timeframe counts Pattern Recognition: Identify when multiple timeframes align at special numbers Reversal Points: Watch for Denizhan numbers as potential support/resistance timing Settings Overview: Start Date (All TF) End Date (All TF) Each Timeframe Has: Enable toggle Text color Label location Special number highlighting Note: This indicator works on any timeframe but is most effective on lower timeframes (1m, 5m, 15m) when tracking higher timeframe counts.Chỉ báocủa berktest011123