Sessions & HTF CandlesSession Range & HTF Candle Projection
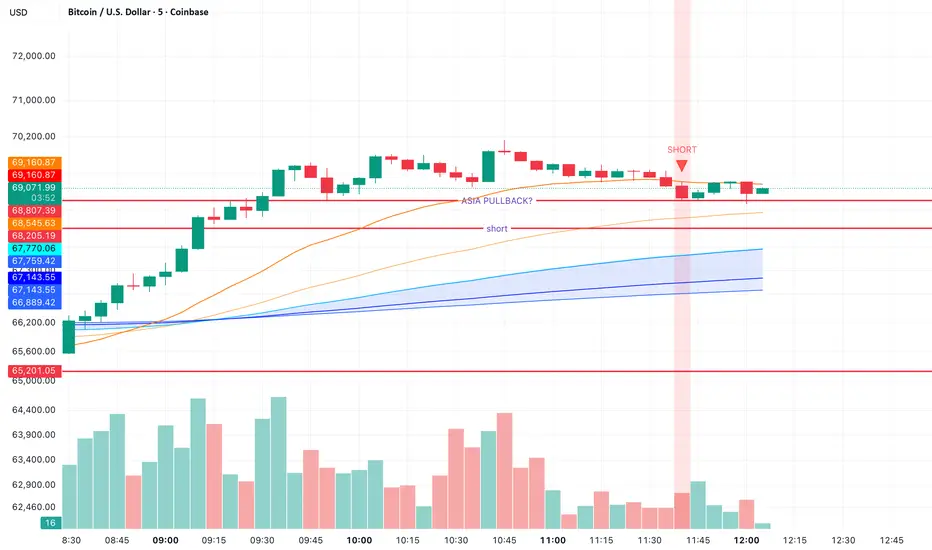
Session Range & HTF Candle Projection is a price-action tool designed to help traders visualize key session levels and higher-timeframe structure directly on their chart. By combining session range tracking with projected higher timeframe candles, the indicator provides a clearer understanding of market context, volatility, and potential breakout zones.
Key Features
Session Range Detection
Automatically tracks and plots the high and low of a selected trading session (Asia, London, New York, or custom).
Clearly highlights the session range so traders can identify consolidation zones and liquidity pools.
Helps spot range breakouts, fakeouts, and expansion phases.
HTF Candle Projection
Displays projected higher timeframe (HTF) candles on lower timeframes.
Allows traders to see how the current price movement is building the higher-timeframe candle in real time.
Useful for identifying HTF bias, rejection wicks, and momentum shifts before the candle closes.
Range Expansion Awareness
Quickly see when price breaks outside the session range.
Helps identify volatility expansion, which often leads to strong directional moves.
Clean Market Structure View
Reduces the need to constantly switch between timeframes.
Keeps key information visible while maintaining a minimal and clean chart layout.
How Traders Use It
Identify London or New York session breakouts.
Confirm trades with higher timeframe candle structure.
Spot liquidity grabs around session highs/lows.
Understand whether current price action supports the HTF directional bias.
Ideal For
Intraday traders
Scalpers
Smart-money / liquidity traders
Price action traders
This indicator helps traders stay aligned with session volatility and higher-timeframe context, making it easier to anticipate where the market may expand next.
Chỉ báo