Chỉ báo
Chỉ báo

Chỉ báo

Chỉ báo

Chỉ báo
Chỉ báo

Chỉ báo

Chỉ báo

Chỉ báo

Chỉ báo

Chỉ báo

Punjis Dynamic Daily EMA/SMA 5,9,21,50,100 LevelsPunjis Dynamic Daily EMA/SMA 5,9,21,50,100 Levels
Overview:
This indicator displays daily timeframe moving averages as horizontal lines extending to the right of your chart, regardless of what timeframe you're currently viewing. It includes six key moving averages: EMA 5, EMA 9, EMA 21, SMA 50, SMA 100, and SMA 200.
Key Features:
Clean Chart Design: Unlike traditional moving average lines that clutter your chart with curves across all candles, this indicator uses horizontal lines that ext Chỉ báo

Chỉ báo

Chỉ báo

Chỉ báo

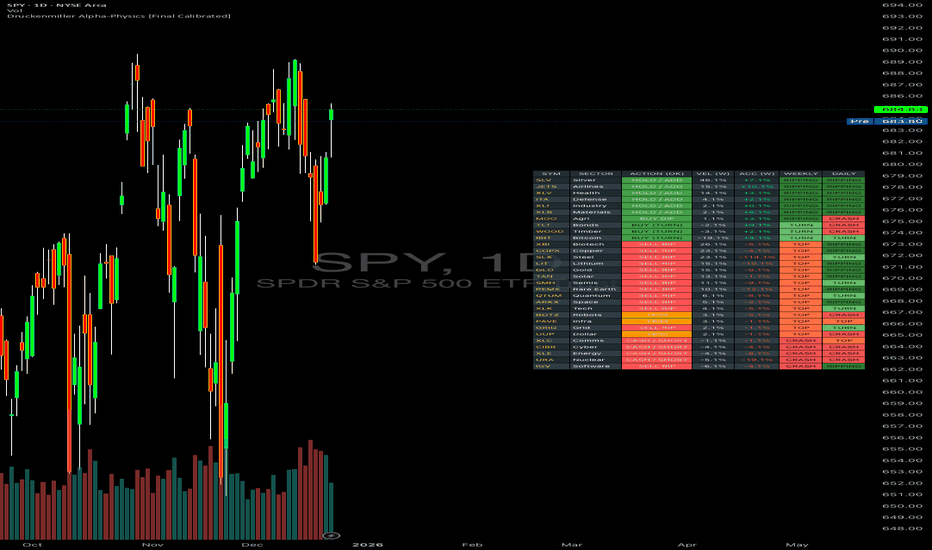
Relative Value & Risk Analytics DashboardThis is your risk-adjusted alpha analysis tool - exactly what hedge fund and insurance company clients want to see.
Attractiveness Score | Composite score combining RV and Risk (0-100)
Relative Performance | vs Benchmark (SET/SPY), RS Ratio Trend, 52W Position, Spread Z-Score
Risk Metrics | Beta, Alpha, Sharpe, Sortino, Information Ratio, Volatility
Correlation | Benchmark Correlation, R-Squared, Regime Change Detection
Pair Trade | Peer Correlation, Pair Z-Score, Long/Short Signals
Factor Expo Chỉ báo

Chỉ báo

Chỉ báo

Chỉ báo

Chỉ báo

Chỉ báo

Chỉ báo

Chỉ báo

Chỉ báo