Candlestick PatternsTitle: Candlestick Patterns
Description:
Detects and labels 15 classic Japanese candlestick patterns in real time, with a multi-timeframe trend filter that highlights which signals align with the prevailing trend direction.
Patterns detected
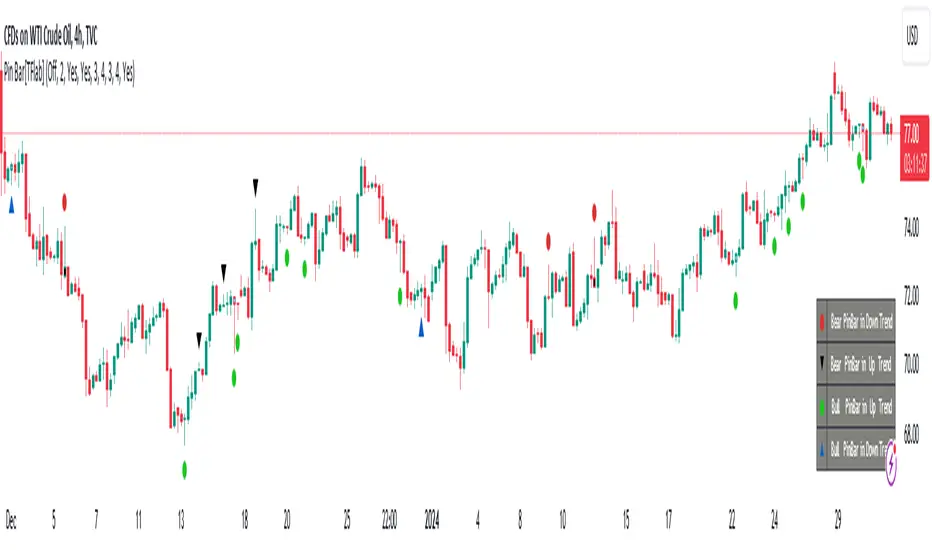
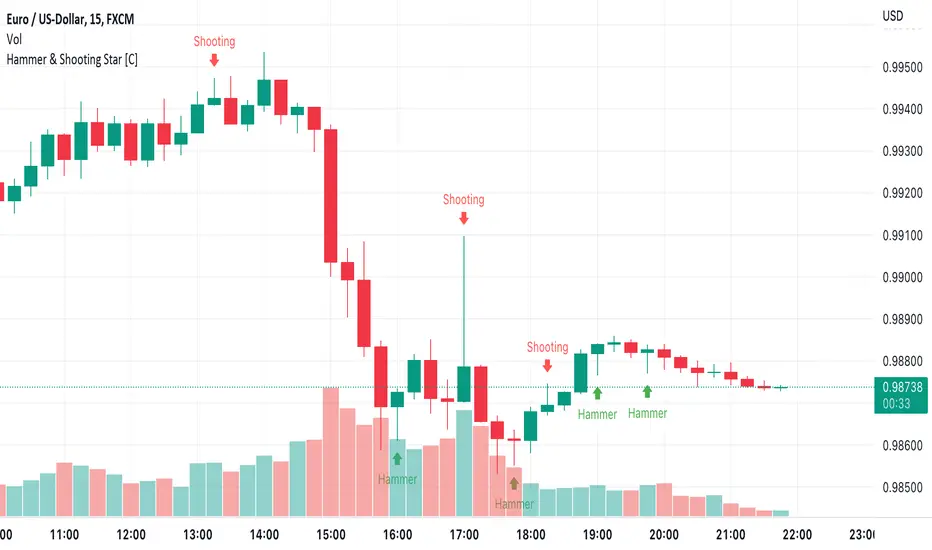
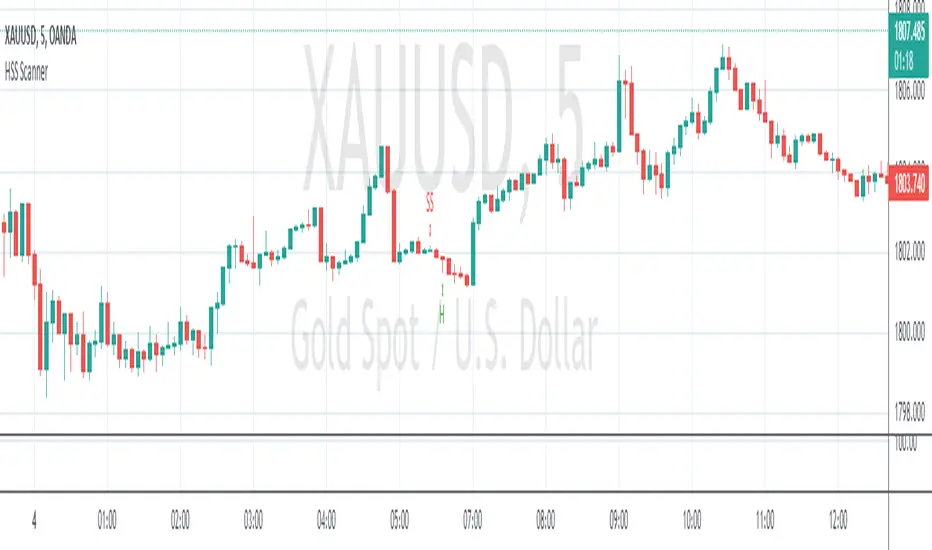
Single-candle patterns: Doji, Hammer, Hanging Man, Inverted Hammer, Shooting Star.
Two-candle patterns: Bullish Engulfing, Bearish Engulfing, Bullish Harami, Bearish Harami, Piercing Line, Dark Cloud Cover.
Three-candle patterns: Morning Star, Evening Star, Three White Soldiers, Three Black Crows.
Pattern logic
Candle anatomy is computed from body, upper wick, lower wick, and full range on each bar. The wick-to-body ratio threshold is configurable — default 2.0x means the shadow must be at least twice the body size for hammer and shooting star shapes. The Doji threshold is expressed as body size as a percentage of the full range, defaulting to 10%.
Engulfing patterns require the current candle to fully contain the prior candle's body. Harami requires the current body to fit inside the prior range and be less than 60% of the prior body size. Piercing Line requires the close to cross above the midpoint of the prior bearish candle; Dark Cloud Cover requires the close to cross below the midpoint of the prior bullish candle.
Morning and Evening Star use a three-bar setup: a strong directional candle, followed by a small-body indecision candle (body less than 30% of its range), followed by a confirmation candle that closes past the midpoint of the first candle.
Three White Soldiers and Three Black Crows require three consecutive same-direction closes, each higher/lower than the last, with the opens gapping slightly into the prior body.
Trend filter
An EMA crossover (default 20/50) determines trend direction on the current timeframe and three configurable higher timeframes via request.security(). With-trend signals are displayed at full opacity; counter-trend signals are shown at reduced opacity. An optional filter hides counter-trend patterns entirely.
MTF Trend Panel
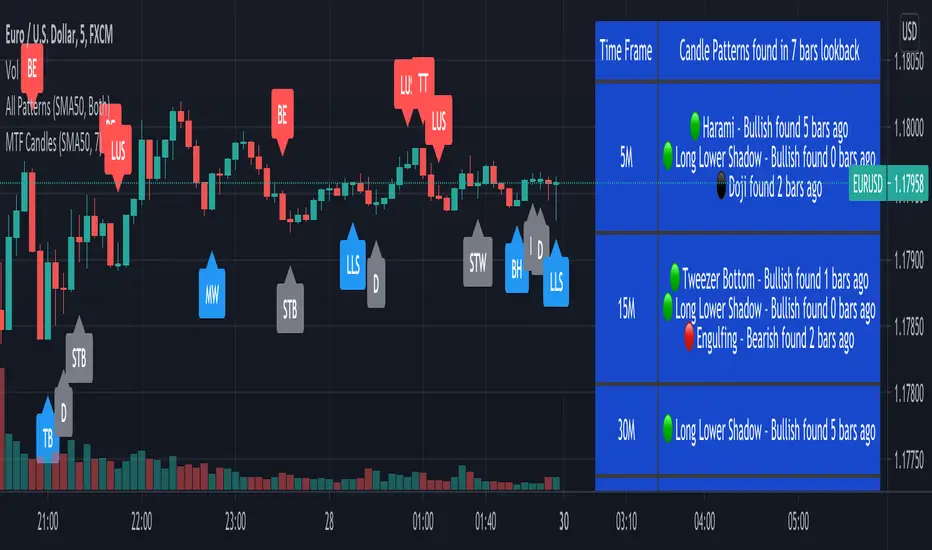
A compact table in the bottom-right corner shows the current trend direction (▲ Bull / ▼ Bear) across the current timeframe plus the three configured higher timeframes, with the EMA pair displayed as a label. Each cell is color-coded green or red.
Display
Each detected pattern places a label above (bearish) or below (bullish) the candle with the pattern name. A subtle background color fill highlights the bar. Both label colors and background highlights are independently configurable.
Works on any instrument and timeframe.
Chỉ báo