TF: Smooth Trend Follower with Volume Sparks (STF)TradingFlow: Smooth Trend Follower with Volume Sparks (STF)
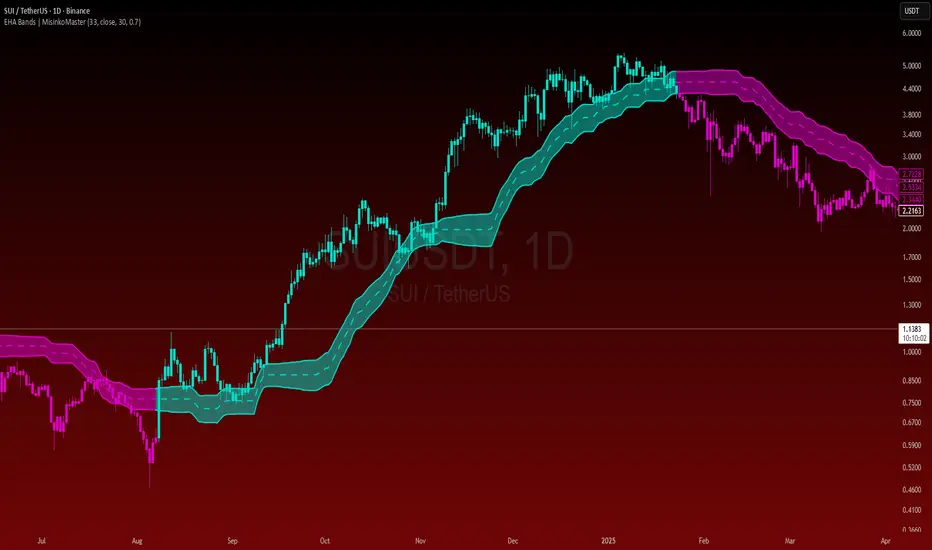
STF keeps the active trend visible with a trailing dotted line and a soft shadow between the line and price. Optional Volume Sparks add a second gradient that brightens when volume becomes unusually active during the trend.
Use STF to read trend direction, follow pullbacks toward the trailing boundary, and spot changes in market participation without adding more panels to the chart.
The Trend Line
• Smoothed range distance: STF smooths each bar's high-low range with a Hull moving average. This creates a responsive price distance while filtering short-term noise.
• Fixed or adaptive factor: the range distance is multiplied by the Base Factor. With ATR adaptation enabled, the factor rises or falls with current ATR relative to its average, within the selected minimum and maximum limits.
• Trailing bands: upper and lower bands ratchet behind price. A close through the opposite band changes the trend direction.
• Visual offset: the dotted line and start marker can be moved away from candles by an ATR-based distance. The offset changes the display, not the trend calculation.
Reading STF
• Green line below price: an active uptrend. Pullbacks toward the line show how closely price is testing the trailing boundary.
• Red line above price: an active downtrend. Rallies toward the line show the same test from the opposite direction.
• Start marker: a circle marks a confirmed direction change at the close of the bar.
• Trend shadow: the pale fill makes the distance between price and the active boundary easy to see.
When price and the line move together with a steady gap, the trend is progressing cleanly. A fast move back toward the line deserves attention, especially near a prior high, low, breakout level, or other visible structure.
Volume Sparks
Volume Sparks rank each bar's volume within the selected lookback. Because the reading is relative, it adapts to the symbol and timeframe automatically.
• Sparks mode: highlights bars above the selected volume percentile. The strongest readings produce the brightest pulses.
• Continuous mode: keeps a light participation layer visible and varies its intensity with the volume rank.
• Gradient: the pulse is strongest at the dotted trend line and fades toward price. Green or red continues to show trend direction; brightness shows volume intensity.
Volume Sparks measure activity, not trade direction. Read a bright pulse together with the candle and nearby structure. On symbols with missing, sparse, or unchanging volume, the layer switches itself off while STF continues normally.
A Simple Reading Process
1. Read the line's color and position to establish the current direction.
2. Check whether price is extending, tracking the line, or pulling back toward it.
3. Use a Volume Spark to locate bars where participation expanded.
4. At a direction change, compare the confirmed marker with nearby price structure.
5. Set the alert that matches the trend event you want to follow.
---
TradingFlow: Smooth Trend Follower with Volume Sparks (STF)
STF 用一條會跟著趨勢推進的虛線,加上價格與虛線之間的淡色陰影,讓目前方向一眼就能看懂。開啟 Volume Sparks 後,趨勢區內會多一層量能漸層;成交量明顯升溫時,顏色也會跟著變亮。
STF 適合拿來看趨勢方向、觀察價格拉回追蹤線的深度,也能直接在主圖上看到量能何時突然放大,不必一直切換到副圖。
趨勢線
• 平滑波幅: 先用 Hull 移動平均處理每根 K 棒的高低差,濾掉短線雜訊,同時保留對波動變化的反應速度。
• 固定或自適應倍數: 平滑波幅會乘上 Base Factor。開啟 ATR 自適應後,倍數會跟著目前 ATR 相對於平均 ATR 的高低調整,並限制在設定的上下限之間。
• 追蹤軌道: 上、下軌道會沿著價格單向推進。收盤價穿過另一側軌道時,趨勢方向切換。
• 視覺偏移: 可用 ATR 距離把虛線和起始圓點移離 K 棒。這項設定只改變畫面,不會改變訊號。
STF 怎麼看
• 價格下方的綠色虛線: 目前是上升趨勢。價格拉回虛線時,可以直接看出這次回測有多深。
• 價格上方的紅色虛線: 目前是下降趨勢。反彈靠近虛線時,也是同樣的觀察方式。
• 起始圓點: K 棒收盤確認方向切換後,圓點會標出新趨勢的起點。
• 趨勢陰影: 淡色區塊把價格到追蹤線的距離直接畫出來。
價格和虛線維持穩定距離、一起往同一方向推進,通常是比較順的走法。價格快速回到虛線附近時,就要多看一眼,尤其是剛好碰到前高、前低、突破位或其他明顯結構的位置。
Volume Sparks(量能脈衝)
量能脈衝會把每根 K 棒的成交量放進指定回看區間,計算它目前落在哪個百分位。用相對排名取代固定數字後,不同商品和週期都能用同一套邏輯判讀。
• Sparks 模式: 只有成交量超過設定的百分位門檻才會亮起。排名越高,脈衝越明顯。
• Continuous 模式: 持續保留一層淡淡的量能顯示,再依成交量排名調整深淺。
• 漸層方向: 顏色在虛線附近最強,往價格方向逐漸淡出。綠色和紅色負責表示趨勢方向,亮度則表示量能強弱。
量能脈衝看的是活躍程度,不是買賣方向。看到明顯脈衝時,搭配當根 K 棒和附近結構一起看就好。遇到沒有成交量、資料太零散或成交量長期不變的商品,這一層會自動隱藏,STF 趨勢線照常運作。
實際看圖流程
1. 先看虛線顏色和它在價格的哪一側,確認目前方向。
2. 看價格是在加速遠離、沿著虛線推進,還是拉回測試虛線。
3. 量能脈衝亮起時,留意參與度放大的 K 棒。
4. 方向切換時,把收盤確認圓點和附近價格結構放在一起看。
5. 依照想追蹤的事件設定提醒。
---
TradingFlow: Smooth Trend Follower with Volume Sparks (STF)
STFは、トレンドを追う点線と、価格との間を埋める薄いシェードで現在の方向を見やすくします。Volume Sparksをオンにすると、トレンド領域に出来高のグラデーションが重なり、普段より商いが活発なバーが明るく表示されます。
トレンド方向、ラインへの押し・戻り、出来高の盛り上がりをメインチャートだけでまとめて確認できます。
トレンドライン
• 平滑化した値幅: 各バーの高値と安値の差をHull移動平均でならし、細かなノイズを抑えながら値動きの変化を捉えます。
• 固定または適応ファクター: 平滑化した値幅にBase Factorを掛けます。ATR適応をオンにすると、現在のATRと平均ATRの比率に合わせてファクターが動き、設定した上下限の範囲に収まります。
• トレーリングバンド: 上下のバンドは価格の後ろを一方向に追います。終値が反対側のバンドを抜けると、トレンド方向が切り替わります。
• 表示オフセット: ATRベースの距離で点線と開始マーカーをローソク足から離せます。変わるのは表示位置だけで、シグナルには影響しません。
STFの見方
• 価格の下にある緑の点線: 上昇トレンドです。押しがラインへどこまで近づいたかを確認できます。
• 価格の上にある赤の点線: 下降トレンドです。戻りがラインへ近づく場面も同じように見ます。
• 開始マーカー: 終値で方向転換が確定すると、丸印が新しいトレンドの始まりを示します。
• トレンドシェード: 価格とトレーリングラインの距離を薄い色で表示します。
価格とラインが一定の間隔を保ちながら同じ方向へ進むと、トレンドの流れがつかみやすくなります。価格が急にラインへ戻る場面では、直近の高値・安値やブレイク水準など、周辺の値動きも合わせて確認します。
Volume Sparks(出来高ハイライト)
出来高ハイライトは、各バーの出来高が設定した期間内でどの水準にあるかをパーセンタイルで表示します。固定値ではなく相対順位なので、銘柄や時間足が変わっても同じ考え方で使えます。
• Sparksモード: 出来高が設定したパーセンタイルを超えたバーだけを強調します。順位が高いほど明るくなります。
• Continuousモード: 薄い出来高レイヤーを常時表示し、順位に合わせて濃さを変えます。
• グラデーション: 点線の近くで最も濃く、価格へ向かって薄くなります。緑と赤はトレンド方向、明るさは出来高の強さを表します。
この表示が見ているのは出来高の活発さです。強く光ったバーは、そのローソク足と周辺の値動きと合わせて読みます。出来高がない、データがまばら、または出来高が変化しない銘柄では自動的に非表示になり、STFのトレンドラインはそのまま動作します。
基本の見方
1. 点線の色と位置から現在の方向を確認します。
2. 価格がラインから離れているか、ラインに沿っているか、ラインへ戻っているかを見ます。
3. 出来高ハイライトが強まったバーで、市場参加が増えた場所を確認します。
4. 方向転換では、終値確定のマーカーと周辺の価格構造を合わせて見ます。
5. 追いたいトレンドイベントに合わせてアラートを設定します。
Chỉ báo