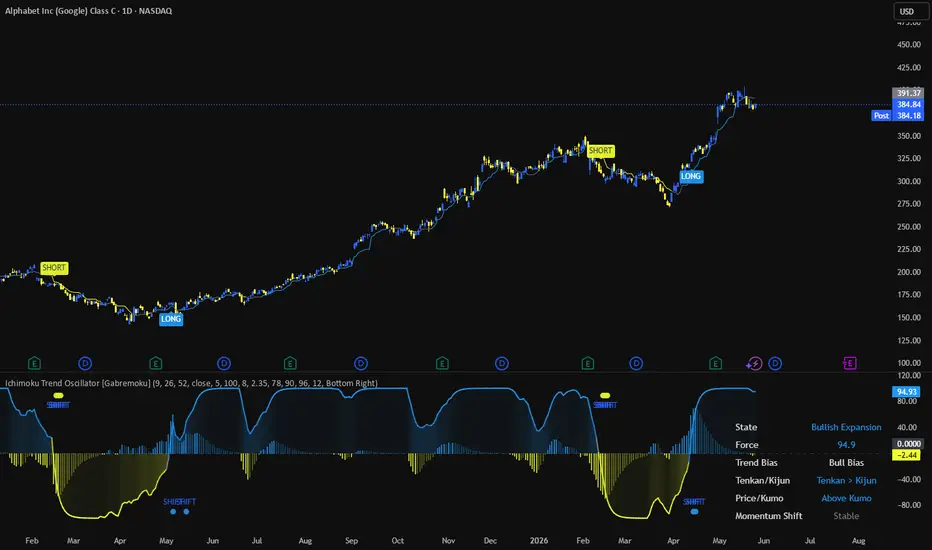
Ichimoku Structural StretchThe point of this script is simple. If we think of Ichimoku as assessing momentum from and away from an underlying equilibrium, then how might we look at the chart and spot the underlying phenomenon of a serial equilibrium displacement .
Price is being pulled away from the fast equilibrium while the fast equilibrium itself is displaced from the slower equilibrium. That's what this oscillator measures.
The is not an RSI or a generic momentum. No attempt to tell you whether to buy. Just a visual summary of the Ichimoku system as a checklist for yourself.
The signal magnitude is basically ((P-T)/ATR) X (1 + |T - K|/ATR). The percentiles tell you if this is unusually large compared with this stock’s own history or not?
Chỉ báo