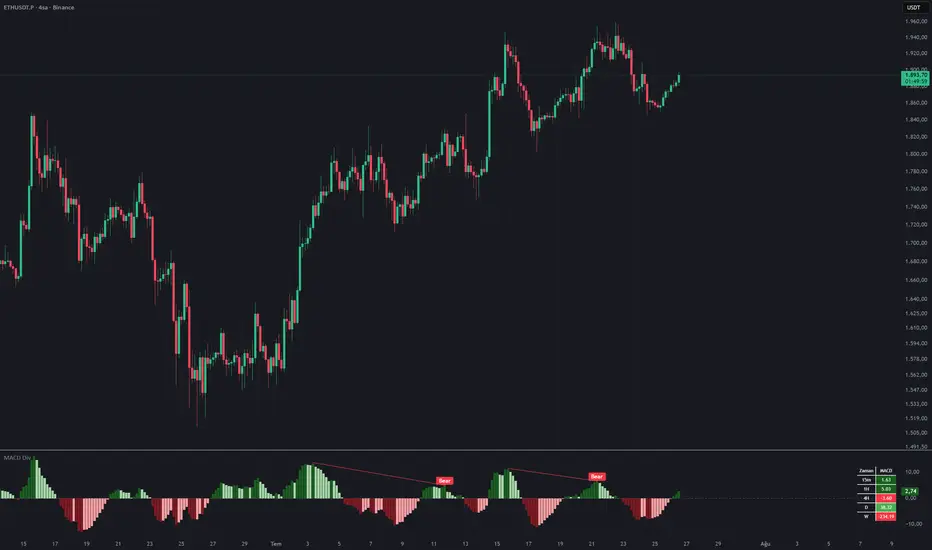
MACD with HTF Panels [theUltimator5]This indicator uses the standard MACD signal and displays it on multiple timeframes off to the side of the chart as separate panels. It allows you to view up to 5 (current + 4) separate timeframes at once without changing the chart timeframe.
The core of this indicator is a normal MACD. Line, signal, and histogram, fully adjustable lengths, four-way histogram coloring based on sign and slope so you can read momentum shifts at a glance.
Alongside it, the indicator draws up to four independent higher-timeframe panels directly in the pane. Each panel is a self-contained mini-chart: recent candles (if enabled) plus that timeframe's own MACD line, signal, and histogram.
The default settings show (4) HTF panels, that are automatically set based on what the current chart timeframe is. The HTF panels can be manually adjusted as desired.
The number of HTF panels can be adjusted between 0 and 4. 0 panels is set by disabling the "Show HTF panels" option in the settings. Disabling the HTF panels simply makes this indicator appear as a standard MACD, which isn't unique and can probably be found in 1000 other indicators elsewhere.
The uniqueness comes from the HTF panels on the side.
The panels settings will match for all timeframes.
When there are between 1 and 3 HTF panels enabled, they will appear vertically stacked on each other.
The following image shows (3) panels stacked.
When 4 panels (default) is selected, the stack is 2x2.
The chart price candles can be enabled in the settings to show the candles overlaid on the MACD signals for a complete picture. These are disabled by default to reduce visual clutter.
Here is an image showing (4) panels with chart candles enabled within the panels.
The scaling and position of the panels can be adjusted in the settings.
The vertical scaling is based on ATR, so the height of the candles is always proportional to the chart itself.
The horizontal position is calculated in bars, so it can be shifted left or right relative to the current bar.
Finally, there is a table (default position = bottom right)
The table shows the values of the MACD, Signal, and Histogram for all (4) HTF panels. The table position and size can be modified, but it will always show all (4) HTF panel values. If you have only one HTF panel enabled, it will still show you all values. The Histogram column changes color based on the color of the HTF histogram for that timeframe to give a better visual representation of the signal.
This indicator was made to showcase the method for converting custom signals into HTF side panels for custom and complex indicators. The logic used in this indicator can be used on any plotting indicator to display the signals off to the side.
Chỉ báo