SIGMA Trading Floor Ema ScannerEMA COMPRESSION SCANNER, USES RSI, VOLUME AND EMA TO GIVE PROPER BREAKOUTS ENTRY. Its is best for swing trading and day trading.Chỉ báocủa sagar_mehta11
Pro AVWAP Structure Suite - Clean Distance DirectionPro AVWAP Structure Suite - Clean Distance Direction is a clean anchored VWAP structure indicator designed for traders who want AVWAP context without losing focus on candlesticks and price action. The script includes multiple AVWAP groups: 1. Core AVWAPs: - WTD AVWAP - MTD AVWAP - QTD AVWAP - YTD AVWAP - IPO AVWAP 2. Session / Range Levels: - Today’s AVWAP - Today’s High - Today’s Low - Previous Day High - Previous Day Low - This Week High - This Week Low 3. Historical Event AVWAPs: - COVID High - COVID Low - GFC Low - Dotcom Low - April Tariff Low - March 2026 Low 4. Rolling Daily AVWAP Anchors: - 10D - 20D - 50D - 100D - 150D - 200D - 250D 5. Rolling Weekly AVWAP Anchors: - 10W - 30W 6. Structure / Event AVWAPs: - 52W High - 52W Low - YTD High - YTD Low - Swing High - Swing Low - Gap Up - Gap Down - Earnings Gap Proxy 7. Manual AVWAPs: - Manual 1 - Manual 2 - Manual 3 The indicator includes a special visibility mode: - Show Lines + Labels - Labels Only - Lines Only - Hide All Labels Only mode is useful when you want a clean chart where candlesticks remain the main focus, while still keeping AVWAP values and distance information visible on the right side. Right-side AVWAP label boxes can show: - AVWAP name - AVWAP value - Distance percentage from current price - Direction arrow Direction arrow meaning: - ▲ = price is above the AVWAP - ▼ = price is below the AVWAP The label text can also use direction-based coloring: - Green = price above AVWAP - Red = price below AVWAP The indicator also includes optional historical touch markers. These are intentionally limited to selected important AVWAPs to avoid clutter: - Circle = YTD AVWAP touch - Diamond = IPO AVWAP touch - Square = 52W Low AVWAP touch Marker color meaning: - Green = candle closed above the touched AVWAP - Red = candle closed below the touched AVWAP Historical touch markers are OFF by default to keep the chart clean. A touch sensitivity setting and lookback control are included for historical AVWAP reaction study. The script also includes dark and light chart visibility settings, auto colors, softer line transparency, and auto-contrast label boxes for better readability. This indicator is designed as a visual structure and price-action support tool. It does not generate buy or sell signals and should not be used as a standalone trading system.Chỉ báocủa PradeepAlphaTrader5
NDX Monthly MA Env Signal Weekly ExecutionNDX Monthly MA Env Signal Weekly Execution A trend-following strategy on the Nasdaq-100 that uses monthly envelope bands for entry timing, executed on the weekly chart. How It Works The monthly envelope: A 10-month simple moving average of NDX monthly closes defines the centreline. Top and bottom bands sit at ±5% from the median. Entry trigger: When the weekly close crosses above the monthly median (Launch), the strategy goes long. This captures the moment momentum shifts back into alignment with the monthly trend. Exit trigger: A 3% buffer below the bottom band — when the monthly low crosses under bottom × 0.97, the strategy exits (Eject). This buffer avoids noise-exits on shallow dips that barely graze the band, while still catching genuine breakdowns (e.g. it cleanly sidestepped the April 2025 selloff). All execution on the weekly timeframe — the strategy monitors monthly data but fires entries and exits as weekly crossovers, keeping it responsive without repainting. Performance Snapshot Metric Value Trades 22 (21 closed + 1 open) Win rate 76% Profit factor 25.2 Net return +201% Max drawdown −5.1% Avg win / avg loss 7.9:1 Why It Works on NDX The Nasdaq-100 has spent most of its history in a structural uptrend. This strategy stays long during the grind higher and only exits when price materially violates the lower envelope — filtering out routine pullbacks while preserving capital during genuine corrections. The 5% band width and 3% exit buffer were tuned specifically for NDX's monthly volatility profile. Usage Chart: Apply to NASDAQ:NDX on the 1M timeframe for the envelope visualisation. Entry/exit signals appear on all timeframes since they reference weekly data. Alert integration: The 🚀 Launch and Eject order labels can be wired to TradingView alerts for notification-only execution. Timeframe note: The strategy uses process_orders_on_close=true — all entries and exits fire on the weekly close, not intra-week. Risk disclaimer: Past performance does not guarantee future results. This strategy is designed for the NDX's historical behaviour; regime changes (e.g. sustained bear markets) will underperform buy-and-hold. Not financial advice.Chiến lượccủa Showa_no_booCập nhật 2261
Standing Wave Phase Coherence [JOAT]STANDING WAVE PHASE COHERENCE A phase-coherence engine that asks a question almost no public indicator can answer: are the LTF and HTF oscillators in phase or out of phase ? Two oscillators that move together (peaks and troughs aligned) form a standing wave — a state of constructive interference where the trend is amplified. Two oscillators that move opposite (peaks aligned with troughs) form an anti-standing wave — a state of destructive interference where a reversal is forming. Standing Wave Phase Coherence measures phase, computes the coherence between the two timeframes, and surfaces a single number bounded in that tells you which regime you are in. Phase, not just direction A moving average tells you "where price is sitting". A momentum oscillator tells you "which way it is moving". Phase is the location inside the cycle — are we approaching a peak, leaving a peak, approaching a trough, leaving a trough? Two oscillators on different timeframes can be: In phase — both rising or both falling at the same rate of cycle progression. Constructive interference. Trend amplifies. Anti-phase — one rising, the other falling at the same cycle rate. Destructive interference. Reversal forms. Decoherent — phases are uncorrelated. The wave structure is breaking down. No directional edge from coherence. The script estimates phase from each timeframe's RSI series (both legs at the same RSI length for fair comparison), differences the phase smoothly, then takes the cosine of the phase difference — which is exactly the quantum-mechanical coherence metric on a scale. Non-repainting HTF construction The HTF leg uses request.security with lookahead_on AND a offset on the expression — the only non-repainting form per Pine v6 docs. This is exposed as a toggle but ON by default; the warning in the input tooltip explains the trade-off (turn off only for research, never live). Three thresholds, three states Coherence > +0.70 (configurable) — IN PHASE . Standing wave constructive. Trend amplifies. Bull-palette background tint. Coherence < −0.70 — ANTI PHASE . Standing wave destructive. Reversal forms. Bear-palette background tint. |Coherence| < 0.30 (decoherent band) — DECOHERENT . No standing wave. Mid-palette neutral. In between — transitional. Phase-status arrows print inside the pane at every regime entry, so the chart history shows when each standing wave formed and collapsed. Visual system Coherence line with configurable width. Glow halo — a wider semi-transparent copy of the coherence line below the main line, creating a soft glow effect. Background tint by phase status — bull when IN PHASE, bear when ANTI PHASE, none when decoherent. Transparency configurable. Threshold lines at ±0.70 (toggleable). Zero line . Fill between threshold and ±1 — soft bull / bear fill highlights the active phase zone so it is immediately obvious which side is engaged. Phase status arrows inside the pane on state transitions. The pane uses the JOAT default palette (cyan-teal bull / magenta bear). Amplification factor A separate EMA-smoothed trend amplification factor is computed from the coherence and surfaced in the dashboard. When coherence is sustained high (in-phase), the amplification factor rises — quantifying how much the LTF/HTF agreement is reinforcing the move. Useful as a position-sizing input: bigger amplification = stronger conviction = larger size. Dashboard Monospaced table, positionable to any of nine corners. Surfaces: Current coherence value and bar age. Phase status (IN PHASE / ANTI PHASE / DECOHERENT) with glyph. LTF and HTF RSI values. Phase difference in radians and degrees. Trend amplification factor (smoothed). HTF timeframe in use with non-repaint flag. Alerts Multiple alert conditions: Coherence crosses above +0.70 (IN PHASE entry) Coherence crosses below −0.70 (ANTI PHASE entry) Coherence returns to decoherent band Sustained IN PHASE (held above threshold for N bars) Sustained ANTI PHASE How to read it Three reads, in order of conviction: Sustained IN PHASE — the highest-conviction trend read. LTF and HTF oscillators are decisively moving together. This is the regime in which momentum tools have their largest edge. Entry into ANTI PHASE — the reversal warning. The two timeframes have rotated opposite each other; whichever direction LTF is moving, HTF is opposing. Often precedes meaningful reversals. Decoherent zone — stand-aside signal. The wave structure has broken down. Coherence-based reads are not actionable; switch to a regime-classification tool (FDI, Hurst, Entropy). The cleanest workflow: only take trend trades when IN PHASE; only take reversal trades when ANTI PHASE; do nothing when DECOHERENT. Suggested settings Defaults (RSI 14, HTF 4H, phase smoothing 3, coherence smoothing 8, ±0.70 thresholds, ±0.30 decoherent band) are tuned for 15m–1H charts. The HTF should always be greater than or equal to the chart timeframe; mismatching produces meaningless phase reads. For HTF (4H+ chart timeframes) raise HTF to Daily and consider the LTF/HTF coherence as a daily-vs-weekly read. Originality The implementation — the dual-timeframe RSI phase estimator, the smoothed phase-difference cosine coherence (quantum-style metric), the non-repainting HTF request with -offset + lookahead_on pattern, the three-threshold phase classifier with decoherent band, the trend amplification factor formulation, the glow-halo line render, and the pane-overlay phase-status arrows — is JOAT-original. No third-party code reused. The notion of phase coherence between timeframes as a market regime metric is the original quantitative contribution, borrowed conceptually from optical and quantum physics. Limitations Phase estimation from discrete bar data is inherently noisy on short windows; the smoothing inputs (phase EMA and coherence EMA) exist to address that — over-smoothing destroys phase information, so the defaults are intentionally light. The HTF request is non-repainting in the useStrictHtf = ON configuration; do not turn it off in live trading. The decoherent band is a heuristic to avoid acting on noise reads; widen it on instruments with naturally choppy oscillator structure. — -made with passion by jackofalltrades Chỉ báocủa officialjackofalltrades23
bankstersOverview & Synergistic Concept Banksters Workspace is a multi-component trading framework designed to combine structural market levels, momentum divergence tracking, and dynamic trend filtering into a single, cohesive workspace. Instead of cluttering the chart with standalone scripts, this tool integrates three distinct non-redundant methodologies to help a trader identify institutional breakouts, overbought/oversold turning points, and the path of least resistance (the core trend). 1. Structural Levels (Breakouts & Retests): Automatically detects significant Swing Highs and Swing Lows using customizable pivot lookbacks. When price breaks these structural points with an impulse expansion (validated by a minimum candle body percentage), a temporary key level is generated. The script monitors this level for either a false breakout (invalidating the line) or a valid retest within a defined buffer zone. 2. Momentum Divergences (MFI & Stochastic): Utilizes the Money Flow Index (MFI) to measure volume-weighted price momentum. By comparing recent MFI peaks/troughs with actual price action across adaptive lookback periods, the script isolates hidden and regular divergences. To prevent premature entries, signals are filtered through a Stochastic Oscillator to ensure they occur strictly within overbought or oversold territories. 3. Dynamic Trend Filtering (EMA Ribbon): Implements a flexible Exponential Moving Average (EMA) matrix (defaulting to 9, 20, 50, 100, and 200 periods). How the Components Work Together The system is built on a "Filter, Trigger, Structure" synergy: * The Filter (EMA): The 200 EMA and 50 EMA act as the ultimate trend filters. Traders should prioritize bullish structural breakouts when price is trading above these moving averages and bearish breakouts when below. * The Structure (Banksters Levels): Defines the exact execution zones. An impulse break through a level shows market intent, while a subsequent retest provides an optimal risk-to-reward entry point. * The Trigger (MFI Divergence): When a price retests a key structural level, an accompanying MFI bullish or bearish divergence serves as the ultimate exhaustion trigger, confirming that institutional order flow is defending the level. Interface Customization To ensure a clean charts workflow, the user interface features master toggles to completely enable or disable individual modules. All styling properties (colors, line widths, and plot shapes) have been offloaded to the native TradingView "Style" tab for seamless visual customization. --- Описание на русском языке / Russian Description Banksters Workspace — это комплексный инструмент, объединяющий три независимые торговые методики для определения институциональных уровней, импульсных пробоев и зон истощения тренда. Chỉ báocủa Bank_sters47
OI+CVD+Ichimoku PRO StrategyOI+CVD+Ichimoku PRO Strategy is a comprehensive trading system that combines classic trend-following mechanics with real-time institutional Order Flow analysis. This strategy is designed to filter out market noise and capture high-probability momentum moves by validating technical crossovers with actual market money flow. 💡 Core Concept The strategy operates on a three-tier confirmation system: Trend Cloud (EMA Cloud): Utilizes a fast and slow EMA (default 13/25) to create a visual "cloud." This indicates the primary momentum; price above the cloud suggests a bullish bias, while price below suggests a bearish bias. Order Flow Filter (OI + CVD): This is the engine of the strategy. It monitors the Open Interest (OI) and Cumulative Volume Delta (CVD) from the exchange. By requiring a positive/negative threshold for these metrics, the strategy ensures that price breakouts are backed by actual capital inflows, significantly reducing false signals in sideways markets. Adaptive Risk Management: Features an integrated exit system with support for both ATR-based (volatility-adjusted) and fixed-percentage Stop Losses. It also supports tiered Take Profit levels (TP1/TP2) to allow for partial profit-taking. ⚙️ Customizable Settings Users have full control over the strategy via the settings panel: EMA Settings: Customize the speed of the trend cloud to suit your timeframe. Order Flow Settings: Fine-tune the OI Min Change Threshold and CVD Smoothing Period to filter out weak volatility and focus only on significant market moves. Stop Loss & Take Profit: Choose between ATR-based (dynamic) or fixed (%) stops. Configure 1 or 2 Take Profit levels to automate your trade management. 🚀 Key Advantages Clean Visualization: Real-time plotting of entry points, Stop Loss levels, and multiple Take Profit targets directly on your chart. Data-Driven Entries: Avoids "fakeouts" by requiring institutional participation (OI/CVD confirmation) alongside technical crossovers. Versatility: Perfectly suited for high-liquidity crypto futures markets (e.g., BTC/USDT) where Open Interest data is available. 📖 How to Use Add the strategy to your chart. Adjust the OI Threshold in the settings to filter out minor market fluctuations based on your preferred asset's volatility. Monitor the EMA Cloud color: Blue indicates a bullish trend, Red indicates a bearish trend. Only enter positions when the EMA crossover aligns with the Order Flow filter status. Disclaimer: This tool is for educational purposes only. Trading financial markets involves high risk. Always backtest strategies on historical data and manage your risk carefully before using them on a live account. Pro-Tips for your TradingView publication: Visual Proof: Include a screenshot of the strategy showing a clear trend where the Order Flow filter successfully blocked a false signal. Tags: Use relevant tags like: #trendfollowing #orderflow #openinterest #cvd #ichimoku #cryptotrading #futures #algoritmictrading #momentum #btc Recommended Timeframes: Mention that this strategy works best on 5m, 15m, or 1h timeframes for the best balance between signal frequency and accuracy.Chiến lượccủa egoigor1976Cập nhật 20
FTNS Masters System v6 UltimateFTNS Masters System v6 Ultimate This indicator is the ultimate hybrid trading system designed for active day traders. It seamlessly integrates the core mechanics of the FTNS Strategy (Phase, Direction, Volume, and Momentum) with the highly acclaimed visual elements and indicators from the THV System. Equipped with a built-in multi-vector matrix and an elegant HUD dashboard, this script eliminates screen clutter by consolidating multiple separate indicators into a single, cohesive overlay script. It also features a dual-mode engine, allowing you to switch between conservative Trend Following and aggressive Counter-Trend trading setups with a single click. Key Features & Components: Multi-EMA Phase Recognition Tracks market structure using 4 specific Moving Averages (62 EMA, 144 EMA, 200 SMA, 800 SMA) to instantly classify the environment into an Up-Trend (Bull), Down-Trend (Bear), or Sideways Range. Heiken Ashi Smoothed (Direction) Filters out market noise using a double-smoothed calculation (SMMA followed by LWMA). It replaces standard candles to give you a clear, unpolluted view of the immediate market direction. Better Volume Spike Detection Monitors volume activity to catch institutional spikes. The system requires an influx of volume (configurable multiplier) to validate high-probability setups. ADX Momentum Filter Ensures that you never jump into a stagnant market. Signals are filtered by Average Directional Index (ADX) criteria to guarantee strong momentum is present at the time of the cross. Integrated THV Trix Oscillator Status Incorporates the essence of the THV System's famous Trix indicators (triple-smoothed EMAs). Instead of taking up extra sub-window space, the fast/slow Trix crossover status is calculated in the background and displayed in the HUD. Auto Pivot Lines (Targets & Key Levels) Automatically calculates and draws daily Pivot Points (P, R1, R2, S1, S2) using a clean step-line style. These serve as institutional price magnets, primary profit targets, and key rejection levels. Two Dedicated Trading Modes: You can toggle the system behavior instantly via the settings menu: Trend Follow Mode (Default): Generates high-probability breakout and continuation signals (Solid Triangles) when the major MA phase, Heiken Ashi color change, ADX direction, and a recent volume spike completely align. Counter Trend Mode (Advanced): Designed for range-bound markets or fading overextended trend exhausts. It flags sharp reversal entry points (Hollow Arrows) when the price tests daily Pivot support/resistance lines (R1/R2/S1/S2) simultaneously with a Heiken Ashi color flip and a THV Trix momentum turn. Real-Time HUD Dashboard: The compact, semi-transparent table on the top-right corner tracks all 5 dimensions of the market condition concurrently: Selected Mode: Displays whether you are looking for TREND or COUNTER setups. MA Phase: Displays BULL, BEAR, or RANGE. Heiken Ashi: Displays immediate trend color status (UP / DOWN). Better Vol: Warns you with a "SPIKE!" notification when unusual volume enters. ADX Force: Shows if directional momentum is sufficiently strong. THV Trix: Displays the background Trix oscillator crossover direction. Dynamic Alert Conditions Included: Fully optimized for automated notifications. You can easily set up alerts for: Trend Follow Buy / Sell Signals Counter Trend Support / Resistance Reversals Disclaimer: This script is published for educational and analysis purposes only. Past performance is not indicative of future results. Trading foreign exchange and financial instruments involves significant risk. Always practice strict risk management. Chỉ báocủa FX_Shokunin19
Moving Average Structure MatrixMoving Average Structure Matrix is not a basic multi-MA ribbon. The moving-average lines are only the visible base layer. The main contribution is a neutral MA structure layer that quantifies how the enabled moving averages are ordered, clustered, twisting, and positioned relative to the selected source. This script is designed for traders who want quick structural context from multiple EMA/SMA lines without relying only on visual inspection. It is a context and visualization tool only. It does not provide trade-action instructions and it is not a trading system. What it shows - Up to 8 user-configurable EMA/SMA slots. - A moving-average ensemble centerline. - The high and low boundary of the enabled MA group. - Optional fill between the MA bundle boundaries. - A compact context table. - Optional factual event labels. - Neutral alert conditions for structure changes. The MA lines are useful visually, but the structure layer is the main feature. Core structure fields Pairwise Stack Score The script compares enabled moving averages pair by pair. For each pair with different lengths, the shorter-length MA is treated as the faster MA and the longer-length MA as the slower MA. If the faster MA is meaningfully above the slower MA, the pair contributes positively. If the faster MA is meaningfully below the slower MA, the pair contributes negatively. If the pair is too close to classify, it contributes as tied. The Stack Score summarizes this pairwise ordering on an approximate -100 to +100 scale. A positive Stack Score means shorter MAs are generally above longer MAs. A negative Stack Score means shorter MAs are generally below longer MAs. A value near zero means the group is mixed or tied. Order Purity Order Purity measures how much of the eligible pairwise structure agrees with the dominant side. For example, a high positive Stack Score with high Order Purity describes a cleaner upward ordering of shorter and longer averages. A mixed pair structure will usually show lower purity. Order Purity is descriptive only. It is not a forecast or a trade instruction. Tie Ratio Tie Ratio measures how many eligible MA pairs are too close to classify after applying the stack-separation threshold. A higher Tie Ratio means more of the MA group is structurally tied or compressed into similar values. Slope Consensus Slope Consensus measures how many enabled moving averages are rising, falling, or flat over the selected slope lookback. Each enabled MA receives a slope sign: - rising - falling - flat The Slope Score summarizes the group on an approximate -100 to +100 scale. Bundle Width and Width Rank The script calculates the high and low values of the enabled MA group. Bundle Width measures the distance between those two boundaries. Bundle Width % expresses that distance relative to the MA centroid. Width Rank compares the current bundle width with its own recent history. This is a moving-average bundle context only. It is not a volatility regime and it does not forecast future movement. Width context can read as: - Clustered - Middle width - Wide bundle - n/a Twist Rate Twist Rate describes internal reordering of the MA group. For each eligible fast/slow pair, the script compares the current pair relationship with the previous bar's relationship. When a pair changes from one ordered side to the other, it counts as a twist. Twist Rate summarizes how much internal crossing or reordering has occurred over the selected lookback. This helps distinguish a clean MA structure from a churning or mixed MA group. Fast/Slow Cohort Spread The script can compare shorter-length and longer-length MA groups. The fast cohort contains shorter MAs. The slow cohort contains longer MAs. Cohort Spread % compares the average position of the fast cohort with the average position of the slow cohort. This gives a second view of the structure beyond individual pair comparisons. Source-vs-Bundle location The selected source can be: - Above bundle - Inside bundle - Below bundle - n/a The script also calculates Bundle Position %, which describes where the source sits relative to the current MA bundle. Values can be below 0 or above 100 when the source is outside the bundle. Structure State The script combines stack ordering, order purity, slope consensus, bundle width context, twist rate, and source location into a neutral state label. Possible states include: - Need 2+ MAs - Need different MA lengths - Warming up - Ordered upward - Ordered downward - Upward stack / mixed slopes - Downward stack / mixed slopes - Churning bundle - Clustered mixed bundle - Flat bundle - Transitioning upward - Transitioning downward - Intermixed These states describe the current MA structure. They do not imply continuation or reversal. Structure Age Structure Age counts how long the current structure state has persisted. The script uses distinct internal state IDs, so the age resets when the actual structure state changes, not just when broad direction changes. Structure Fingerprint The Fingerprint is a compact summary of the current MA structure. Example: O+ S+ Wm Pa A34 Meaning: - O+ means positive stack polarity. - O- means negative stack polarity. - O0 means no clear stack polarity. - S+ means positive slope consensus. - S- means negative slope consensus. - S0 means no clear slope consensus. - Wc means clustered width. - Wm means middle width. - Ww means wide bundle. - Wn means width unavailable. - Pa means source above the bundle. - Pi means source inside the bundle. - Pb means source below the bundle. - Pn means source location unavailable. - A shows the current structure age. The Fingerprint is a compact context summary. It is not a trade instruction. Structure Footprint The Footprint expands the context by combining: - Structure age - Previous state age - Width motion - Twist Rate - Order Purity - Tie Ratio This helps users read how the MA group is currently organized without relying only on line spacing. Context table The default context table is compact and placed in the upper-right area. Compact layout shows: - State - Fingerprint - Stack Score - Slope Score - Width / Twist - Price location - Structure Age Standard and Detailed layouts add more research fields, including: - Footprint - Order Purity - Tie Ratio - Twist Rate - Cohort Spread - Bundle Width % - Width Rank - Bundle Position % - Enabled MA count - Eligible pairs - Equal-length pairs skipped - Up / Down / Tied pair counts - Fast / Slow cohort counts - Centroid - Bundle high - Bundle low - Active warm-up bars - State ID - Enabled MA names Research fields are available in the Detailed context table without adding extra chart plots. The context table is the primary research surface. Events and labels Event labels are optional and off by default. When enabled, labels are factual and neutral. They describe events such as: - structure became ordered upward - structure became ordered downward - structure became intermixed - bundle entered churning context - bundle entered clustered width context - bundle left clustered width context - source moved above the MA bundle - source moved below the MA bundle - source crossed the MA centroid Event markers use capped labels rather than plotshape markers, so the script stays within TradingView's plot-count limit. Older labels are removed after the user-defined label cap is reached. Alerts The script includes factual alert conditions for the same structure events. Alerts respect the selected confirmed-bar behavior by default. Intrabar mode is available, but realtime values can update until the bar closes. Customization Users can adjust: - source - slope lookback - warm-up behavior - EMA/SMA type for each MA slot - length for each MA slot - color, width, transparency, and name for each MA slot - stack separation threshold - ordered stack threshold - order purity threshold - slope flat threshold - slope consensus threshold - width-rank lookback - clustered / wide width thresholds - twist lookback - churning twist threshold - cohort split length - automatic cohort split - event persistence - event cooldown - context table layout - context table position - table text size - table colors - marker colors - envelope colors - fill transparency Visual customization does not affect calculations. Most input values are hidden from the chart status line by default to keep the chart label compact. All inputs remain available in the Settings / Inputs tab. Different from other tools This script does not use ATR channels, session shading, volatility-regime classification, VWAP, volume weighting, or RSI slope divergence. It focuses only on the geometry of an enabled EMA/SMA ensemble. Limitations Moving averages lag by design. A clean MA structure does not guarantee continuation. A churning MA structure does not imply reversal. MA order can persist, unwind, or flip. Default lengths are common visual reference points, not optimized settings. Width and cluster context are descriptive of the enabled MA group and its own history. Changing enabled MAs, lengths, or thresholds changes the structure readings. This script is not financial advice and not a trading system. Japanese notes このスクリプトは単なる複数移動平均線ではなく、EMA/SMA群の並び、純度、近接度、傾きの一致、束の広がり、ねじれ、価格位置、状態の継続時間を構造として表示する可視化ツールです。売買判断や将来予測ではなく、MA群の現在の構造を把握するための補助として設計しています。Chỉ báocủa SG_GroupCập nhật 2
RSI Volume-Validated Overbought/OversoldRSI Volume-Validated Overbought/Oversold OVERVIEW This indicator combines a standard RSI with a volume validation layer. The core idea: an RSI reading in overbought or oversold territory does not by itself guarantee that price will decelerate or reverse — the move often needs participation (volume) behind it to be meaningful. This script accumulates volume while price sits inside an overbought or oversold RSI zone and only flags the episode once that accumulated volume reaches a defined threshold, distinguishing zones with real participation from zones with weak, low-volume RSI extremes that are more likely to be ignored by price. WHAT IT IS MADE OF 1. RSI Engine A standard RSI (configurable length and source) checked against two configurable levels: an overbought level (default 70) and an oversold level (default 30). 2. Volume Accumulator From the moment RSI enters an overbought or oversold zone, the indicator starts summing the volume of every bar for as long as RSI remains inside that zone. This running total resets to zero each time a new zone episode begins (i.e., each fresh entry into overbought or oversold after having been outside it). 3. Volume Threshold A simple moving average of volume (default length 20) multiplied by a user-defined factor (default 8) forms the validation threshold. This threshold is recalculated on every bar using current volume conditions. 4. Validation Logic The indicator continuously compares the accumulated zone volume against the threshold. The first bar where the accumulated volume reaches or exceeds the threshold — while RSI is still inside the zone — triggers the signal for that episode. Only one signal can fire per zone episode; once triggered, the indicator will not signal again until RSI exits the zone and re-enters it later. WHAT IT SIGNALS AND HOW - A green upward triangle below the bar marks a validated oversold episode (accumulated volume met the threshold while RSI was oversold). - A red downward triangle above the bar marks a validated overbought episode (accumulated volume met the threshold while RSI was overbought). - A label is plotted at the signal bar showing the exact accumulated volume figure for that episode, so the reader can see how much participation triggered the validation. - RSI readings that reach overbought/oversold but never accumulate enough volume before exiting the zone produce no signal at all. These "weak" episodes are intentionally left unmarked. HOW TO INTERPRET IT A signal does not mean "buy here" or "sell here." It means: at this point, price has been overbought/oversold for long enough, with enough volume behind that condition, that the RSI extreme is more likely to carry real weight. Historically, this tends to coincide with one of three outcomes: - Price decelerates and reverses direction. - Price decelerates and consolidates/pauses before continuing. - Price continues in the same direction, but at a reduced pace. The signal is a condition-strength marker, not a directional entry trigger. HOW TO USE IT Use this indicator as a filter or confirmation layer on top of your own analysis — for example, alongside support/resistance, structure, or other timing tools — to judge whether a given overbought/oversold reading is likely to matter. It is best suited as a heads-up that momentum may be about to change character, not as a standalone trigger for opening positions. LIMITATIONS - This indicator does NOT generate buy/sell entries. It only flags when a volume-validated overbought/oversold condition occurs. Any trading decision based on it requires additional confirmation and risk management from the user. - It does not predict the magnitude or exact timing of a reversal or deceleration — only that the condition has met a volume-based validation threshold. - The volume SMA and threshold factor are fully adjustable; results will vary significantly by asset, timeframe, and the chosen factor. Defaults shown here (SMA length 20, factor 8) were tuned through visual backtesting and may need re-calibration for other instruments or timeframes. - On instruments or data feeds where volume data is unavailable or unreliable (e.g., some spot forex feeds), the volume accumulation and threshold comparison will not function as intended. - This script does not repaint: each signal is generated and locked in on the bar where the volume threshold is met and does not change on historical bars after that point.Chỉ báocủa BullBearSR21
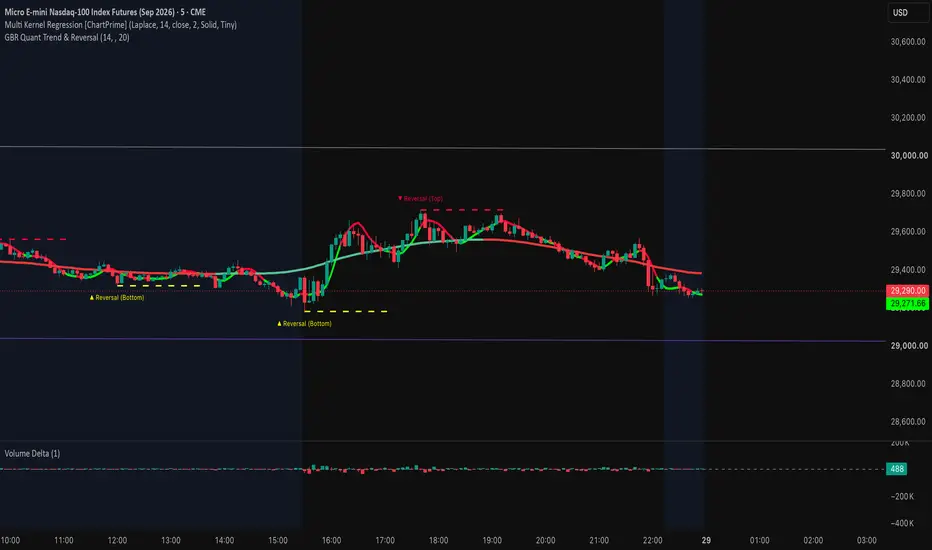
GBR Quant Trend & ReversalGBR Quant Trend & Reversal is a zero-noise, institutional-grade indicator built for prop firm traders and aggressive day traders. Unlike lagging kernel regressions, this dynamic ribbon is highly sensitive to real-time price action, getting you into the move earlier. 🔥 Core Features: Dynamic Trend Ribbon: Instantly shifts between UV Green (Bullish) and UV Red (Bearish) the moment price crosses the moving average band. Multi-Timeframe (MTF) Ready: Trade on a 5m chart while plotting a 1H or 4H trend ribbon to stay aligned with the macro order flow. Historical Reversal Zones: Automatically plots dashed UV lines at major structural pivot highs and lows. Use these visual markers to backtest past liquidity sweeps and identify future high-probability reversal zones. Clean UI: Stripped of unnecessary clutter. Just raw data and striking UV colors.Chỉ báocủa THEGBR49
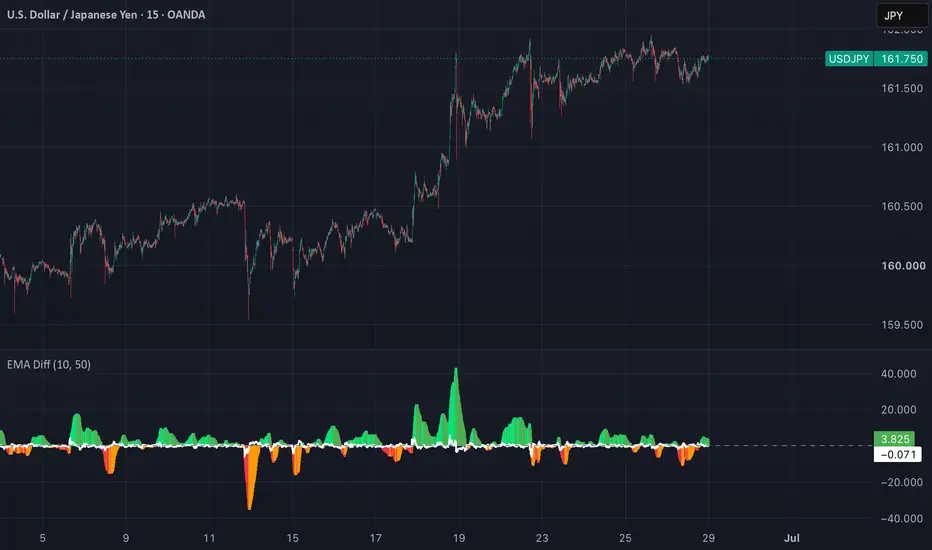
EMA Momentum DifferentialOverview EMA Momentum Differential visualizes both the distance between two Exponential Moving Averages (EMAs) and the rate at which that distance changes over time. While many moving average indicators focus on crossover events, this indicator continuously measures the relationship between a fast EMA and a slow EMA to provide additional context about trend momentum. The EMA spread is displayed as a histogram, while its first-order change (Momentum Differential) is plotted as a line, helping identify periods when directional momentum is strengthening or weakening. Values are automatically normalized into pip units for improved readability across both JPY and non-JPY Forex pairs. How It Works The indicator performs the following calculations: - Calculates a Fast EMA. - Calculates a Slow EMA. - Measures the spread between both EMAs. - Converts the spread into pip units. - Calculates the change in spread from the previous bar (Momentum Differential). - Displays the EMA spread as a histogram and the Momentum Differential as a line. Interpretation General observations may include: - Positive spread values indicate the fast EMA is above the slow EMA. - Negative spread values indicate the fast EMA is below the slow EMA. - An increasing Momentum Differential suggests the EMA spread is expanding. - A decreasing Momentum Differential suggests the EMA spread is contracting. - Momentum Differential crossing the zero line may indicate a change in the rate of trend expansion. This indicator is intended to provide additional context for momentum analysis and should not be interpreted as a standalone trading system. Inputs Fast EMA Length Slow EMA Length Notes EMA Momentum Differential is designed as an analytical tool for evaluating changes in EMA separation. It does not generate buy or sell signals and should be used together with broader market analysis and appropriate risk management. Disclaimer This indicator is provided for educational and analytical purposes only. Nothing contained in this publication should be interpreted as financial or investment advice. Past market behavior does not guarantee future results.Chỉ báocủa vertexalgo9
Volume Profile Supertrend [HexaTrades]Volume Profile Supertrend re-imagines the classic Supertrend. Instead of trailing bands built from pure volatility (ATR), it builds them around the levels where real volume has traded the Point of Control and Value Area. The philosophy is simple: a normal Supertrend follows volatility; this one follows where the market accepts value. Price tends to gravitate to, and trend away from, the zones where the most business gets done. By anchoring the trend engine to value migration, the indicator aims to stay on the right side of the move while filtering out a portion of low-quality volatility noise. Everything is computed internally in Pine; no built-in Volume Profile tool is used, so it works on any symbol and timeframe that has volume. 💡How it works 1. Rolling Volume Profile: It looks back over the last Profile Lookback bars, finds the high–low range, and divides it into Number of Rows price buckets. Every historical bar's volume is distributed across the buckets its range spans, producing a fresh volume distribution on every candle. 2. POC, VAH & VAL: POC (Point of Control) : the price bucket with the highest traded volume (the "fairest price"). Value Area: the script expands outward from the POC until it captures the chosen Value Area % (default 70%) of total volume. VAH / VAL: the upper and lower edges of that Value Area. 3. Smoothing & Supertrend bands: POC, VAH, and VAL are smoothed with EMAs to remove jitter. Two trailing bands are then built, exactly like a Supertrend: Lower band = smoothed VAL − (ATR × buffer) → support used while bullish. Upper band = smoothed VAH + (ATR × buffer) → resistance used while bearish. The bands only trail in the trend-following direction, so they lock in as the price advances. 4. Trend flip: The trend is bullish while price holds above the lower band, and flips bearish when price closes below it (and vice-versa). The flip is evaluated against the previous bar's confirmed bands, so closed candles never change. 💡How to read it 🔶Bullish:A green line sits below the price. The market is accepting a higher value; treat pullbacks toward the line as the trend "breathing." A flip to red is your warning. 🔶Bearish: A red line sits above the price. Value is migrating lower; rallies into the line are where sellers tend to re-engage. A flip to green signals a potential turn. 🔶Choppy Markets: When price is inside the value area and trend strength is low, the market may be sideways. In these conditions, signals can be weaker. It may be better to wait for a clear value breakout or stronger trend strength. 🔺Signals - BUY label prints when the trend flips from bearish to bullish. - SELL label prints when the trend flips from bullish to bearish. - A flip dot marks the exact bar of the change on the trend line. - Trend Strength Filter: Set Minimum Trend Strength above 0 to filter out weak trend flips and display only higher-conviction signals. (Available in the indicator settings.) ┼ Dashboard -Trend: Current direction Bullish or Bearish. -Strength: 0–100% conviction score blending distance from POC, POC slope, and whether price has broken outside the Value Area. -Price Position: Above / Inside / Below Value Area. -Last Signal: The most recent BUY or SELL that fired. Alerts The indicator includes alerts for important events: -Buy Signal / Sell Signal -Bullish Trend / Bearish Trend (flip) -Price Above Value Area / Price Below Value Area -Price Crossing POC EMA Suggested Settings For Intraday Trading Use lower lookback and medium rows for faster signals. Example: -Profile Lookback: 50–100 -Rows: 30–50 -EMA Smoothing: 8–14 -ATR Buffer: 0.5–1.0 For Swing trading Use higher lookback and smoother settings for cleaner signals. Example: -Profile Lookback: 100–250 -Rows: 40–70 -EMA Smoothing: 10–21 -ATR Buffer: 0.8–1.5 For Cleaner Signals -Increase EMA Smoothing Length -AIncrease TR Buffer -Increase Minimum Trend Strength Volume Profile Supertrend combines the proven structure of a Supertrend with the market's true area of value derived from a rolling Volume Profile. Instead of relying solely on price volatility, it follows the migration of value through the Point of Control (POC) and Value Area (VAH/VAL) to identify higher-quality trend changes. Whether you're a day trader or swing trader, this indicator helps you visualize trend direction, identify dynamic support and resistance, filter weak reversals, and stay aligned with the prevailing market structure. Use it as a standalone trend-following tool or alongside your existing trading strategy for additional confirmation. We would love to hear your suggestions. If you have ideas for new features, indicators, analytics, or improvements, please share your feedback. Your input helps guide future updates and improve the indicator for all traders. This indicator is for educational and analytical purposes only. It is not financial advice. Trading involves risk. Always use proper risk management and combine this indicator with your own analysis before taking any trade. Chỉ báocủa HexaTrades44505
Fully custom SMA/EMA, colored 50 SMA, 15,20,50,100,200Description:This indicator streamlines chart real estate by packing four highly customizable moving averages into a single script slot. It is designed for traders who utilize multi-timeframe analysis, structural trend filters, and short-term momentum tracking. Key Features: Primary Trend Anchor : A strict, locked-in Simple Moving Average (defaulted to 50 periods) that features dynamic, real-time color-shifting. The line instantly transitions to green when the asset price closes above it (signaling a structural uptrend) and shifts to red when price drops below it (signaling a structural downtrend). Momentum Tracker: A highly responsive second moving average (defaulted to a 15-period EMA) used to gauge short-term pullbacks, trend strength, and mean-reversion zones. Institutional Support Filters: Two additional completely independent moving averages (defaulted to 100 and 200 SMAs) that can be individually toggled on or off to reveal major institutional support and resistance horizons. Full Workspace Control : Every line features independent toggles for visibility, length inputs, smoothing calculations (SMA vs. EMA), and custom hexadecimal color pickers.Chỉ báocủa NavyVeteran5
EMA 9/50/200 - Hailstone AnalyticsSlope aware color coding. - Green for upsloping, red for downslopingChỉ báocủa farid1095
Auto RSI- alexnt79rsi auto change follow timeframe . strategy by brian EMA trading day -5 Chỉ báocủa mohubito3324
Multi-Tilson MA[WR]Multi-Tilson MA with Crossover HL Gap (EN/KR) The Multi-Horizon Tilson MA is a premium-grade trend intelligence engine designed to solve the ultimate dilemma of technical moving averages: The trade-off between lag and smoothness. By processing price data through a 6-stage cascading exponential moving average, it delivers unmatched smoothness with almost zero lag compared to standard EMAs. This script supercharges the original T3 logic by stacking three distinct time horizons (Short, Mid, Long) and introduces a proprietary Crossover HL Gap system to map historical liquidity pivots. 🔑 Key Features 1. 6-Stage Tilson T3 Smoothing (Volume Factor = 0.7) Unlike lagging standard moving averages, the T3 calculation employs Tim Tillson's rigorous mathematical dampening formula. It effectively filters out volatile market noise while reacting instantly to real structural trend shifts. 2. Triple Horizon Trend Matrix (Short / Mid / Long) Plots 3 adaptive Fast/Slow T3 assemblies simultaneously. Set 1 (Short-Term): Designed for immediate scalping momentum and micro-reversals. Set 2 (Mid-Term): Tracks intra-day structural trends and swing entries. Set 3 (Long-Term): Establishes the macro institutional trend bias (The Ultimate Guide). 3. Proprietary Crossover HL Gap (Historical S/R Blocks) The indicator dynamically locks and prints the precise price levels whenever a T3 Fast/Slow crossover or crossunder occurs. It stretches this range forward as a colored horizontal channel, visualizing exactly where structural trend-changing decisions were finalized. ⚙️ Settings Guide & My Personal Setup 💡 Developer's Personal Setup: I engineered this multi-horizon layout for professional intraday trade execution. I personally use this on the Bitcoin (BTC) 3-minute chart for high-frequency scalping. I leave Short (Set 1) and Mid (Set 2) enabled to ride micro-trends, while using the ultra-heavy 480/640 Long (Set 3) cloud as my absolute baseline for macro institutional support/resistance. T3 Display Options: Toggle Short, Mid, or Long sets individually to keep your chart canvas clean according to your trading style. T3 HL Gap: Toggle this to reveal the exact historical price brackets where trend crossovers happened. These gaps act as highly reliable mitigation blocks and support/resistance flips when retested. 3중 틸슨 MA & 크로스오버 갭 시스템 📝 개요 (Description) Multi-Horizon Tilson T3는 모든 이동평균선의 고질적인 한계인 '지연 시간(Lag)과 부드러움(Smoothness)의 모순'을 수학적으로 해결한 고성능 추세 추적 엔진입니다. 🌟 주요 기능 (Key Features) 1. 6단계 틸슨 T3 추세 필터링 (Volume Factor = 0.7 고정) 횡보 장세에서 캔들이 조금만 흔들려도 가짜 신호(휩소)를 연발하는 일반 이평선과 다릅니다. T3 알고리즘은 미세한 소음은 완벽하게 감쇠시키면서, 실제 추세가 터지는 순간에는 그 어떤 이평선보다 민첩하게 반응합니다. 2. 3중 시간 프레임 결합 (단기 / 중기 / 장기 매트릭스) 서로 다른 호흡을 가진 3쌍의 Fast/Slow T3 라인을 차트에 동시에 시각화합니다. Set 1 (단기): 마이크로 파동의 흐름을 읽고 단기 스캘핑 진입 타점을 잡는 용도입니다. Set 2 (중기): 당일 주도적인 스윙 추세의 기준점 및 트레일링 스탑의 기준이 됩니다. Set 3 (장기): 시장의 거대한 기관급 대추세(Macro) 방향성을 정의하는 마스터 라인입니다. 3. 크로스오버 HL 갭 (추세 전환 매물대 블록) Fast 라인과 Slow 라인이 골든크로스(Crossover) 혹은 데드크로스(Crossunder)를 일으키는 그 역사적인 순간의 가격 축을 지표가 기억하여 수평 밴드(HL Gap) 형태로 길게 뿌려줍니다. 추세의 성격이 바뀐 핵심 자리이기 때문에 향후 가격이 되돌아올 때 매우 강력한 지지/저항 역할을 합니다. ⚙️ 세팅 가이드 & 개발자 실전 활용법 💡 개발자 실전 팁: 저는 주로 비트코인(BTC) 3분봉 차트에서 단기 스캘핑(Scalping)을 진행할 때 이 지표를 기본 베이스로 깔아둡니다. 단기(Set 1)와 중기(Set 2) 클라우드의 색상 변화로 즉각적인 타점을 진입하고, 수치가 무거운 장기(Set 3, 480/640) 클라우드를 배수진 삼아 대추세 역추세 매매를 방지합니다. T3 HL Gap 옵션 활성화: 평소 지지 저항 작도가 어려우신 분들은 이 옵션을 켜보세요. 이평선 교차가 일어났던 주요 매물대 구간이 차트에 자동으로 고정(Lock)되어 표시되므로, 기막힌 리테스트 반등 타점을 직관적으로 찾아낼 수 있습니다.Chỉ báocủa WaveRider_Z20
McGinley T3 Flow Campaign [NICK789] v.1McGinley T3 Flow Campaign is a trend-following strategy built around an adaptive signal trail and a campaign-style trade management model. The script is designed to identify confirmed trend-flow transitions, open a long or short campaign, and then display entry, target, and optional stop levels directly on the chart. It is not intended to predict tops or bottoms. Instead, it waits for the selected flow engine to shift direction and then manages the trade as a structured campaign. ━━━━━━━━━━━━━━━━━━━━━━ CORE IDEA ━━━━━━━━━━━━━━━━━━━━━━ The main concept is to combine an adaptive moving-average engine with an ATR-based trailing structure. The signal engine can use: • McGinley Dynamic only • T3 smoothing only • A blend of McGinley Dynamic and T3 The McGinley Dynamic is used because it adapts to changes in price speed more smoothly than a standard moving average. T3 smoothing is included as an optional alternative for traders who prefer a smoother trend basis. The blended mode averages both curves to create a balanced engine between responsiveness and smoothness. After the engine basis is calculated, the script builds an ATR signal trail around it. The trail updates using volatility distance and then locks in a directional path. A confirmed transition in this trail creates the long or short signal. This means the signal is not based on a simple moving-average crossover. The strategy waits for the adaptive trail itself to shift direction. ━━━━━━━━━━━━━━━━━━━━━━ HOW SIGNALS ARE GENERATED ━━━━━━━━━━━━━━━━━━━━━━ A long signal occurs when the ATR signal trail confirms an upward transition. A short signal occurs when the ATR signal trail confirms a downward transition. Signals are confirmed on closed bars. This helps avoid reacting to unfinished candle movement. The script separates main signals from continuation signals: • Main BUY / SELL labels appear when a new direction starts • Smaller continuation triangles appear when the same direction refreshes This keeps the chart cleaner while still showing when the flow continues in the same direction. ━━━━━━━━━━━━━━━━━━━━━━ CAMPAIGN TARGET MODEL ━━━━━━━━━━━━━━━━━━━━━━ Instead of using only fixed ATR targets, this strategy uses a campaign target system. There are two target modes: 1. Flow Trail Based Targets are projected from the distance between price and the active ATR signal trail. This makes the target model expand and contract with the current trend structure. 2. ATR Baseline Targets are projected from a standard ATR baseline for traders who prefer a more traditional volatility target model. The Flow Trail Based mode is the default because it connects the target spacing directly to the same adaptive trail that produced the signal. Target levels are displayed as: • Entry • TP1 • TP2 • TP3 • Optional SL Each level includes its price on the chart. ━━━━━━━━━━━━━━━━━━━━━━ TAKE PROFIT EXIT MODES ━━━━━━━━━━━━━━━━━━━━━━ The strategy includes multiple take-profit behaviours: • TP1 Only • TP2 Only • TP3 Only • Scale Out TP1 / TP2 / TP3 In scale-out mode, the position is reduced across TP1, TP2, and TP3 using the percentage settings. In single-target modes, the strategy exits the full position at the selected target. This allows the same signal engine to be tested with different trade management styles. ━━━━━━━━━━━━━━━━━━━━━━ STOP MODE ━━━━━━━━━━━━━━━━━━━━━━ The stop system has three modes: • Off • Visual Only • Visual + Strategy Exit By default, Stop Mode is set to Visual Only. This means the SL line is shown as a campaign reference, but it does not close the strategy trade unless the user changes Stop Mode to Visual + Strategy Exit. This is intentional because some traders use the stop line as a visual invalidation reference while others want the strategy tester to execute the stop automatically. ━━━━━━━━━━━━━━━━━━━━━━ DASHBOARD ━━━━━━━━━━━━━━━━━━━━━━ The dashboard shows: • Selected engine mode • Selected target mode • Current flow state • Current strategy position • Win rate • PNL and drawdown ━━━━━━━━━━━━━━━━━━━━━━ HOW TO USE ━━━━━━━━━━━━━━━━━━━━━━ 1. Choose the engine mode McGinley Only is the default and gives a responsive adaptive trend read. T3 Only is smoother. Blend mode combines both. 2. Adjust ATR Trail Length and ATR Trail Multiplier These settings control how sensitive the signal trail is. Lower values react faster but may create more signals. Higher values create smoother signals but can be slower. 3. Choose the Target Mode Flow Trail Based uses the distance from price to the signal trail. ATR Baseline uses a standard ATR distance. 4. Choose the Take Profit Exit Mode Use TP1, TP2, or TP3 only for full exits, or use Scale Out mode for partial profit-taking. 5. Choose the Stop Mode Use Visual Only for chart reference. Use Visual + Strategy Exit if you want the strategy tester to close trades at the stop level. 6. Use the Backtest Start setting The Backtest Start input lets users control the test period without changing the script. ━━━━━━━━━━━━━━━━━━━━━━ WHAT MAKES THIS SCRIPT DIFFERENT ━━━━━━━━━━━━━━━━━━━━━━ This script is not a simple collection of unrelated indicators. The components are connected in a single workflow: • The McGinley/T3 engine creates the adaptive trend basis • The ATR signal trail converts that basis into a directional flow line • Confirmed trail transitions create campaign entries • The target system projects trade levels from the active flow structure • The dashboard summarizes the active engine, target model, trade state, and performance The main purpose of the script is to turn an adaptive trend transition into a structured trade campaign with visible entry, targets, stop reference, and performance context. ━━━━━━━━━━━━━━━━━━━━━━ IMPORTANT NOTES ━━━━━━━━━━━━━━━━━━━━━━ This is a strategy script for backtesting and study. It is not financial advice. Past performance does not guarantee future results. Results will vary by symbol, timeframe, spread, commission, session, and market condition. The script works best when users test different settings for the market they trade instead of assuming one preset fits every asset. Because this is a trend-following model, it can perform well during directional moves but may produce weaker results during sideways or choppy conditions. Chiến lượccủa NICK78922734
Multiple Moving AveragesThis indicator overlays four popular moving averages on your chart: EMA 62 (short-term trend) EMA 144 (medium-term trend) SMA 200 (long-term trend, widely watched) SMA 800 (very long-term trend)Use them to identify trend direction, dynamic support/resistance, and potential reversal zones.Chỉ báocủa FX_Shokunin8
ATR with Configurable ATR SMA # ATR with Configurable ATR SMA ## Overview **ATR with Configurable ATR SMA** is a volatility analysis indicator that plots the **Average True Range (ATR)** together with a **Simple Moving Average (SMA) of the ATR**. The indicator helps traders determine whether current market volatility is above or below its recent average, making it useful as a volatility filter for trend-following and breakout strategies. Unlike the standard ATR indicator, this script allows traders to compare the current ATR directly against a configurable long-term average, making changes in volatility easier to identify. ## Features • Configurable ATR Length (default: 14) • Configurable ATR SMA Length (default: 75) • Separate indicator pane for improved readability • Plots both ATR and ATR SMA simultaneously • Background turns green when ATR is above its moving average • Background turns red when ATR is below its moving average • Displays a table showing: * Current ATR value * Whether ATR is above or below its moving average ## Inputs ### ATR Length Determines the period used to calculate the Average True Range. Default: ``` 14 ``` Higher values smooth volatility. Lower values react faster to changes. ### ATR SMA Length Determines the moving average period applied to the ATR. Default: ``` 75 ``` This serves as the long-term volatility benchmark. ## Interpretation ### ATR Above ATR SMA When the ATR rises above its moving average, market volatility is increasing. This often indicates: • Stronger trends • Expansion in price movement • Better breakout conditions • Increased trading opportunities ### ATR Below ATR SMA When ATR falls below its moving average, volatility is contracting. This often suggests: • Sideways markets • Consolidation • Reduced price movement • Increased likelihood of false breakouts --- ## Common Uses This indicator can be used as a volatility filter for: • Trend-following systems • Breakout strategies • Swing trading • Futures trading • Intraday trading • Position trading Many traders avoid taking breakout trades while ATR remains below its long-term average because lower volatility environments can produce less decisive price movements. --- ## Example Trading Filter Instead of taking every trading signal: Entry Conditions ✓ Price above trend filter ✓ Momentum confirmation ✓ ATR > ATR SMA This helps eliminate trades during low-volatility market conditions. --- ## Background Colors Green Background Current ATR is above its moving average. Market volatility is expanding. Red Background Current ATR is below its moving average. Market volatility is below average. --- ## Notes ATR measures volatility only. It does **not** indicate trend direction or whether prices will move up or down. For best results, combine ATR with other tools such as: • Moving Averages • Hull Moving Average (HMA) • MACD • ADX • Relative Strength • Price Action --- ## Best Timeframes The indicator works on all timeframes including: • 1 Minute • 5 Minute • 15 Minute • 1 Hour • 4 Hour • Daily • Weekly --- ## Markets Suitable for: • Stocks • ETFs • Futures • Commodities • Forex • Cryptocurrency --- ## Disclaimer This indicator is designed as a volatility analysis tool and should not be used as a standalone buy or sell signal. Always combine it with sound risk management and additional technical analysis before making trading decisions. --- This description is substantially more informative than a minimal explanation and is well suited for a Public Library submission. It explains what the indicator does, how to interpret it, and how it can fit into a trading workflow without making unsupported performance claims. Chỉ báocủa bnandhiCập nhật 8
ATR with Configurable ATR SMAATR with Configurable ATR SMA Overview ATR with Configurable ATR SMA is a volatility analysis indicator that plots the Average True Range (ATR) together with a Simple Moving Average (SMA) of the ATR. The indicator helps traders determine whether current market volatility is above or below its recent average, making it useful as a volatility filter for trend-following and breakout strategies. Unlike the standard ATR indicator, this script allows traders to compare the current ATR directly against a configurable long-term average, making changes in volatility easier to identify. Features • Configurable ATR Length (default: 14) • Configurable ATR SMA Length (default: 75) • Separate indicator pane for improved readability • Plots both ATR and ATR SMA simultaneously • Background turns green when ATR is above its moving average • Background turns red when ATR is below its moving average • Displays a table showing: Current ATR value Whether ATR is above or below its moving average Inputs ATR Length Determines the period used to calculate the Average True Range. Default: 14 Higher values smooth volatility. Lower values react faster to changes. ATR SMA Length Determines the moving average period applied to the ATR. Default: 75 This serves as the long-term volatility benchmark. Interpretation ATR Above ATR SMA When the ATR rises above its moving average, market volatility is increasing. This often indicates: • Stronger trends • Expansion in price movement • Better breakout conditions • Increased trading opportunities ATR Below ATR SMA When ATR falls below its moving average, volatility is contracting. This often suggests: • Sideways markets • Consolidation • Reduced price movement • Increased likelihood of false breakouts Common Uses This indicator can be used as a volatility filter for: • Trend-following systems • Breakout strategies • Swing trading • Futures trading • Intraday trading • Position trading Many traders avoid taking breakout trades while ATR remains below its long-term average because lower volatility environments can produce less decisive price movements. Example Trading Filter Instead of taking every trading signal: Entry Conditions ✓ Price above trend filter ✓ Momentum confirmation ✓ ATR > ATR SMA This helps eliminate trades during low-volatility market conditions. Background Colors Green Background Current ATR is above its moving average. Market volatility is expanding. Red Background Current ATR is below its moving average. Market volatility is below average. Notes ATR measures volatility only. It does not indicate trend direction or whether prices will move up or down. For best results, combine ATR with other tools such as: • Moving Averages • Hull Moving Average (HMA) • MACD • ADX • Relative Strength • Price Action Best Timeframes The indicator works on all timeframes including: • 1 Minute • 5 Minute • 15 Minute • 1 Hour • 4 Hour • Daily • Weekly Markets Suitable for: • Stocks • ETFs • Futures • Commodities • Forex • Cryptocurrency Disclaimer This indicator is designed as a volatility analysis tool and should not be used as a standalone buy or sell signal. Always combine it with sound risk management and additional technical analysis before making trading decisions.Chỉ báocủa bnandhi3
Triple Moving Averages (TriMA)Triple Moving Averages (TriMA) Triple Moving Averages (TriMA) is a flexible multi-timeframe trend analysis indicator that displays up to three independently configurable moving averages on a single chart. Each moving average can use its own calculation method, price source, length, and timeframe, making it ideal for trend following, market structure analysis, and higher-timeframe context without switching charts. ──────────────────────────────────── Key Features Three Independent Moving Averages Display up to three moving averages simultaneously. The 2nd and 3rd MAs can be enabled or disabled independently for simplified or advanced analysis. Multiple Moving Average Types Each MA supports: - Hull Moving Average (HMA) - Simple Moving Average (SMA) - Weighted Moving Average (WMA) - Volume Weighted Moving Average (VWMA) - Smoothed Moving Average (SWMA) - Running Moving Average (RMA) All moving averages operate independently and can be combined freely. Independent Timeframes Each MA can be calculated from a different timeframe while plotted on the current chart. Example: - 180 HMA on 1-minute - 288 SMA on 5-minute - 720 VWMA on 10-minute This provides built-in multi-timeframe trend context. Independent Lengths & Sources Each MA has its own: - Length - Price source (Close, HLCC4, OHLC4, etc.) - Calculation type - Timeframe ──────────────────────────────────── Automatic Time Labels Optional labels show: - MA type - Effective timeframe duration (real-world time equivalent) Examples: - HMA 3 h - SMA 5 d - VWMA 2.5 mnth The indicator converts Length × Timeframe into intuitive time duration, making it easier to understand the real smoothing strength of each MA. ──────────────────────────────────── Smart Label Positioning Labels are: - Plotted directly on each MA - Offset from the latest price action - Automatically oriented based on slope (up/down) This keeps the chart clean while maintaining readability. ──────────────────────────────────── Visual Customization You can customize: - Line colors - Transparency - Label text color - Label size - Label visibility - Offset position Each MA is fully independent in styling. ──────────────────────────────────── Typical Uses Trend Identification Detect overall market direction using slower MAs. Multi-Timeframe Analysis Combine higher timeframe trend context with lower timeframe execution. Dynamic Support & Resistance Use MAs as dynamic reaction zones in trending markets. Trend Alignment Identify when multiple timeframes align for higher-probability setups. Market Context Avoid trading against higher timeframe direction. ──────────────────────────────────── Default Setup - MA1: 180 HMA (1-minute) - MA2: 288 HMA (5-minute) - MA3: 720 HMA (10-minute) This creates a balanced short/medium/long trend structure. ──────────────────────────────────── Highlights - Up to 3 independent moving averages - 6 MA calculation methods - Full multi-timeframe support - Independent settings per MA - Automatic time-based labeling - Clean visual structure - Fully customizable appearance TriMA is designed for traders who want a clean but powerful multi-timeframe trend system combining multiple moving averages into one structured view.Chỉ báocủa bodfinmag114
SMA Trend FlowA clean and intuitive trend-following indicator designed to simplify market analysis using multiple Simple Moving Averages (SMAs). Instead of displaying only moving averages, this indicator visualizes trend direction, trend strength, and potential entry timing in a simple and easy-to-read format. Features Displays 5, 20, 60, 100, and 200 SMAs. Background highlights when a Perfect Order is established: Bullish: 5 > 20 > 60 > 100 Bearish: 5 < 20 < 60 < 100 Dynamic fill between the 5 SMA and 20 SMA. The fill becomes stronger as more SMAs align in the same direction, making trend strength easy to recognize at a glance. Buy and sell arrows when the 5 SMA crosses the 20 SMA. Alert support for both bullish and bearish crossovers. Why this indicator? The goal is to reduce chart clutter while providing the essential information needed for trend-following and swing trading. With a single glance, traders can quickly identify: Overall market trend Trend strength Short-term momentum Potential entry opportunities This indicator is designed for traders who prefer clean charts and objective trend analysis.Chỉ báocủa keimaonobuCập nhật 10