EMA 9/21/50/100/200Default Line Style Added: Configured the 5 EMAs to automatically load as dotted lines, matching your visual preferences right out of the box.Chỉ báocủa jeffrey999301132
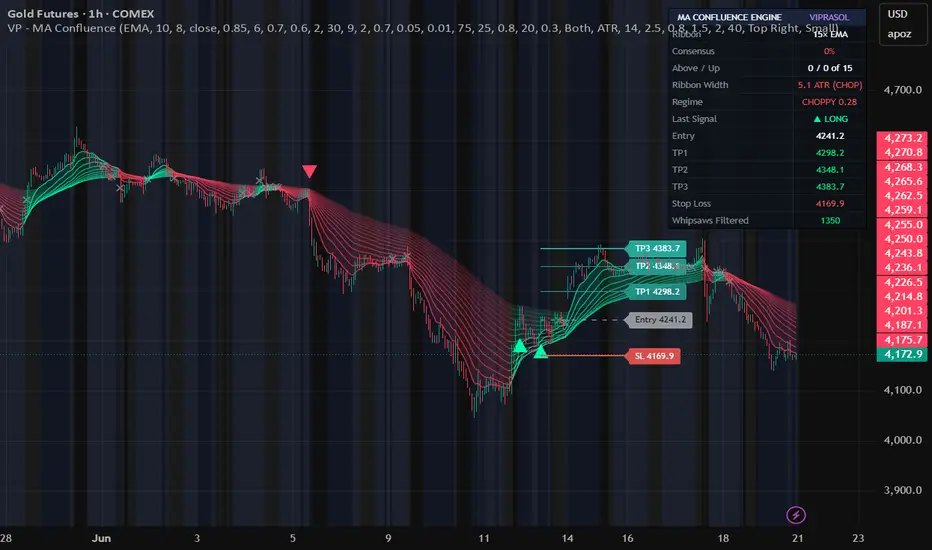
MA Confluence Engine [Viprasol]MA Confluence Engine — 15-MA Consensus Ribbon ═══════════════════════════════════════════════════════════ ONE CROSSOVER IS AN OPINION. FIFTEEN MAs AGREEING IS A TREND. ═══════════════════════════════════════════════════════════ A single moving-average crossover whipsaws constantly — two lines tangle in chop and fire signal after signal that goes nowhere. MA Confluence Engine replaces that one fragile opinion with the agreement of a 15-MA ribbon. It only signals when most of the ribbon agrees on direction, stands aside when the ribbon squeezes together (a compressed ribbon IS chop), and on every signal it draws a complete trade plan: Entry, TP1, TP2, TP3 and Stop Loss. ═══════════════════════════════════════════════════════════ HOW THE CONSENSUS WORKS ═══════════════════════════════════════════════════════════ The engine builds a ribbon of 15 moving averages, spaced from a fast base length upward (e.g. 10, 18, 26 … 122). Every bar it measures two things across all 15: • How many is price trading ABOVE? • How many are SLOPING UP? These combine into a single CONSENSUS SCORE from 0 to 100: 100% = price above all 15 MAs AND all 15 rising (a fully stacked uptrend) 0% = price below all 15 AND all 15 falling (a fully stacked downtrend) 50% = mixed — the ribbon disagrees A long signal fires only when consensus rises through your bullish threshold (default 75%), a short when it falls through the bearish threshold (default 25%). Half-hearted moves where the ribbon disagrees never trigger. ═══════════════════════════════════════════════════════════ THE TRADE PLAN — DRAWN ON THE LAST SIGNAL ═══════════════════════════════════════════════════════════ The moment a signal fires, the engine projects five levels forward and labels each with its price: • ENTRY — at the signal close • STOP LOSS — your risk distance away (ATR or %); this distance defines 1R • TP1 / TP2 / TP3 — at your chosen R-multiples of that risk (default 1R / 2R / 3R) Only the most recent signal's plan is shown, so the chart stays clean. The dashboard mirrors the exact prices, and every alert carries the full plan (Entry/SL/TP1/TP2/TP3) so it's ready for journaling or automation. ═══════════════════════════════════════════════════════════ THE RIBBON IS ITS OWN CHOP FILTER ═══════════════════════════════════════════════════════════ When a market chops, moving averages of every length collapse onto each other — the ribbon goes flat and thin. The engine measures RIBBON WIDTH (the spread of the 15 MAs, normalized by ATR) and skips signals whenever the ribbon is compressed below your threshold. A second Kaufman Efficiency-Ratio gate confirms price is actually trending. Filtered crosses are drawn faintly (✕) and counted, so you SEE what was avoided. ═══════════════════════════════════════════════════════════ 21 VERIFIED, LICENSE-CLEAN MOVING AVERAGES ═══════════════════════════════════════════════════════════ Build the ribbon from any one of: SMA, EMA, WMA, RMA, VWMA, DEMA, TEMA, HMA, ALMA, T3, McGinley, ZLEMA, KAMA, FRAMA, VIDYA, SuperSmoother, Gaussian, Laguerre, Kalman, LSMA, Median. Each is implemented from its published formula and credited to its author. Jurik's JMA is deliberately excluded — it is a proprietary, trademarked product whose every open-source "version" is an unlicensed reverse-engineering. ═══════════════════════════════════════════════════════════ DASHBOARD ═══════════════════════════════════════════════════════════ • Live consensus score, with price-above and sloping-up counts (x of 15) • Ribbon width + chop state, trend-regime efficiency reading • Last signal direction and the full Entry / TP1 / TP2 / TP3 / SL prices • Whipsaws filtered ═══════════════════════════════════════════════════════════ FEATURES ═══════════════════════════════════════════════════════════ • 15-MA ribbon colored by consensus (red → green) or simple bull/bear, with fill • Entry/TP1/TP2/TP3/SL level lines + labels on the latest signal • Choppy-regime background shading + faint markers on filtered crosses • Direction filter (Both / Longs / Shorts) • Stop in ATR or %, take-profits as R-multiples • Alerts for long, short, and chop — signal alerts include the full trade plan • Full MA sub-parameter control (ALMA, T3, KAMA, Gaussian, Laguerre, Kalman, VIDYA, McGinley) ═══════════════════════════════════════════════════════════ HOW TO USE ═══════════════════════════════════════════════════════════ 1. Choose an MA type, base length, and spacing for the ribbon. 2. Wait for a signal — it only fires when the ribbon fans out and aligns (consensus through your threshold) in a trending regime. 3. Use the drawn Entry / SL / TP1 / TP2 / TP3 as your trade plan; scale out at the TPs. 4. Raise the consensus thresholds and ribbon-width minimum to make signals stricter (fewer, cleaner) — the whipsaw-filtered count shows the filter working. ═══════════════════════════════════════════════════════════ HONEST LIMITATIONS — PLEASE READ ═══════════════════════════════════════════════════════════ • Signals are evaluated on bar close; act on confirmed bars to avoid intrabar flicker. • A consensus system enters LATER than a single fast crossover — it trades fewer, higher-quality moves and will sit out fast reversals. That trade-off is the point. • The TP/SL levels are a risk framework, not a prediction — markets do not owe you 3R. • Volume MAs (VWMA) and the regime math need reliable data; some synthetic forex/CFD feeds are less meaningful. • This is a decision-support tool, not financial advice. Trade at your own risk. ═══════════════════════════════════════════════════════════ CREDITS & ORIGINALITY ═══════════════════════════════════════════════════════════ MA methods credited to their authors: Wilder (RMA), Mulloy (DEMA/TEMA), Hull (HMA), Legoux & Kouzis-Loukas (ALMA), Tillson (T3), McGinley, Kaufman (KAMA/Efficiency Ratio), Ehlers (ZLEMA, SuperSmoother, Gaussian, Laguerre, FRAMA), Chande (VIDYA), Kálmán (Kalman). All formulas are public-domain / published methods. Every line of Pine — the MA dispatcher, the 15-MA consensus engine, the ribbon chop filter, the trade-plan projection, and the visualization — is original Viprasol work written from the published formulas. No third-party Pine code is reused; no proprietary algorithms included. Chỉ báocủa viprasol11419
Market Projection Market Projection Engine is a visual projection tool designed to map potential future price paths using trend structure, volatility, and price displacement. The indicator combines three projection phases: • AB (Reaction Zone) — Initial response and stabilization area after a strong displacement. • BC (Path Zone) — Primary projected route based on current trend pressure and directional slope. • CD (Target Zone) — Extended objective area where projected movement may begin to lose momentum. The model also includes: • Ghost Candles to visualize a potential path rather than a single projected line. • Stretch Clouds to highlight areas where price has moved significantly away from its center of gravity. • Probability Corridors to display a wider range of possible price development rather than a fixed forecast. • Trend Quality Score to estimate the strength of the current projection environment. This indicator is intended as a visual market structure and projection tool. It does not predict future prices and should not be used as a standalone trading system. Users should always combine its output with their own analysis, risk management, and market context. ━━━━━━━━━━━━━━━━━━━ ⚠ Disclaimer This script is provided for educational and informational purposes only. The projections displayed by this indicator represent possible market paths derived from historical price behavior and volatility measurements. They are not forecasts, predictions, or guarantees of future performance. Trading and investing involve risk. Past market behavior does not guarantee future results. Always perform independent analysis and use appropriate risk management before making trading decisions. Chỉ báocủa onderarslantas10764
Golden Cross Screener# Golden Cross Screener — find the *fresh* crosses, not last month's ## The problem this solves TradingView's built-in screener can already filter for a 50/200 moving-average crossover. But if you've actually used it, you know the catch: it surfaces every name in a crossed-up *state*, so a cross that fired this morning sits in the same list as one from three weeks ago. There's no native way to ask "which stocks crossed in the last day or two" — and for a signal where timing is the entire edge, that's a real gap. This screener closes it. It adds a true **recency dimension** to the golden cross, so you can isolate the crosses that *just happened* and leave the stale, already-extended ones behind. ## What it does Built for the **Pine Screener**, this script scans a watchlist and exposes a set of columns you can filter and sort on: - **GC today** — fires (1) only on the bar the 50 crosses above the 200. Run it end-of-day for a clean list of that session's fresh golden crosses. - **GC recent** — flags (1) any cross within a window you set (default 5 bars), so you never miss one because you scanned a day late. - **Bars since GC** — the column the native screener doesn't have: a precise count of how many bars have passed since the cross. Sort ascending and the freshest signals rise to the top. Filter `0–3` and weeks-old crosses simply disappear. - **50 > 200 state** — the standing condition, for when you want every name currently in a golden-cross posture rather than the event itself. - **MA gap %** — how far the fast MA sits above the slow one. A small gap means the cross is fresh and tight; a large gap means it happened long ago and price may be extended. - **Price vs fast %** — where price sits relative to the fast MA, so you can drop names that have already rolled back under it. Lengths are configurable, and you can switch between SMA (the classic golden cross) and EMA (faster, earlier signals) with a single input. ## How to set it up 1. Open the **Pine Screener** (top-left screener-type dropdown → Pine Screener). 2. Add this script to your favorites (the star) so the screener can see it. 3. Point it at a watchlist and set the timeframe to **Daily** — the 50/200 golden cross is a daily-chart signal. 4. Filter the columns. A few recipes to start with: - *Today's fresh crosses:* `GC today = 1` - *Anything from the last few days:* `Bars since GC` between `0` and `3` - *Clean crosses only:* add `Price vs fast % ≥ 0` so price is still above the fast MA - *Tight, just-crossed setups:* keep `MA gap %` in a small range to weed out extended names ## On-chart use too Add it to any chart as a normal indicator and you get the two moving averages drawn plus green/red triangles marking each golden and death cross — handy for eyeballing a name the screener surfaces before you commit. ## Honest notes A 50/200 golden cross is a **lagging, trend-confirmation signal** by design — by the time the slower average is crossed, part of the move has already happened. This tool is built to help you act on crosses *promptly* and filter for *quality*, not to promise a specific outcome. It pairs best with your own confirmation: relative strength, volume, and the broader trend. Two practical points. **Bars since GC** only has a value when the cross occurred within the history the script loaded for each symbol, so a name that's been in a golden-cross state for a very long time may show blank rather than a large number — which is fine here, since you're filtering for *small* values and the blanks (the stale ones) correctly fall out. And because the screener reads the last bar of the selected timeframe, keep it on Daily for the classic signal — a "golden cross" on an intraday timeframe means something different. ## Settings summary - **Fast / Slow MA length** — defaults 50 / 200. - **MA type** — SMA (classic) or EMA (faster). - **Recent cross window** — how many bars back "GC recent" looks (default 5). Open-source, so the logic is fully visible — read it, tweak it, make it yours. Feedback and suggestions are welcome in the comments. ## Disclaimer This script is for research and educational purposes and is not financial advice. Moving-average crossovers are lagging signals and do not predict future price. Always do your own analysis and manage risk before acting on any screen result.Chỉ báocủa tfox279111
ORB PRO M5 + STRUCTURE M15 + FIBsysteme Opening rang breakout + signal , zone of fibo 61.8 78.6 Chỉ báocủa maxime174511
SMA 50 / 100 / 200Simple SMA 50/100/200 - all three most important SMAs in one indicatorChỉ báocủa AbaddonPLCập nhật 4
Rolling VWAP SuiteThree independent Rolling VWAPs on one chart — each with its own period, color, and optional standard deviation bands. Unlike a session VWAP, a Rolling VWAP runs over a moving time window and never resets, giving you a continuous fair-value line for dynamic support/resistance. Features - 3 toggleable rVWAP slots - Periods from 7D to 365D (7 / 14 / 30 / 60 / 90 / 180 / 270 days) - Optional σ bands per slot with custom multiplier and fill - Clean period labels on the right edge, value optional - Global transparency and line-width controls Why it's different: The window is calculated on real timestamps (rolling sums, not a fixed bar count), so there's no lookback limit — even the 365-day rVWAP runs stable on any timeframe. Note: Long-period accuracy depends on loaded history. On very low timeframes your plan may not load a full year of bars, so the 365D computes over the available span. Use higher chart timeframes (1H/1D) for full long-term values.Chỉ báocủa Davidgorban15
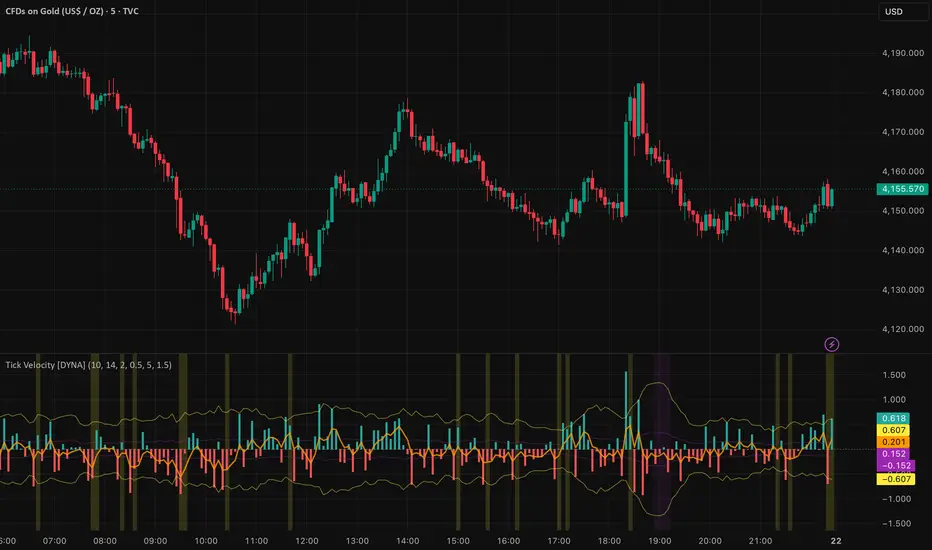
Tick Velocity [DYNA]Tick Velocity measures the speed of price movement on every bar, normalized by ATR and log-compressed so the reading works consistently across any instrument and any timeframe. Instead of asking "did price go up or down?" it asks "how fast did price move?" -- and that distinction makes all the difference when you need to spot momentum bursts and exhaustion in real time. Most momentum tools tell you the direction of a move but not its intensity relative to normal conditions. A 50-point move on a major index means something very different during a quiet afternoon versus an opening-bell surge. Tick Velocity strips away that ambiguity by expressing every bar's price change as a multiple of recent volatility with log compression, giving you a clean, comparable speed reading that doesn't get crushed by outlier spikes. Key Features ATR-Normalized Velocity -- price change divided by ATR, so readings are comparable across instruments and timeframes without manual adjustment Log-Compressed Scale -- extreme spikes are tamed so the histogram uses its full visual range, making normal-range momentum readable even after outlier moves Signal Line -- a smoothed EMA overlay shows sustained momentum direction, filtering out bar-to-bar noise Dynamic Spike Detection -- automatically identifies bars where velocity exceeds a configurable multiple of its recent average, with separate bullish and bearish alerts Smart Exhaustion Detection -- flags fading momentum only after periods of genuine activity, so you don't get false exhaustion signals during quiet consolidation Confirmed-Bar Logic -- all signals are evaluated on the completed bar, so what you see on the chart stays on the chart with no repainting Clean Visual Design -- color-coded histogram with dynamic threshold lines and signal line makes it easy to read momentum state at a glance How It Works When you add Tick Velocity to your chart, a histogram appears in a separate pane below price. Each bar in the histogram represents the speed of that candle's price change: green bars mean price moved up, red bars mean price moved down, and the height of each bar shows how fast the move was. Log compression keeps the scale readable -- a massive gap-up spike won't flatten everything else into an invisible line. An orange signal line (EMA) overlays the histogram, smoothing out bar-to-bar noise to show you the sustained momentum direction. When the signal line holds above zero, bulls are in control; when it dips below, bears are driving. Two sets of threshold lines frame the histogram. The outer yellow lines mark the spike threshold -- when a bar pushes beyond these lines, price moved significantly faster than normal, indicating a momentum burst. The inner purple lines mark the exhaustion threshold -- when bars shrink inside these lines after a period of elevated activity, momentum is fading and the market may be pausing or preparing to reverse. The smart exhaustion gate ensures purple zones only appear after real momentum -- not during quiet consolidation. Background shading reinforces these conditions. A yellow tint appears on confirmed spike bars, and a purple tint appears on confirmed exhaustion bars, making it easy to scan through the chart and see where momentum surged or faded. Tick Velocity histogram showing bullish and bearish velocity bars, with spike threshold lines (yellow) and exhaustion bands (purple). Background highlights mark confirmed spike and exhaustion events. Settings The core settings control sensitivity. The Velocity Lookback (default 10) determines how many bars are used to calculate the average velocity -- lower values make the indicator more responsive for scalping, higher values smooth it out for swing trading. The ATR Period (default 14) controls the normalization window. The Signal Smoothing (default 5) sets the EMA period for the orange signal line. The Spike Multiplier (default 2.0) sets how far above average a bar must travel to count as a spike. Raise it to 2.5 or 3.0 if you only want the strongest bursts. The Exhaustion Multiplier (default 0.5) sets how far below average velocity must drop to flag exhaustion. The Exhaustion Gate Multiplier (default 1.5) ensures exhaustion only triggers when recent activity exceeds the longer-term baseline by this factor -- preventing false signals during quiet consolidation. Threshold lines, background highlights, and the signal line can each be toggled independently under Visual settings. Alerts Bullish Velocity Spike -- fires when upward velocity exceeds the spike threshold on a confirmed bar. Message: "Bullish velocity spike -- strong upward momentum burst." Bearish Velocity Spike -- fires when downward velocity exceeds the spike threshold on a confirmed bar. Message: "Bearish velocity spike -- strong downward momentum burst." Velocity Exhaustion -- fires when velocity drops below the exhaustion threshold after a period of elevated activity. Message: "Tick Velocity exhaustion detected -- momentum fading after active period, possible pause or reversal." To set up alerts: click the TradingView Alerts button, select "Tick Velocity " from the indicator dropdown, choose "Any alert() function call" as the condition, and set your preferred notification method. Best Practices Use velocity spikes at key support and resistance levels to confirm breakouts -- a spike adds conviction that the level break is real Watch for exhaustion signals after extended trends to time profit-taking or tighten stop-loss placement Combine with volume indicators for added confirmation -- a velocity spike on high volume is more meaningful than one on thin volume Adjust the lookback period to match your trading style: 5-7 for scalping, 10-15 for intraday, 20+ for swing trading On lower timeframes (1-3 minute), consider raising the spike multiplier to reduce noise from normal market fluctuations Part of the DYNA Ecosystem Tick Velocity is a free indicator built with the same design standards as the DYNA premium suite. For complete trade management with automatic stop loss, break-even, trailing stops, and multi-target systems, explore the full DYNA indicator collection. Disclaimer This indicator is a technical analysis and educational tool only -- it is not financial advice and makes no guarantee of any outcome. Past performance does not predict future results. Always do your own research and use proper position sizing and risk management. Created by Varun Nidhi · varunnidhi.com A free DYNA indicator — self-contained, no repainting. Chỉ báocủa van007trader20
Scalper's Moving Average [DYNA]Scalper's Moving Average is an adaptive overlay line that automatically adjusts its speed based on market conditions. In trending markets it tracks price closely, keeping you in the move. In choppy, sideways markets it flattens out, filtering noise and keeping you from getting whipsawed. It is built on the Kaufman Adaptive Moving Average (KAMA) algorithm, tuned specifically for 1-5 minute scalping charts. Most moving averages force you to choose between speed and smoothness. A fast MA gives early signals but generates constant false flips in chop. A slow MA filters noise but lags behind real moves, costing you ticks on every entry. Scalper's Moving Average solves this tradeoff by measuring how efficiently price is moving and adjusting its responsiveness in real time. Key Features Adaptive Speed -- Automatically speeds up when price is trending and slows down when the market is chopping, so you get one line that does the work of two Slope Color Coding -- The KAMA line changes color based on its slope direction: teal for rising, red for falling, gray for flat. Instant visual read of trend bias Distance Fill -- Optional shaded area between price and KAMA shows how far price has stretched from its adaptive mean, helping you spot overextension and pullback entries Slope Flip Markers -- Small triangle markers appear on the chart when the KAMA slope changes direction, flagging potential trend shifts at a glance. An ATR-based filter and cooldown system suppress noise flips in choppy markets No Repainting -- Slope flip signals use confirmed-bar logic and will not change once printed How It Works When you add the indicator to your chart, you will see a single colored line overlaid on your candles. This is the KAMA line. Unlike a standard EMA or SMA, it does not move at a fixed speed. Instead, it calculates an efficiency ratio on every bar -- comparing how far price has moved in one direction versus how much total back-and-forth movement occurred. When that ratio is high (strong trend), the line speeds up and hugs price closely. When the ratio is low (chop), the line barely moves. The line color tells you the current slope direction at a glance. A teal line means KAMA is rising and momentum favors the bulls. A red line means KAMA is falling and momentum favors the bears. A gray line means the slope is flat and the market has no clear direction -- a signal to stay patient. When the slope changes direction, a small triangle marker appears directly on the KAMA line. An "UP" triangle marks a bullish flip, and a "DN" triangle marks a bearish flip. These transitions are the earliest indication that the adaptive trend bias has shifted. To keep the chart clean, flips are filtered by an ATR-scaled minimum slope threshold -- tiny wiggles in chop are ignored -- and a cooldown period prevents rapid-fire labels from stacking up. KAMA line hugging price tightly during a trending move, with distance fill showing the stretch between price and the adaptive average. Distance Fill The optional distance fill shades the area between the close price and the KAMA line. When price is above KAMA the fill is teal; when below, the fill is red. When price is hugging KAMA closely (within the dead-zone threshold), the fill turns neutral gray, giving you an instant visual cue that the market is chopping and there is no meaningful stretch to trade. The width of the colored fill tells you how far price has stretched from its adaptive mean. A wide fill suggests the move may be overextended -- not the ideal time to chase. A narrowing fill as price pulls back toward KAMA can highlight better entry zones where risk-to-reward improves. Distance fill expanding during a strong move, then narrowing as price pulls back to KAMA -- a potential re-entry zone. Settings The core settings control the KAMA calculation. KAMA Length (default 10) sets the lookback window for the efficiency ratio -- lower values make the line more reactive, higher values smooth it out. Fast Constant (default 2) determines the fastest the line can move when the trend is strong. Slow Constant (default 30) determines how sluggish the line becomes in chop. The defaults are tuned for 1-3 minute charts and work well for most scalping scenarios. The flip filter settings control label quality. Min Slope (ATR %) (default 0.15) sets the minimum slope magnitude as a fraction of ATR -- raise it to filter out more noise flips in choppy conditions. Cooldown Bars (default 5) enforces a minimum gap between flip labels, preventing clusters of rapid UP/DN markers. Both settings also define the neutral dead-zone for slope coloring and fill. Under visual settings, you can toggle the distance fill on or off and adjust the KAMA line thickness. Alerts Slope Flip Bullish -- Fires when the KAMA slope turns from flat or falling to rising. Message: "Scalper's Moving Average : KAMA slope flipped bullish. Trend may be turning up." Slope Flip Bearish -- Fires when the KAMA slope turns from flat or rising to falling. Message: "Scalper's Moving Average : KAMA slope flipped bearish. Trend may be turning down." To set up alerts: click the TradingView Alerts button, select "Scalper's Moving Average " from the indicator dropdown, choose "Any alert() function call" as the condition, and set your preferred notification method. Best Practices Start with the default 10/2/30 settings on 1-3 minute charts before making adjustments When the KAMA line is flat and gray, avoid trend-following trades -- the market is chopping Use the distance fill to time entries: enter on pullbacks toward KAMA rather than chasing extended moves Combine slope flip signals with volume or support/resistance levels for higher-confidence entries If trading 5-minute charts, consider increasing KAMA Length to 14 or 20 for smoother signals Part of the DYNA Ecosystem Scalper's Moving Average is a free indicator built with the same design standards as the DYNA premium suite. For complete trade management with automatic stop loss, break-even, trailing stops, and multi-target systems, explore the full DYNA indicator collection. Disclaimer This indicator is a technical analysis and educational tool only -- it is not financial advice and makes no guarantee of any outcome. Past performance does not predict future results. Always do your own research and use proper position sizing and risk management. Created by Varun Nidhi · varunnidhi.com A free DYNA indicator — self-contained, no repainting. Chỉ báocủa van007trader56
Range Box Scalper [DYNA]Range Box Scalper detects when price compresses into a tight consolidation zone and visually draws a box around it in real time. When price breaks out of the box with above-average volume, the indicator marks the exact breakout bar with a directional arrow, so you can act on the expansion move without second-guessing the setup. Most traders know that consolidation leads to expansion, but spotting the range in real time and confirming the breakout with volume is tedious manual work. Range Box Scalper automates the entire process: it watches for price to stay within an ATR-defined corridor for a minimum number of bars, draws the consolidation zone as a visible box on the chart, and then waits for a decisive close outside the box backed by strong volume before signaling the breakout. Key Features Automatic Range Detection -- Identifies consolidation zones based on ATR-calibrated price width and minimum bar count. No manual drawing required. Live Box Drawing -- Shaded boxes appear and extend in real time as price continues to range, giving you a clear visual boundary to watch. Volume-Confirmed Breakouts -- Breakout arrows only appear when volume exceeds a configurable multiple of the 20-bar average, filtering out weak, low-conviction exits. Breakout Strength Filter -- Requires the breakout candle to close a minimum distance (ATR-based) beyond the range boundary, eliminating marginal breakouts. Built-in Trend Filter -- Optional EMA-based trend filter ensures breakouts only fire in the direction of the prevailing trend, so you can focus on with-trend setups. Directional Breakout Arrows -- Green upward triangles for bullish breakouts, red downward triangles for bearish breakouts, placed right at the breakout bar. No Repainting -- All signals use confirmed-bar logic. Once a box or arrow appears, it stays. How It Works As price action unfolds, Range Box Scalper continuously monitors whether recent bars are staying within a narrow corridor. The corridor width is derived from ATR, so it automatically adapts to the volatility of whatever instrument you are trading. When price stays inside this corridor for your configured minimum number of bars, a shaded gray box appears on the chart marking the consolidation zone. You will also see a small orange diamond labeled "Range" on the bar where the consolidation is first confirmed. The box continues to extend to the right as long as price remains inside the boundaries. The moment price closes decisively outside the box and the breakout bar carries above-average volume, the indicator marks the breakout with a colored arrow: a green triangle below the bar for a bullish breakout, or a red triangle above the bar for a bearish breakout. The box border also changes color to match the breakout direction, giving you a quick historical reference for which zones broke which way. If price drifts out of the range on weak volume, no breakout signal fires. The indicator simply resets and begins looking for the next consolidation. This volume filter is what separates genuine expansion moves from false exits that quickly reverse. A consolidation box forming over several bars, followed by a bullish breakout arrow when price closes above the range with strong volume. Settings The core settings control how the indicator defines a consolidation zone. Min Range Bars (default: 6) sets how long price must stay compressed before a box is drawn -- lower values on fast timeframes, higher values on daily charts. ATR Multiplier (default: 1.5) controls the maximum allowed range width relative to ATR; lower values mean tighter, more compressed boxes, while higher values detect more consolidation zones. Volume Confirmation (default: 1.2x) sets the volume threshold for breakout signals; increase this if you want only the strongest breakouts. Min Breakout Strength (default: 0.1x ATR) requires the breakout candle to close at least this distance beyond the range boundary, filtering out marginal breakouts that barely clear the box edge. The Trend Filter (default: off, EMA 50) optionally restricts breakouts to the trend direction -- bullish breakouts only fire above the EMA, bearish breakouts only below. Enable this if you want to filter counter-trend setups. Visual toggles let you show or hide the consolidation boxes and breakout arrows independently. Each alert type can also be toggled on or off. Alerts Consolidation Forming -- Fires when price has ranged for the minimum number of bars and a new consolidation zone is confirmed. "Range Box Scalper: Consolidation zone detected. Price is ranging in a tight range." Breakout Up -- Fires when price closes above the consolidation box with volume confirmation. "Range Box Scalper: Bullish breakout from consolidation zone with volume confirmation." Breakout Down -- Fires when price closes below the consolidation box with volume confirmation. "Range Box Scalper: Bearish breakout from consolidation zone with volume confirmation." To set up alerts: click the TradingView Alerts button, select "Range Box Scalper " from the indicator dropdown, choose "Any alert() function call" as the condition, and set your preferred notification method. Best Practices On lower timeframes (1m-5m), reduce Min Range Bars to 5-6 to catch shorter consolidation periods that match the faster price action. On higher timeframes (4H and above), increase Min Range Bars to 12-15 so only significant consolidation zones are flagged. Increase the Volume Confirmation multiplier or Min Breakout Strength if you are getting too many signals -- this ensures only the strongest breakouts are marked. The built-in trend filter (EMA 50) ensures breakouts align with the prevailing trend. Disable it if you want to trade counter-trend setups. After a breakout, the box boundaries (top and bottom) often act as support or resistance on a retest. Part of the DYNA Ecosystem Range Box Scalper is a free indicator built with the same design standards as the DYNA premium suite. For complete trade management with automatic stop loss, break-even, trailing stops, and multi-target systems, explore the full DYNA indicator collection. Disclaimer This indicator is a technical analysis and educational tool only -- it is not financial advice and makes no guarantee of any outcome. Past performance does not predict future results. Always do your own research and use proper position sizing and risk management. Created by Varun Nidhi · varunnidhi.com A free DYNA indicator — self-contained, no repainting. Chỉ báocủa van007trader22
Momentum Shift Detector [DYNA]Momentum Shift Detector pinpoints the exact bar where short-term momentum changes direction. Instead of showing every EMA crossover, it applies four independent filters to surface only the shifts that matter -- giving you clean, actionable turning-point signals directly on your price chart. Most EMA crossover tools flood the chart with signals, many of which occur in the middle of a move when the easy money has already been made. Momentum Shift Detector solves this by requiring four conditions to align simultaneously: the cross itself, a minimum EMA spread threshold to eliminate weak whipsaw crosses, a volume surge confirming real participation, and proximity to a recent swing extreme proving that price actually reversed at a meaningful level. Key Features Quad-Filter Signal Engine -- Combines EMA crossover, EMA spread threshold, volume confirmation, and pivot proximity into a single high-conviction signal Anti-Whipsaw EMA Spread Filter -- Requires the fast and slow EMAs to separate by a minimum fraction of ATR before a cross counts, eliminating weak crosses that immediately reverse Swing Pivot Awareness -- Only fires when the momentum shift occurs near an actual swing high or swing low, filtering out mid-trend noise Volume Confirmation -- Requires above-average volume on the crossover bar, ensuring real market participation backs the shift Confirmed-Bar Logic -- Signals are calculated on closed bars so they never repaint or disappear after appearing Trend-Colored EMA Cloud -- Fast and slow EMAs with a shaded fill that switches between green and red as the trend changes, giving instant directional context Multi-Layer Visual Feedback -- Labeled triangle markers, bar coloring that fades over 3 bars, and a background flash on the shift bar so you never miss a signal How It Works The indicator runs a fast EMA (default period 3) and a slow EMA (default period 8) on every bar. When the fast EMA crosses above the slow EMA, a potential bullish shift is detected. When it crosses below, a potential bearish shift is detected. But the signal does not fire yet. Next, the EMA spread filter checks whether the gap between the fast and slow EMAs exceeds a minimum fraction of ATR(14). This prevents whipsaw signals where the EMAs barely cross before reversing -- a common problem on lower timeframes with choppy price action. Then, the volume filter checks whether the crossover bar had trading volume above the user-defined multiplier (default 1.3x) times the 20-bar average volume. This ensures the shift is backed by genuine market activity, not just thin, random price movement. Finally, the pivot proximity filter checks whether a recent swing low (for bullish shifts) or swing high (for bearish shifts) was detected within a defined number of bars. This is the key differentiator -- it means the momentum flip is happening at a place where price actually turned around, not somewhere in the middle of an existing trend. When all four conditions align, a green triangle labeled "SHIFT" appears below the bar for a bullish flip, or a red triangle above the bar for a bearish flip. The bars around the signal are tinted to match and a subtle background flash highlights the exact moment of the shift. Meanwhile, the fast and slow EMAs are plotted with a color-coded cloud fill that shows the prevailing trend direction at a glance -- green when momentum is bullish, red when bearish. Bullish (green) and bearish (red) momentum shift signals on a 1-minute chart. The EMA cloud provides continuous trend context while triangle markers and bar coloring highlight confirmed shifts. Settings The core settings control the sensitivity of each filter. The Fast EMA Length (default 3) and Slow EMA Length (default 8) define the crossover speed -- shorter values react faster but may produce more signals. The Min EMA Spread (default 0.1) sets the minimum fast/slow EMA gap as a fraction of ATR(14) -- raise it to 0.2-0.3 on higher timeframes or set to 0 to disable. The Volume Multiplier (default 1.3) sets the minimum volume threshold as a multiple of the 20-bar average; raising it to 1.5 will require even stronger volume confirmation. The Pivot Proximity setting (default 5 bars) controls how close the signal must be to a detected swing pivot. The Volume Average Length (default 20) determines the lookback window for calculating average volume. Visual toggles let you independently show or hide bullish and bearish shift markers, the EMA lines and cloud fill, bar coloring around shift events, and the background flash highlight. Alert toggles let you enable notifications for each shift type separately. Alerts Bullish Momentum Shift -- Fires when a confirmed bullish crossover occurs with volume above threshold near a recent swing low. "Momentum Shift Detector : Bullish momentum shift detected." Bearish Momentum Shift -- Fires when a confirmed bearish crossover occurs with volume above threshold near a recent swing high. "Momentum Shift Detector : Bearish momentum shift detected." To set up alerts: click the TradingView Alerts button, select "Momentum Shift Detector " from the indicator dropdown, choose "Any alert() function call" as the condition, and set your preferred notification method. Best Practices Use the dots as confirmation alongside your existing support/resistance levels, trendlines, or other indicators rather than as a standalone entry trigger On higher timeframes (4H, Daily), consider widening the EMAs to 5/13 for smoother signals suited to swing trading If signals are too frequent for your style, raise the Volume Multiplier above 1.3 or increase the Min EMA Spread to 0.2-0.3 to require stronger confirmation Pay attention to signals that cluster at the same price zone across multiple timeframes -- these tend to mark the strongest reversals The pivot proximity filter is the main quality gate; lowering it to 3 allows faster signals while raising it to 7-10 requires more established swing points Part of the DYNA Ecosystem Momentum Shift Detector is a free indicator built with the same design standards as the DYNA premium suite. For complete trade management with automatic stop loss, break-even, trailing stops, and multi-target systems, explore the full DYNA indicator collection. Disclaimer This indicator is a technical analysis and educational tool only -- it is not financial advice and makes no guarantee of any outcome. Past performance does not predict future results. Always do your own research and use proper position sizing and risk management. Created by Varun Nidhi · varunnidhi.com A free DYNA indicator — self-contained, no repainting. Chỉ báocủa van007trader15
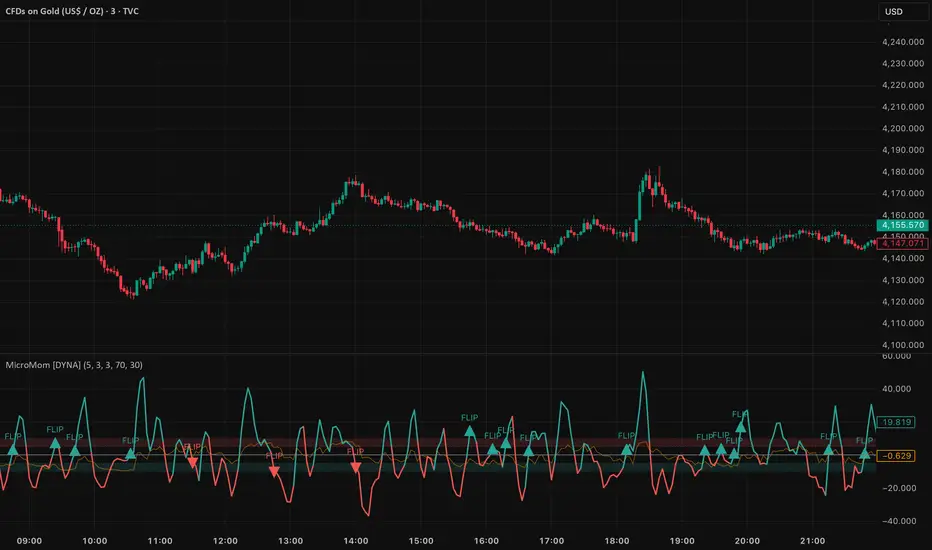
Micro Momentum Oscillator [DYNA]Micro Momentum Oscillator is a purpose-built momentum tool for scalpers who need to know the instant short-term momentum shifts direction. It doesn't just tell you whether RSI is high or low -- it measures how fast RSI is changing and fires a signal the moment that rate of change flips in an extreme zone. Most oscillators lag behind price on micro timeframes. By the time a standard RSI or MACD prints a crossover on a 1-minute chart, the move is already half over. Micro Momentum Oscillator solves this by applying a rate-of-change calculation directly to RSI and smoothing the result with a weighted moving average. The output is a fast, responsive line that turns teal when momentum is accelerating upward and red when it is accelerating downward -- giving you a clean visual read on who is in control right now. Key Features RSI Rate-of-Change Pipeline -- Measures how quickly RSI itself is changing, not just its level. This catches momentum shifts before the RSI line visually turns. OB/OS Zone Flip Detection -- Signals only fire when momentum flips direction while RSI was in an extreme zone (oversold or overbought), filtering out noise in the middle range. Color-Coded Momentum Line -- Teal for bullish acceleration, red for bearish acceleration. No interpretation needed -- the color tells you the direction at a glance. Zone Shading -- Soft red and teal fills in the overbought and oversold momentum zones so you can instantly see when the oscillator is in an extreme area. Confirmed-Bar Logic -- All signals reference the previous bar's values, so flip markers never repaint or disappear after they print. How It Works The oscillator computes a short-period RSI (default 5), then calculates the rate of change of that RSI over the last 3 bars. This raw ROC is smoothed with a 3-period weighted moving average to filter out single-bar noise while keeping the reading fast. The result is plotted as a line that oscillates around zero. When the line is above zero and teal, momentum is pushing RSI higher -- buyers are gaining strength. When the line is below zero and red, momentum is dragging RSI lower -- sellers are in control. The key signal is the momentum flip . When the oscillator crosses above zero and RSI was recently in the oversold zone (below 30), a bullish FLIP marker appears. When it crosses below zero and RSI was in the overbought zone (above 70), a bearish FLIP marker appears. These flips highlight the moments when exhausted momentum reverses direction at an extreme -- exactly the kind of micro-reversal scalpers look for. Micro Momentum Oscillator on a 1-minute BTC chart showing bullish and bearish flip signals at momentum extremes. Visual Elements The oscillator pane shows a teal/red momentum line, a gray zero line, and soft zone shading in the overbought and oversold areas. A thin orange reference line tracks the underlying RSI (scaled to fit the pane) so you can see at a glance whether price is stretched. Triangle markers with "FLIP" text appear at momentum reversal points in extreme zones. Zone shading highlights overbought and oversold momentum areas. The orange RSI reference line shows underlying conditions. Settings The core settings control the speed of the oscillator. RSI Length (default 5) sets the underlying RSI period -- lower values make it more reactive. ROC Length (default 3) controls how many bars of RSI change are measured. Smoothing (default 3) applies a WMA to the ROC output to remove noise without adding significant lag. Overbought and Oversold levels (default 70 and 30) define the RSI thresholds for flip detection. Only momentum reversals that occur when RSI was beyond these levels generate flip markers. You can tighten these thresholds (e.g., 75/25) for fewer but higher-conviction signals, or widen them (e.g., 65/35) for more frequent signals. Visual toggles let you show or hide zone shading and flip markers. Alert toggles let you enable or disable each alert type independently. Alerts Momentum Flip Bullish -- Fires when the smoothed ROC crosses above zero while RSI was in the oversold zone. "Micro Momentum Oscillator : Bullish momentum flip detected. RSI was oversold, ROC now accelerating upward." Momentum Flip Bearish -- Fires when the smoothed ROC crosses below zero while RSI was in the overbought zone. "Micro Momentum Oscillator : Bearish momentum flip detected. RSI was overbought, ROC now decelerating downward." To set up alerts: click the TradingView Alerts button, select "Micro Momentum Oscillator " from the indicator dropdown, choose "Any alert() function call" as the condition, and set your preferred notification method. Best Practices Use on 1-3 minute charts for best results. The default parameters are calibrated for micro-timeframe scalping. Treat FLIP signals as timing cues, not standalone entries. Confirm with a supporting candle pattern, a volume spike, or a key support/resistance level. Avoid trading flips during low-volume periods such as pre-market or lunch hours when momentum readings become noisy. If moving to 5-minute charts, consider increasing RSI Length to 8-10 to maintain signal quality. Pair with a volume indicator or tape reader for stronger confirmation on each flip. Part of the DYNA Ecosystem Micro Momentum Oscillator is a free indicator built with the same design standards as the DYNA premium suite. For complete trade management with automatic stop loss, break-even, trailing stops, and multi-target systems, explore the full DYNA indicator collection. Disclaimer This indicator is a technical analysis and educational tool only -- it is not financial advice and makes no guarantee of any outcome. Past performance does not predict future results. Always do your own research and use proper position sizing and risk management. Created by Varun Nidhi · varunnidhi.com A free DYNA indicator — self-contained, no repainting. Chỉ báocủa van007trader17
Technical Strength Gauge [HexaTrades]Most traders watch a handful of indicators and weigh them by gut feel. Technical Strength Meter does this objectively and at scale: It evaluates 74 indicator votes across 34 technical indicator families, turns each into a single Buy / Neutral / Sell vote, and aggregates those votes into three colour-graded strength gauges, each scored 0-100: Leading, Lagging, and an overall Summary. On top sits an analytics row that translates the raw votes into market context: regime, trend strength, volatility, confidence, probability and an A+ to D quality grade. HOW IT WORKS - THE VOTING ENGINE Each indicator votes : All 74 indicators are evaluated, and each casts exactly one vote: +1 Buy (its bullish condition is met) 0 Neutral (no clear signal) -1 Sell (its bearish condition is met) The voting rule is matched to the indicator's nature: • Oscillators vote by mean reversion, e.g. RSI must be below the oversold level AND turning back up to vote Buy; above the overbought level AND turning down to vote Sell; otherwise Neutral. The same "stretched, then turning" logic drives Stochastic, CCI, Williams %R, MFI, Ultimate, Stochastic RSI, TSI, Fisher and CMO. • Moving averages vote by price location: close above the MA = Buy, below = Sell. This repeats for 10 MA families across 5 lengths (50 votes in total). • Trend tools vote on their own state: Supertrend direction, price vs the Ichimoku cloud, +DI vs -DI, Parabolic SAR side, Linear-Regression slope, Vortex, and so on. Votes are grouped & averaged : The votes split into a Leading set (early movers) and a Lagging set (trend confirmers). Each set is averaged into one number from -1 to +1, and the Summary is the average of the two halves. Weighting & exclusions: By default every vote counts equally, but each gauge is a weighted average: you can scale whole categories (Oscillators / MAs / Trend) up or down, or switch any indicator off. A disabled indicator (weight 0) is dropped from both the average and the counts; it is NOT silently counted as Neutral. On symbols with no volume data, volume-based votes (VWMA, MFI) are auto-excluded the same way, so they don't dilute the score. Score & verdict : Each -1…+1 average is rescaled to a 0-100 score and mapped to a five-step verdict: 0-25 Strong Sell · 25-45 Sell · 45-55 Neutral · 55-75 Buy · 75-100 Strong Buy (Internally: rating <= -0.5 = Strong Sell, <= -0.1 = Sell, between = Neutral, >= 0.1 = Buy, >= 0.5 = Strong Buy.) ⭐️THREE GAUGES • LEADING (16 indicators) momentum / early-mover tools that tend to turn before price: RSI, Stochastic, CCI, Williams %R, MFI, ROC, Momentum, Ultimate Oscillator, Awesome Oscillator, Stochastic RSI, TSI, Fisher Transform, CMO, plus Bollinger, Donchian and Aroon. • LAGGING (58 indicators): trend-followers that confirm an established move: MACD histogram, 50 moving-average votes (10 MA types EMA, SMA, VWMA, WMA, HMA, RMA, ALMA, DEMA, TEMA, KAMA across 5 lengths), and Supertrend, ADX, Ichimoku, Parabolic SAR, Linear Regression, Vortex and DMI. • SUMMARY: the balance of the Leading and Lagging halves; your one-number bias. When the two halves agree, conviction is high; when Leading leads Lagging, a turn may be forming. ⭐️ANALYTICS ROW • MARKET REGIME : Strong Bull / Bull / Sideways / Bear / Strong Bear. Combines five trend engines (Supertrend, Ichimoku, DMI, stacked-MA alignment, LinReg slope) into a directional bias, then gates it with ADX: low ADX = Sideways; high ADX + strong bias = a "Strong" trend. • TREND STRENGTH % : how strong and aligned the trend is, blending the size of that directional bias with ADX magnitude. • VOLATILITY : Low / Normal / High / Extreme, from the percentile rank of Bollinger Band width over the last 100 bars (so it adapts to each symbol). • CONFIDENCE % : how trustworthy the current reading is: a blend of decisiveness (how far Summary is from neutral), Leading–Lagging agreement, and vote consistency. • BULL / BEAR PROBABILITY % : the weighted balance of all votes, always summing to 100. • SIGNAL-QUALITY GRADE : A+ to D, a composite of Confidence, Trend Strength and favourable volatility, for a quick "is this a clean setup?" read. ⭐️ SETTINGS GUIDE Layout : anchor position, total width, summary size, height, compact mode, per-gauge show/hide, the five MA lengths, and toggles for the analytics row and breakdown table. Signals & timeframe: analysis timeframe (MTF), confirm-on-close, Strong and normal Buy/Sell arrows, the signal trigger levels, the ADX whipsaw filter, background tint and the volatility alert. Indicator periods : lengths for RSI, Stochastic, CCI, MFI, Williams %R, ROC, Momentum, ADX/DMI, Bollinger and MACD. Overbought / Oversold: the OB/OS thresholds for RSI, Stochastic, MFI, Ultimate Oscillator, CCI and Williams %R. Analytics thresholds: the ADX bands for regime and the percentile bands for volatility. Weights & toggles: category weights (Oscillators / MAs / Trend) and an on/off switch for all 34 named indicators. Colors: the full Strong-Sell to Strong-Buy palette and table colours. Signals are calculated using closed-bar data when "Confirm on Close" is enabled. The indicator does not intentionally use future data or repaint historical signals. ⭐️How to use Context first: read Market Regime and Volatility. "Strong" regimes favour trend-following; "Sideways" favours mean-reversion or standing aside; "Extreme" volatility means wider stops and more false breaks. Bias: read the Summary gauge and its 0–100 score: your single-number lean. Alignment:compare Leading vs Lagging. Both same side = confirmed conviction; Leading ahead of Lagging = possible early turn; disagreement = mixed/choppy, so smaller size or wait. Quality: check Confidence % and the A+…D Grade. An A-grade Strong Buy in a Strong Bull regime ≠ a borderline Buy in chop. Execute: use the Buy/Sell arrows as visual triggers, or attach the built-in alerts. Make it yours: shorter periods/lower triggers for scalping, longer/higher for swing; re-weight or disable indicators you don't trust; set an Analysis timeframe to read a higher TF from a lower chart. ⭐️ BEST USE CASES Best suited for: • Trend confirmation and trend-following strategies • Market regime analysis (Bull, Bear, Sideways) • Multi-indicator consensus and bias assessment • Swing trading and position trading • Day trading and intraday market analysis • Higher-timeframe directional bias and confirmation • Identifying alignment between momentum and trend indicators Not designed for: • Standalone trade entries without additional analysis • Predicting exact tops, bottoms, or reversals • Guaranteed market forecasts or future price predictions • Fully automated trading systems without validation • Replacing risk management, position sizing, or trading plans Technical Strength Meter combines the signals of 74 widely used technical indicators into a single, transparent decision-support framework. By separating indicators into Leading and Lagging categories, the indicator helps traders identify potential turning points, confirm established trends, and understand the overall market bias at a glance. Rather than relying on a single indicator, it provides a structured consensus view supported by market regime, volatility, confidence, probability, and signal-quality analysis. Whether used for scalping, day trading, or swing trading, the goal is to simplify complex technical data into actionable market context while keeping every vote visible and explainable. We would love to hear your suggestions. If you have ideas for new features, indicators, analytics, or improvements, please share your feedback. Your input helps guide future updates and improve the indicator for all traders. For educational and informational purposes only. This indicator is designed to assist technical analysis and should not be considered financial, investment, or trading advice. Chỉ báocủa HexaTrades44422
Hy ZMD Dashboard ChecklistIf you've ever used Sonic R to analyze trends, this indicator will save you time. The indicator doesn't help you trade better; it only helps you hold your money longer.Chỉ báocủa huyassana4092
EMA Ribbon [Proozac]A 5-period EMA ribbon designed for fast visual trend identification, with end-of-line labels so each moving average is instantly recognizable without hovering over the chart. How it works Plots five exponential moving averages (9, 15, 30, 65, 200 by default) color-coded for quick reference. When all 5 EMAs align in perfect ascending or descending order, the chart background shades green or red to confirm a clean trend structure — the same "ribbon alignment" signal experienced traders use to filter entries. Cyan — EMA 9 (fastest) Orange — EMA 15 Green — EMA 30 Yellow — EMA 65 White — EMA 200 (slowest) Right-edge labels Each EMA line has a label pinned to the current price level on the right edge of the chart, color-matched to its line. Labels move dynamically with both horizontal scroll and vertical price scaling, so you always know which line is which at a glance. Crossover signals Triangle markers flag crossovers between the fast (EMA 9) and mid (EMA 30) average — the most relevant short-term trend shift in the ribbon. Background shading 🟢 Green tint — all 5 EMAs in bullish order (9 > 15 > 30 > 65 > 200) 🔴 Red tint — all 5 EMAs in bearish order (9 < 15 < 30 < 65 < 200) Configurable parameters All 5 EMA periods individually adjustable Fully customizable colors Toggle right-edge labels on/off Alerts for EMA 9/30 crossovers and full ribbon alignment Recommended use Built for intraday trend-following setups on indices and futures, particularly effective alongside VWAP and volume-based confirmation tools.Chỉ báocủa Proozac983
Intraday Trend Ribbon [DYNA]Intraday Trend Ribbon plots eight Fibonacci EMAs (8, 13, 21, 34, 55, 89, 144, 233) as a single coloured ribbon stacked on price. When the EMAs are perfectly fanned -- fastest on top -- the ribbon turns green and the chart background lights up bullish. When they are stacked the other way it turns red. Mixed and compressed? The ribbon goes grey and the indicator flags chop. The result is an at-a-glance read on whether the momentum, swing, and trend timeframes agree. Most ribbon indicators colour every line with a separate state, leaving you to interpret the soup. This one collapses the eight EMAs into three regimes -- fully bullish, fully bearish, chop -- and wraps the chart background in the matching colour, so trend regimes, transitions, and consolidations are obvious without staring at line crossovers. Key Features Eight Fibonacci EMAs -- 8, 13, 21, 34, 55, 89, 144, 233 by default; every period is configurable. Strict Alignment Detection -- The ribbon registers as bullish or bearish only when all eight EMAs are in strict monotonic order. No half-aligned states, no false trend signals. Chop Filter -- A built-in compression detector flags windows where the ribbon collapses into a tight band, using ribbon width / ATR as the yardstick. Tunable via a single threshold input. Background Regime Highlight -- Soft green / red when the ribbon is fully aligned, soft amber when chop is active. Toggleable. Per-Line Transparency Gradient -- The fastest EMA is opaque; slower EMAs fade gradually so the ribbon reads as a single colour-graded fan rather than eight competing lines. Three Alerts -- Bullish flip, bearish flip, chop start. All gated on confirmed bar close, no repainting. No Repainting -- Every alert compares the current confirmed bar's state to the previous bar's state. Historical signals never move. How It Works The indicator computes eight EMAs of the configured source (default close) at the eight periods. Each bar it checks two conditions: Fully bullish = ema8 > ema13 > ema21 > ema34 > ema55 > ema89 > ema144 > ema233 Fully bearish = the mirror The ribbon colour is set by which (if any) of these holds. For chop, the ribbon's vertical span (max EMA minus min EMA) is divided by the current ATR; if the result is below the configured ceiling AND the ribbon is mixed (neither bullish nor bearish), the bar is marked as chop. ATR scaling makes the chop threshold work the same way across instruments and timeframes. Edge events fire only on the first confirmed bar of a new state -- the first bar that becomes fully bullish, the first bar that becomes fully bearish, the first bar that enters chop. Comparing each bar's state to the prior bar's state guarantees no repainting. The eight-EMA Fibonacci ribbon coloured by alignment state. Green fan = fully bullish, red fan = fully bearish, grey = mixed. Background tints amplify the regime; amber background marks chop windows. Settings EMA Source (default: close) sets the price feed for every line. The eight period inputs ( EMA 1 through EMA 8 , defaults 8 to 233) define the ribbon; replace them with any other set if you prefer non-Fibonacci spacing. Detect Chop (default: on) enables the compression detector. Chop ATR Length (default: 14) sets the ATR period, and Chop Width / ATR Ceiling (default: 0.5) controls strictness -- raise toward 1.0 for more frequent chop flags, lower toward 0.3 to flag only the tightest compressions. Show EMA Lines , Shade Between EMAs , and Background When Aligned are independent visibility toggles. Line Transparency (fastest) (default: 0) controls the opacity of the fastest line; the slower lines fade gradually from there. The three alert toggles enable / disable the bullish-flip, bearish-flip, and chop-start alerts independently. Alerts Ribbon Fully Bullish -- Fires on the first confirmed bar where the ribbon enters a fully bullish stack. "Intraday Trend Ribbon : Ribbon flipped fully bullish -- all 8 EMAs stacked fast over slow." Ribbon Fully Bearish -- Fires on the first confirmed bar where the ribbon enters a fully bearish stack. "Intraday Trend Ribbon : Ribbon flipped fully bearish -- all 8 EMAs stacked fast under slow." Ribbon Tangled (Chop) -- Fires on the first confirmed bar where the ribbon becomes compressed and unaligned. "Intraday Trend Ribbon : Ribbon entered chop -- EMAs compressed and unaligned." To set up alerts: open TradingView's Alerts panel, choose "Intraday Trend Ribbon " from the condition dropdown, pick one of the three alert variants, and select your notification channel. Best Practices Trade only with the regime. When the green or red background is active, the ribbon agrees on direction -- this is the highest-edge environment for trend setups. Use counter-trend setups only when there is no background tint. Treat the slower EMAs (89, 144, 233) as dynamic trailing stops in a clean trend. A close that decisively crosses and stays beyond the 233 EMA usually marks the end of a regime. Use ribbon-width changes to read momentum. A widening fan = accelerating trend; a contracting fan = trend losing energy. Skip trades during the amber chop background. The compression flag catches typical midday consolidations and news-pause windows that most trend systems struggle with. Match the timeframe to your holding period. 1m / 5m flips often, 1h / 4h flips rarely. Pick the one whose flip cadence matches the trades you actually take. On instruments with very low volatility (post-close FX, holiday sessions), raise the Chop Width / ATR Ceiling so the chop filter does not stay active permanently. Part of the DYNA Ecosystem Intraday Trend Ribbon is a free indicator built with the same design standards as the DYNA premium suite. For complete trade management with automatic stop loss, break-even, trailing stops, and multi-target systems, explore the full DYNA indicator collection. Disclaimer This indicator is a technical analysis and educational tool only -- it is not financial advice and makes no guarantee of any outcome. Past performance does not predict future results. Always do your own research and use proper position sizing and risk management. Created by Varun Nidhi · varunnidhi.com A free DYNA indicator — self-contained, no repainting. Chỉ báocủa van007trader15
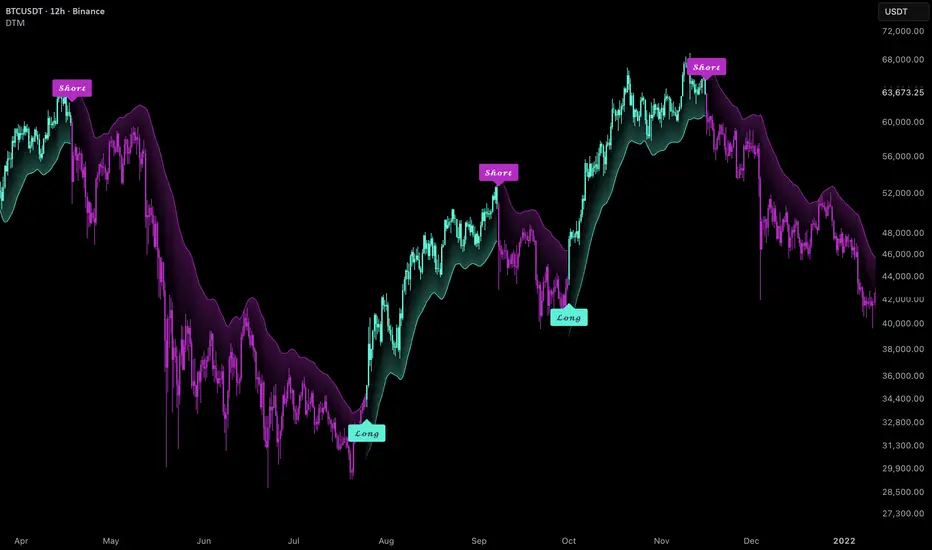
Uptrick: Dynamic Trend MatrixOverview Dynamic Trend Matrix is an open-source trend-following overlay designed to help traders read market direction, trend strength, pullback areas, and optional take-profit progress from one chart-based tool. It is built to provide a structured view of trend conditions without relying on a single crossover or one isolated signal. Introduction The script combines EMA-based trend structure, ATR-based volatility bands, a dynamic trailing engine, candle coloring, signal labels, X-marker re-entry logic, take-profit markers, alerts, and a compact dashboard. Its goal is to make trend conditions easier to interpret by separating the main trend state, pressure confirmation, pullback behavior, and target tracking into clear visual components. Originality & Uniqueness Dynamic Trend Matrix uses a custom trend state model that blends moving-average alignment, smoothed slope pressure, ATR volatility boundaries, adaptive trailing logic, visual strength coloring, and staged take-profit tracking. Instead of only showing a basic moving average crossover or a simple band break, the script organizes trend information into multiple layers. The trend flip logic identifies directional changes, the pressure filter evaluates whether EMA structure supports the active side, the trail helps show the active trend boundary, and the X markers highlight pullback interactions near the trend trail. This layered design allows users to view both trend direction and trend quality, while keeping the chart visually organized. How It Works The script calculates fast, base, and slow EMA trend components from the selected source. These moving averages are used to measure directional structure and help determine whether the market is showing bullish, bearish, or mixed pressure. ATR-based bands are then built around the base trend. A long trend state is triggered when price breaks above the upper ATR band, while a short trend state is triggered when price breaks below the lower ATR band. Once a trend state is active, the script maintains a dynamic trailing level that adjusts with volatility and trend direction. Trend pressure is confirmed when the EMA structure and smoothed slope agree with the active trend. Trend strength is calculated by comparing the distance between the fast and slow trend components against ATR. This strength reading is used for dashboard values and optional candle coloring. The take-profit system uses the active signal price and either risk from the trail or ATR from entry to create up to three visual target levels. These levels are for chart reference only and are not automated trade management. Inputs The main settings allow users to adjust the trend lengths, smoothing, ATR length, ATR multiplier, visual style, candle coloring method, signal confirmation, label appearance, X-marker behavior, take-profit calculation mode, dashboard position, and alert options. The default settings are intended to provide a balanced trend-following view, but users should adjust them based on the market, timeframe, and volatility conditions they are studying. Features Dynamic trend flip detection using ATR-adjusted band breaks. EMA-based trend structure using fast, base, and slow trend components. Smoothed slope pressure filter to help distinguish stronger trend alignment from mixed conditions. Adaptive trail that follows the active trend and adjusts with volatility. Multiple visual modes, including bands, trend trail, and candles only. Candle coloring based on either latest trend direction or trend strength. Optional gradient visuals to make active trend zones easier to read. Optional outer bands for additional volatility context. Long and short signal labels with optional bar-close confirmation. X-marker re-entry logic for pullback touches near the dynamic trail. Configurable X-marker behavior, including first valid marker only or every valid marker. Optional take-profit markers with one, two, or three target levels. Take-profit calculations based on either risk from trail or ATR from entry. Dashboard showing trend state, pressure, strength, trail value, visual mode, and TP state. Alert conditions for long signals, short signals, X markers, and take-profit hits. How To Use Add the indicator to a standard candlestick chart and select the visual mode that best fits your workflow. The Bands mode provides a broader view of volatility zones around the trend basis. The Trend Trail mode focuses more directly on the active trailing level. Candles Only mode keeps the chart cleaner while still showing trend-based candle colors. Long and short labels can be used as potential trend-change signals. The trail can be used as a visual reference for the active trend boundary. X markers are designed to show valid pullback interactions near the trail after a trend has already been established. The dashboard provides a quick summary of current conditions, including trend state, pressure, strength, trail value, visual mode, and TP progress. Users who prefer confirmed signals can keep bar-close confirmation enabled. Users who want faster realtime feedback can disable confirmation, but signals may be less stable before the candle closes. Limitations This indicator is not a complete trading system and does not guarantee profitable results. It does not include position sizing, stop-loss execution, order management, commissions, slippage, or full strategy backtesting. Signals may appear late during fast reversals because the model uses EMAs, smoothing, ATR bands, and trend confirmation. Sideways, choppy, or low-volatility markets may produce false flips, mixed pressure readings, or less useful pullback markers. Take-profit markers are visual reference levels only. They do not guarantee that a trade should be entered, held, exited, or managed in a specific way. Users should test settings across different symbols, sessions, and timeframes before relying on the script for live decision-making. The script does not use request.security(), lookahead, or negative plot offsets. With bar-close confirmation enabled, Long, Short, X-marker, and TP signals are confirmed after the candle closes. If confirmation is disabled, realtime signals may appear or change before the candle closes. The script should be used on standard chart types because non-standard charts can affect signal behavior. Conclusion Dynamic Trend Matrix is designed to provide a clean visual framework for reading trend direction, trend pressure, pullback context, and staged target progress. It can help organize trend-following analysis, but it should be used alongside market structure, risk management, and broader chart context. Disclaimer This script is for educational and informational purposes only. It does not provide financial advice, investment advice, trading advice, or guaranteed outcomes. Trading involves risk, and users are responsible for their own analysis, decisions, and risk management.Chỉ báocủa Uptrick33644
Clean Trend System - HTF Bias FilteredClean Trend System - HTF Bias Filtered Overview Clean Trend System is a trend-following strategy designed to identify high-probability market moves by combining lower timeframe price action with higher timeframe trend confirmation. The system filters trades using EMA structure, VWAP, RSI momentum, breakout detection, and an automatic Higher Timeframe (HTF) bias filter to avoid trading against the bigger trend. Key Features ✅ Automatic HTF Trend Bias - Automatically selects a higher timeframe based on the chart timeframe. - Confirms bullish/bearish market direction using HTF EMA alignment. ✅ Multi EMA Trend Structure - Fast EMA, Slow EMA, and Trend EMA identify market structure. - Trades are only considered when the trend is aligned. ✅ VWAP & EMA Pullback Entries - Detects pullbacks into EMA/VWAP zones. - Looks for continuation entries with confirmation candles. ✅ Breakout Detection - Includes recent high/low breakout logic. - Captures momentum continuation moves. ✅ Momentum Filter - Uses ROC momentum and Z-score logic to identify stronger moves. - Background shading helps visualize momentum conditions. ✅ RSI Confirmation - Filters weak signals and helps avoid overextended entries. ✅ Signal Control - Prevents repeated signals in the same direction. - Resets when trend conditions change. Buy Conditions (Simplified) A BUY signal appears when: - Lower timeframe trend is bullish - Higher timeframe bias is not bearish - Momentum and RSI conditions confirm - Pullback or breakout setup is detected Sell Conditions (Simplified) A SELL signal appears when: - Lower timeframe trend is bearish - Higher timeframe bias is not bullish - Momentum and RSI conditions confirm - Pullback or breakdown setup is detected Recommended Usage - Works best in trending markets. - Can be used on intraday and swing timeframes. - Always combine with proper risk management. Disclaimer This script is for educational and research purposes only. It is not financial advice. Past performance does not guarantee future results. Always test and adjust settings for your market.Chiến lượccủa Pridarasx93
DAX Trading Lab MTF BUY/SELL Dashboard v1.5Unlock the power of the DAX40 with this precision M5 indicator, engineered specifically for high-frequency scalpers. Designed around the powerful Market Cycles framework, it seamlessly identifies key phases of Accumulation, Manipulation, and Distribution. Spot precise institutional traps and ride explosive distribution moves with absolute confidence and sharp clarity.Chỉ báocủa tiongsean22
RTH MA Pack**RTH MA Pack — EMA 9 + WMA 20/40/100/200** This indicator displays a moving average pack designed specifically for the regular U.S. market session. It includes: * EMA 9 * WMA 20 * WMA 40 * WMA 100 * WMA 200 The indicator completely ignores premarket and postmarket data. All moving averages are calculated only during regular trading hours, from 9:30 AM to 4:00 PM New York time. At the end of the regular session, the indicator saves the final value of each moving average. During premarket and postmarket, those values remain fixed at the previous regular session close. When the market opens again, the moving averages continue calculating from the saved values without restarting and without using extended-hours data. Main features: * Calculates only with RTH data. * Ignores premarket and postmarket. * Saves the previous session’s closing MA values. * Continues calculation from the saved values at the next market open. * Includes EMA 9 and WMA 20/40/100/200. * Useful for tickers where the chart session cannot be manually adjusted. This tool is designed for traders who want clean regular-session moving averages without extended-hours price action distorting the calculation. Chỉ báocủa danyoptiontrading5
Trend Setup - 3 EMA + RSI Dashboard📊 TREND SETUP — EMAs + Live RSI Dashboard A clean, all-in-one trend tool combining the 3 most-used EMAs with a real-time RSI dashboard — no need to load multiple indicators separately. ✅ EMA 50 / 100 / 200 — fully configurable (period, source, color, on/off) ✅ Live RSI Dashboard — shows current RSI value, overbought/oversold levels, and a real-time status alert, displayed in a sleek table instead of a cluttered separate pane 🎯 WHY THIS COMBO EMAs give you the big-picture trend direction, while the RSI dashboard tells you instantly if price is stretched (overbought/oversold) — without needing a second indicator slot, perfect if you're on a free TradingView plan and want to save your indicator limit. 🔧 FULLY CONFIGURABLE — Toggle each EMA on/off independently — Set your own RSI period and overbought/oversold levels — Adjust dashboard text size 💡 HOW IT WORKS The RSI dashboard updates live as new candles form, showing: — Current RSI value — Upper/Lower band levels — Alert status (Overbought ↑ / Oversold ↓ / Neutral →) 💬 Got a suggestion for the next version? Drop a comment below — I'm actively building more setups based on community feedback. If this helped your charts, a like goes a long way 🙏Chỉ báocủa Wolfi_FX7
Turtle Soup Strategy with 1-Bar ConfirmationCatching Institutional Traps: The Turtle Soup 1-Bar Confirmation MechanicsIn high-frequency and algorithmic trading environments, traditional breakout strategies frequently fall victim to institutional stop-hunts. When price breaks past an established 20-bar extreme, retail momentum systems are triggered to buy or sell the expansion. Concurrently, institutional market makers utilize these concentrated liquidity pockets to fill large counter-positions, resulting in sharp rejections known as "fakeouts".This publication presents the core structural mechanics of a refined Turtle Soup Reversal Model with Strict 1-Bar Confirmation. Rather than attempting to trend-follow highly volatile breakout expansions, this system introduces an automated state-machine architecture engineered to locate, track, and execute trades alongside institutional order absorption. 💎 Key Architectural & Analytical PillarsTo maintain strict execution data discipline on lower timeframes, the script is structured around three proprietary processing frameworks: 1. Zero-Lag Pure Price Action CoreUnlike classic reversal oscillators (RSI, Stochastic, or MACD) that require compounding mathematical averages—which naturally introduces execution lag—this logic operates exclusively on raw spatial thresholds. By plotting step-line boundaries from static historical peaks and troughs, the exact tick distance of structural sweeps can be monitored without lagging indicators distorting the entries. =================================== (20-Bar Historical High) ▲ (The Sweep Wick: Price pierces high) │ ▼ (The Trap Snap: Next candle closes below low) ----------------------------------- (Setup Invalidation Floor) 2. The Multi-Phase State Isolation Engine To completely eliminate signal stacking and duplicate arrow cluster errors during highly volatile flushes, the logic utilizes a sequential State Machine Processor. State 0 (Ready / Flat): The script searches the chart data for a valid historical boundary breach. State 1 / -1 (Trap Active Zone): The moment a candle's wick runs outside the channel lines, the engine halts further search processing. It locks onto that specific bar index, saves its high/low coordinates as unique reference vectors, and opens a strict conditional confirmation window. 3. Strict 1-Bar Confirmation ValidationThe definitive edge of this strategy lies in its restricted window constraint: bar_index == setupBarIndex + 1.If a market-maker stop-hunt is legitimate, the price must immediately fail and reverse back inside the range on the very next candle. If the market continues to expand aggressively against the level for 2 or more bars, the state machine automatically self-resets to 0, clearing all variables. This mathematical restriction prevents the script from attempting to "catch a falling knife" during real macro trend expansions.Chỉ báocủa Pridarasx52
Dr. David Paul Earnings Swing System VectorVest v3 Multi-TFBuy signal fixed. Added Toggle for time chart periods optimization settings Chỉ báocủa PJ_FatCatCập nhật 27