Yen SMA50 day moving average study that has outer lines overlayed by 10. For credit spreads, only trade if price is inside orange lines.Chỉ báocủa onatski12
MACD Momentum Entry Engine [trade_w_samet]🎯 MACD Momentum Entry Engine MACD Momentum Entry Engine is a structured momentum-analysis and visual trade-model indicator designed to help traders study confirmed MACD events, momentum quality, directional persistence, market regime, trend alignment, candle confirmation, and multi-target risk references directly from one coordinated workflow. The script is built around one central idea: A MACD event should not automatically become an entry signal. Instead of treating every MACD crossoveChỉ báocủa tradewsamet1 2 K
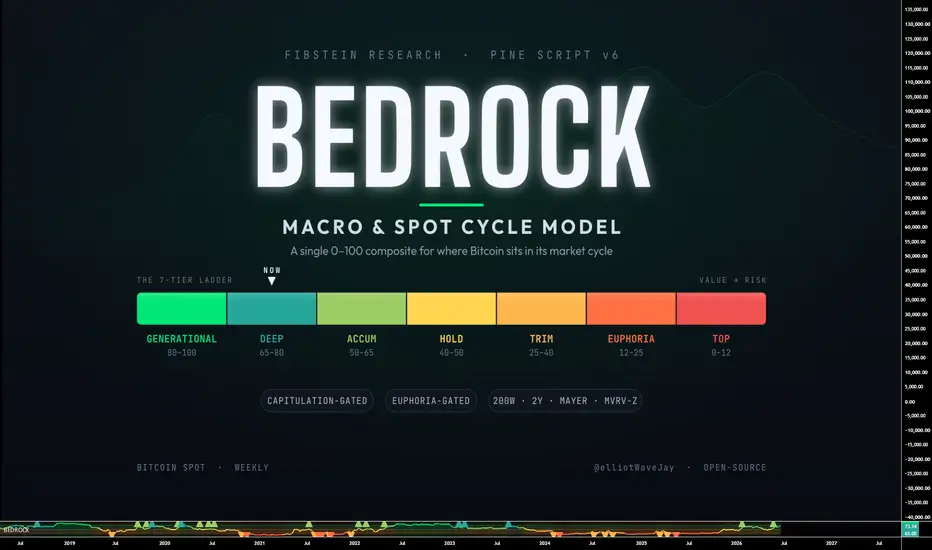
BEDROCK Gated Macro Spot Cycle ModelBEDROCK condenses several independent long-term Bitcoin valuation models into a single transparent 0–100 score, then maps that score onto a seven-tier ladder running from deep value to cycle-top risk — with capitulation and euphoria gates that hold back the two most common false signals at each extreme. It is built for spot investors making multi-month and multi-year allocation decisions, not for short-term trading. The reference card below shows how to read the model and how each tier behaves:Chỉ báocủa JayFibStein3103
TW - Dual FlowZone MA Clouds## Dual FlowZone MA Clouds Dual FlowZone MA Clouds is a trend visualization indicator designed to help traders quickly identify market direction, trend strength, and potential transitions before they become obvious. Unlike traditional moving average indicators that simply plot one or two averages, Dual FlowZone MA Clouds uses two independent FlowZones to provide both short-term momentum and longer-term trend context in a single, easy-to-read visualization. FlowZone A is designed to help identChỉ báocủa christophercberg10
Trend Regime Filter (10EMA/20SMA/50SMA)Based on the Qullamagie system this filter helps you identify favourable environments to trend trade and try more breakouts Chỉ báocủa rxs3Cập nhật 13
Custom EMA Crossover Arrow HeadsThe Custom EMA Crossover Arrow Heads indicator is a simple trend-following tool designed to highlight short-term momentum shifts using two Exponential Moving Averages. By default, it plots a 3 EMA and an 8 EMA directly on the price chart, while allowing users to customise both EMA lengths and colours. When the faster EMA crosses above the slower EMA, the indicator displays a green bullish triangle above the candle, signalling potential upward momentum. When the slower EMA crosses above the fastChỉ báocủa buttigieg_sean19
Multi-MA Slope, ADX TradingView Script Description Suggested Title: Advanced Multi-MA Slope, ADX & Cross System v8.0 🚀 Strategy Overview Welcome to v8.0 of the popular Advanced Moving Average series, completely rewritten and optimized from scratch under the latest Pine Script v6 architecture. This update brings massive speed, memory efficiency, and execution precision to your backtesting and live trading. Unlike traditional single-indicator setups, this version introduces a highly scalable Dynamic Multi-MA CorChiến lượccủa hkbayramCập nhật 335
Stock Stage Analysis [JS]This indicator classifies a stock into four stages: Stage 1 — Basing / Consolidation The stock is not in a clear uptrend or downtrend. The long-term moving average is relatively flat, the moving averages are compressed, and price is moving inside a defined range. Stage 2 — Advancing / Accumulation This is the preferred environment for long-side pullback setups. Price is above key moving averages, the moving averages are properly aligned, the slow MA is rising, and the stock is trading closer tChỉ báocủa JS_TechTrading138
50MA ATR ExtensionThis indicator measures how many 14-day ATRs price is trading away from its 50-day moving average. It's designed to identify when a trend has become unusually stretched relative to recent volatility.Chỉ báocủa davidscutt4
SBP Structured Trend Indicator# SBP Structured Trend Indicator ## Overview SBP Structured Trend Indicator is a trend-following decision support tool designed to evaluate market structure through multiple layers of confirmation instead of relying on a single technical indicator. Rather than generating signals from one moving average crossover or momentum oscillator, the indicator evaluates the agreement between several independent market characteristics before identifying a potential trading opportunity. The objective is tChỉ báocủa sbprasad2005Cập nhật 37
MTF Confluence PanelThis script gives you a clean, uncluttered view of six different timeframes at once. For each timeframe, it shows the 9 and 21 EMA crossover and trend direction, the RSI value, VWAP, 50 EMA, the overall bullish or bearish consensus, and both price level and volume strength. Everything is neatly organized so you can quickly see the bigger picture without switching charts.Chỉ báocủa hesh225212
Price Action Bands | Trend & Volatility [RadixAlgo]🔶 About the Indicator Price action often looks simple after the move is complete, but while the market is moving, traders usually need more context to understand whether price is trending, overextended, pulling back, or simply moving inside normal volatility. This price action indicator was built to make this context easier to read directly on the chart. It combines a dynamic moving average baseline with upper and lower volatility bands, giving traders a structured way to follow trend directChỉ báocủa RadixAlgo262
3 Line Strike [TTF] mit EMA 50This script is an updated, highly optimized Pine Script v6 version of the classic 3-Line Strike overlay, specifically tailored for trend continuation strategies. It filters out low-probability counter-trend setups by introducing a strict 50 Exponential Moving Average (EMA) body filter. Key Features: 3-Line Strike Identification: Automatically spots the 4-candle continuation pattern (3 consecutive bearish/bullish candles followed by a powerful opposite-colored engulfing candle). Strict 50 EMA Chỉ báocủa Totya8819
Multi Trend Score OscillatorsOscillators Multi Trend score Part 1: How the Indicator Works Under the Hood //The script evaluates the market using three independent concepts: Trend Direction, Momentum, and Market Regime (Volatility). It works on a strict point system that ranges between a maximum bullish score of +2.0 and a maximum bearish score of -2.0. Trend Filter (Moving Averages): Max +/- 1.0 Point It checks a fast 15 EMA and a slower 50 EMA. Bullish (+1.0): If the 15 EMA is above the 50 EMA and the price is tradiChỉ báocủa malqaizi14
5 EMAs 10/21/30/40/63Plots five Exponential Moving Averages used in multi-timeframe trend analysis and stage analysis methodology: EMA 10 (Green) — Short-term trend momentum EMA 21 (Navy) — Pullback support / swing trade baseline EMA 30 (Orange) — Stage analysis reference (Weinstein methodology) EMA 40 (Red) — Uptrend defence line; loss signals weakening trend EMA 63 (Maroon) — Downtrend defence line; ~3-month average Usage: • Price above all EMAs in correct order (10 > 21 > 30 > 40 > 63) signals a strong Chỉ báocủa vodapn5
ETH 200W MA Valuation Bands (v6 stable)Displays ETH price ranges relative to the weekly 200-period moving average, highlighting long-term valuation bands from Very Cheap through Very Expensive. The indicator draws shaded zones and price lines at -50%, 0%, +50%, and +100% of the 200W MA, making it easy to see whether current price is in a deep-value, fair-value, or overextended range. Includes right-side labels for the moving average and each key band, plus optional zone names for quick interpretation.Chỉ báocủa tismail844
BTC 200W MA Valuation Bands (v6 stable)A TradingView Pine Script indicator that overlays Bitcoin’s 200-week moving average with dynamic valuation bands and validates price ranges against expected long-term trend levels. This version includes: 200W MA trend baseline Upper/lower valuation bands for overbought/oversold zones Price-range validation to highlight when BTC is trading inside, near, or beyond structural range boundaries Clean visual display for macro BTC market cycles Stable v6 implementation for reliability and performance Chỉ báocủa tismail8413
Liquidity Rejection Areas (LRA)Overview Liquidity Rejection Areas (LRA) is a price-action and liquidity-based trading indicator designed to identify liquidity sweeps, rejection zones, and potential institutional reversal areas directly on the chart. The indicator helps traders visualize where market participants may have been trapped after liquidity is taken above swing highs or below swing lows. By combining liquidity concepts with rejection confirmation, LRA Pro highlights high-probability reaction zones across CryptoChỉ báocủa Jos-ProTraderCập nhật 1776
EMA Cross Signals EMA Cross Signals is a clean trend-following indicator designed to help traders identify potential trend continuation and reversal areas using dual exponential moving averages. The indicator automatically highlights bullish and bearish crossover events while keeping the chart simple and easy to read. Features • Automatic Buy & Sell signal labels • Fast EMA and Slow EMA trend filtering • Visual trend confirmation using dual EMA lines • Works on Forex, Gold, Silver, Crypto, Stocks, and IndicesChỉ báocủa Jos-ProTraderCập nhật 96
DaXtreme SPY Command Center**DaXtreme SPY Command Center** is a rule-based trading system designed specifically for SPY options trading. Rather than predicting market direction, it waits for multiple independent confirmations before generating a trade signal. The strategy is built around a 9:30–9:45 AM Opening Range Breakout (ORB), using the ORB High and ORB Low as the session's primary decision levels. Once the opening range is established, the script evaluates trend, momentum, participation, and market structure before Chỉ báocủa hakeemdaxtreme5xt41Cập nhật 19
Swing Momentum Pullback Strategy + ChecklistSwing Momentum Pullback Strategy + Checklist This indicator is a complete swing trading system designed to help traders identify trend breakouts and low-risk momentum pullbacks, optimized for the Daily Timeframe. The script combines a long-term trend filter, automated resistance detection, and specific entry triggers into a single chart overlay, along with a real-time Strategy Checklist Dashboard that confirms setups at a glance. ───────────────────────────────── 🎯 CORE COMPONENTS ────────Chỉ báocủa BullishBullRising15
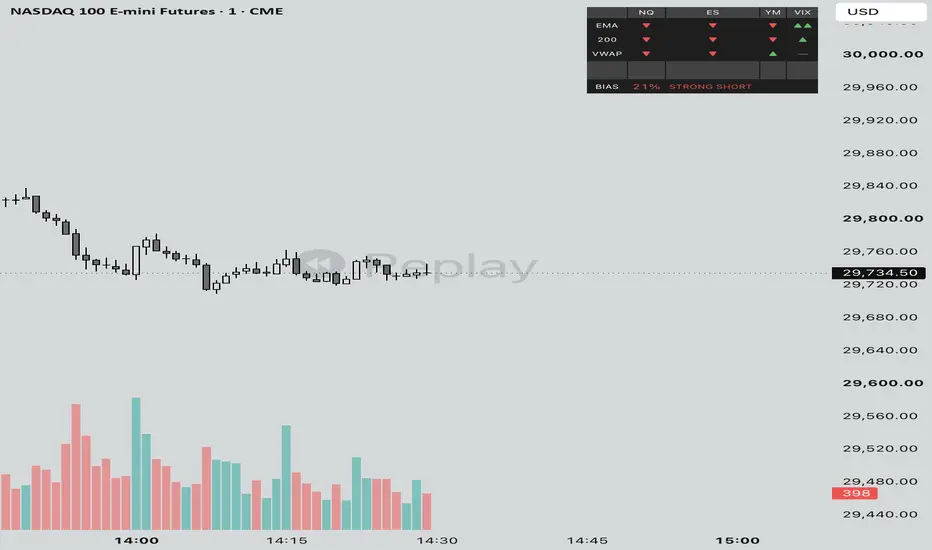
Correlated Assets TableA quick cross-check on whether the rest of the complex agrees with you. It tracks NQ, ES, YM, and the VIX and shows, for each, where price sits against an EMA envelope. A move with all three indices pulling the same way and VIX cooperating is worth more than NQ running by itself. Only take your chart's signal when the table backs it, and treat a split as a yellow light. Each symbol comes in through request.security, so the values settle as bars close. It's confirmation, not a precise entry clockChỉ báocủa AdaptiveIndicators3
NY Open Anchored VWAP (+2/+3 bands)A VWAP that anchors to the New York open instead of the default session start, with bands at 2x and 3x deviation and fills in between. Anchoring at the open means the line only reflects today's auction, which is a cleaner fair-value read intraday, and the outer bands flag where moves tend to stall or snap back. Above the line buyers have it, below it sellers do, and the +2/+3 are your over-extension zones. Self-contained, one symbol, no outside pulls, so it won't repaint. Anchored VWAP itself isChỉ báocủa AdaptiveIndicators27