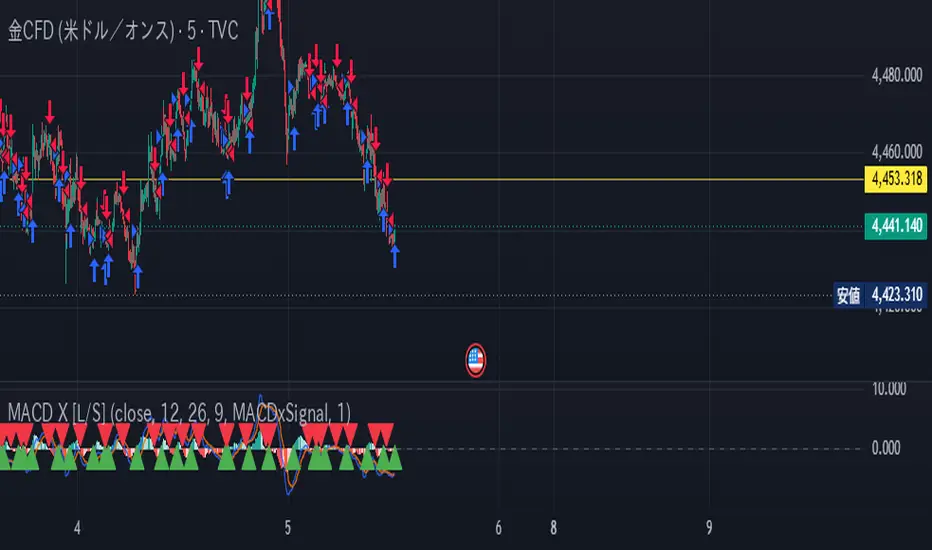
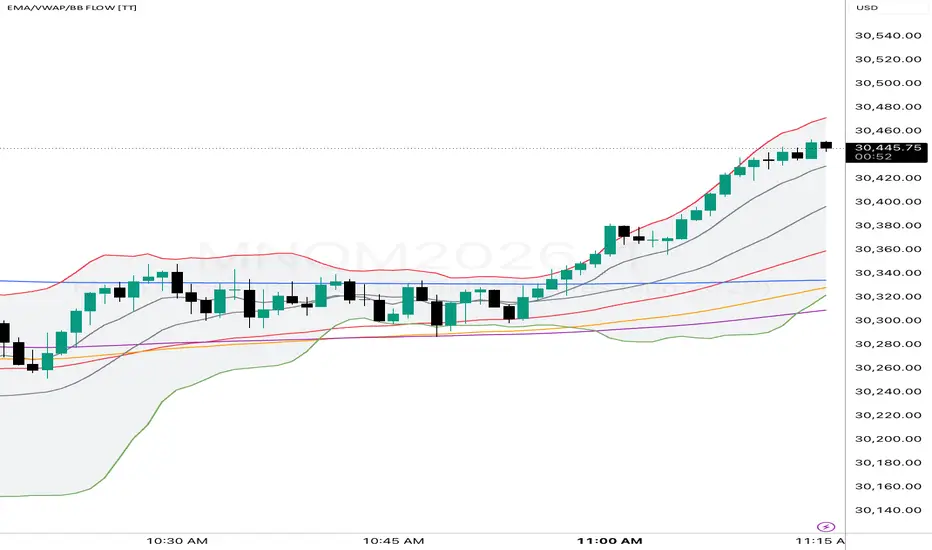
Moving Average Exponential, easy setupA simple moving average script with coloured background inbetween the moving averages.Chỉ báocủa LoFiCharts2
VWAP19 (5m)Подходит не для всех инструментов. вход по сигналу вивап, выход по сигналу МА19Chỉ báocủa Trading-Key5
Predictive SMA & BB■ Overview Most technical indicators are strictly lagging—they only tell you what has already happened. The "Predictive SMA & BB" flips this paradigm by projecting the Simple Moving Average (SMA) and Bollinger Bands (BB) into the future space of your chart. This tool allows you to visualize where dynamic support and resistance (the statistical walls) will be in the future, giving you a massive edge in planning limit orders and understanding the element of "time" in your trades. ■ The Core Logic: Forward Fill & Sliding Window How do we plot the future without a crystal ball? This script uses a quantitative approach known as "Forward Fill". It simulates the passing of time by assuming the current price remains perfectly flat (sideways). As it projects bars into the future, the algorithm drops the oldest historical data points from the calculation window (e.g., a 200-period window) and sequentially fills the new future slots with the current close price. This reveals a powerful mathematical truth: Even if the price doesn't move, moving averages and standard deviations will shift based on the decay of historical data. ■ Key Features & How to Use Future Baseline Projection: See exactly when a downward-sloping SMA will mathematically curl upwards as old, extreme price data is dropped from the calculation. Time-Based Squeeze Anticipation: As future bars are populated with flat prices, the projected Bollinger Bands will naturally squeeze, visualizing the expected statistical boundaries if volatility dies down. Custom UI: Fully customizable from the inputs panel. Toggle the future SMA, BB lines, and cloud fills, and adjust colors/opacity without touching the code. ■ ⚠️ Crucial Limitations & Disclaimers To use this tool effectively, you must understand its mathematical limitations: Not a Crystal Ball: This indicator projects a statistical baseline based on the assumption that current prices will maintain a zero-volatility trajectory. Vulnerability to Volatility Expansion: The projected ±2σ bands do NOT account for sudden, explosive price movements (e.g., macroeconomic news, central bank interventions). If high-impact news hits and volatility expands, the actual bands will violently widen, overriding the projected squeeze. Decreasing Confidence: The further you project into the future, the more the calculation relies on the "Forward Fill" assumption, naturally decreasing the statistical confidence of the extreme ends of the projection. Use these projected lines as strategic zones for "waiting in ambush" during normal market conditions, not as absolute guarantees. Combine this with multi-timeframe analysis and your own price action strategies.Chỉ báocủa shirokuro_dorara_07167
BBWP + MACD + EMA Trend Strategy// BBWP + Stoch RSI + EMA Trend LONG Strategy // Designed for 4H timeframe - highly adjustable // Entry - BBWP expansion (BBWP), Trend (slow/fast ema correlation), Momentum (Stoch RSI cross) // Exit - BBWP extremes, Momentum OR trailing SLChiến lượccủa jayentriken6
EMA Ride V2 StrategyPull back on Momentum for centry and continuation. Enter in stage 2 when pull back to ema 9, SL breach of EMA 21 for short term, or tighten to previous day low candle if going ultra short-term. Move SL to cost / 9 EMA post 5-8% run. Chiến lượccủa ashishpearce236
MEDIAS MOVILES ASLmedidas moviles de 21, 30, 150 y 200 a vision de 4 horas, 3 horas, 2 horas, 1 hora y 45 minutos, 30 minutos, 15 minutos, 5 minutos, 3 minutos, 2 minutos, 1 minutChỉ báocủa wilasgjd19732
FVG + EMA 9/21 + VWAP Scored SignalsCombined FVG, EMA 9/21 & VWAP Scored Signals A confluence-scored signal engine that combines Fair Value Gap (FVG) imbalance zones, EMA 9/21/50 trend structure, anchored VWAP, and candle quality into a single 0–100 directional score. One BUY or SELL per direction until the opposite side fires. What it does Most pullback and FVG indicators print signals on every touch, every cross, every fresh gap — and the noise drowns out the edge. This indicator scores every bar against a weighted, four-factor confluence model and only prints a signal when the directional score clears a per-symbol threshold during regular trading hours. A built-in state machine guarantees one BUY (or SELL) per leg until the opposite side triggers, so the chart stays clean and signals stay actionable. It is designed for intraday traders on 1–5 minute charts, particularly for 0DTE / weekly options entries on QQQ, SPX, SPY, IWM, and the Mag-8 names, but it works on any liquid symbol. The four scoring components The total score (0–100) is the weighted sum of: EMA / Trend (default 30 pts) — Fast EMA vs Slow EMA, Slow vs Trend, price vs Trend EMA, normalized EMA gap, and candle direction. Rewards aligned trend structure on the entry bar. FVG (default 30 pts) — Price must be touching one of the top-N highest-ranked FVG zones (sorted internally by size, volume, trend alignment, mitigation, and age). Score is scaled by the FVG's own directional strength %, so a 98%-strength zone contributes ~29 pts while a 50% zone contributes ~15 pts. VWAP (default 20 pts) — Side (price above/below) plus slope (rising/falling, measured over a configurable lookback). Anchored VWAP with Session/Week/Month/Quarter/Year options. Candle (default 20 pts) — Body-to-range ratio of the entry bar, rewarding decisive close-direction candles. All four weights are user-adjustable and a live score table in the top-right shows each component's bull and bear contribution every bar, plus the active signal state. How the state machine works Trigger: in-session AND directional score ≥ threshold. Per-symbol threshold: Mag-8 + index ETFs (AAPL, MSFT, GOOGL, AMZN, NVDA, META, TSLA, AVGO, QQQ, SPY, IWM) use a lower threshold (default 70). Everything else uses a higher threshold (default 90). Both are configurable. One signal per direction: Once a BUY prints, no further BUYs print until a SELL fires (and vice versa). No clutter, no repainting signals, no second-guessing. Tie-break: If both bull and bear clear threshold on the same bar, the higher score wins. Fair Value Gap engine The FVG component is built on the classic 3-bar imbalance definition (bull = low > high , bear = high < low ) and extends it with: Quality scoring (size, volume vs MA, trend EMA alignment, age decay, mitigation penalty) Continuous mitigation tracking (zones are removed when fully filled) Internal storage of up to 200 FVGs with the top N displayed Per-zone bull/bear strength bars (0–100%) and smart text labels ("Strong Bullish Imbalance," "Bearish Bias," etc.) The FVG ranking and rendering logic is adapted from Zeiierman's Ranked FVG Imbalance Zones (CC BY-NC-SA 4.0), with the scoring, state machine, and confluence integration built on top. Visuals EMA 9/21/50 with ATR buffer band around the fast EMA Optional EMA-cross triangles Anchored VWAP line FVG zone boxes with strength bars and text labels Optional candle coloring by EMA 9/21 alignment BUY/SELL labels with embedded score Live score table (component breakdown + total + threshold + state) Alerts Combined real-time alert — uses alert() so a single TradingView alert on "Any alert() function call" fires on every printed BUY or SELL, with the score and ticker embedded in the message. Separate alertcondition() entries for BUY, SELL, new bull FVG, new bear FVG, bull FVG touch, bear FVG touch. Recommended use Timeframe: 1m, 2m, 3m, or 5m for intraday; the EMA 9/21 framework is calibrated for these. Session: RTH-gated by default (09:30–16:00 America/New_York). Configurable. Workflow: Wait for a BUY/SELL label inside an FVG zone with score ≥ threshold and the score table showing alignment across at least three of four components. Use the FVG zone as structural invalidation. Tuning: If you're getting too few signals on a non-Mag-8 name, lower the "Other Threshold." If you want stricter signals on the Mag-8, raise the "Day-11 Threshold." Notes Signals are gated by inSession, so no pre-market or after-hours prints. Score is clamped 0–100 for display; VWAP can contribute negatively to the raw score, which is intentional (price on the wrong side of a sloping VWAP should hurt the directional case). All visuals (zones, bars, text, EMA fill, score table) can be toggled off independently. License & credits Released under Creative Commons Attribution-NonCommercial-ShareAlike 4.0 International (CC BY-NC-SA 4.0). FVG ranking, rendering, and storage architecture adapted from Zeiierman — Ranked FVG Imbalance Zones. EMA/VWAP/candle scoring, state machine, per-symbol thresholds, score table, and combined alert engine are original work. Disclaimer: This indicator is for educational and informational purposes only. It is not financial advice and does not guarantee profitable trades. 0DTE and weekly options carry significant risk of total loss. Always test on a paper account before risking capital, and size positions according to your own risk tolerance.Chỉ báocủa ppavank11
CEMAShows EMA 9,21,50,200, then Latest 3 Highs and Lows, EMA table from smaller to bigger time frame, Open low and Open high table to scanner as soon as possibleChỉ báocủa sudersonsarathy7
Combo Master V7: 9MA + Bollinger + Coral + InsideBarindicador com 9 médias persolanizáveis, bandas de bollinger, duas coral trend e inside barChỉ báocủa adryanopyres28
Daily 5-SMA (intraday)Daily 5-SMA Equivalent This indicator translates a daily Simple Moving Average into its mathematically equivalent period for any intraday (or higher) timeframe, so the line you see on a 5-minute chart represents the same lookback window as the daily SMA on a daily chart — no manual period recalculation needed. How it works The script measures how many bars of the current timeframe fit inside the total minute-span of the reference SMA. For example, a 5-day SMA covers 1,950 minutes on a stock market (5 × 390 min/day). On a 5-minute chart that becomes a 390-period SMA; on a 15-minute chart it becomes a 130-period SMA. The conversion is automatic whenever you change timeframes. An information table in the top-right corner always shows the active timeframe, the calculated equivalent period, the reference setting, and the selected market type — so you can verify the math at a glance. Inputs Source — Price field used for the calculation (default: close). Reference Days — The number of daily bars the SMA spans. Default is 5 (the classic daily 5-SMA). Accepts 1–50. Market Type — Determines how many minutes constitute a trading day: 24h — 1,440 min/day, for Forex and Crypto markets. Stock — 390 min/day (6.5-hour session), for equities and equity futures. Timeframe support The period conversion handles seconds, minutes, hours, days, weeks, and monthly timeframes. On daily or higher timeframes the indicator still plots correctly, though it is most useful on intraday charts. Alerts Four alert conditions are included: Price crosses above the SMA equivalent Price crosses below the SMA equivalent SMA is rising SMA is falling Usage notes Set Market Type to Stock for equities and NQ/ES/MES futures. Use 24h for Bitcoin, Ethereum, Forex pairs, or any continuously traded instrument. The displayed equivalent period will always be at least 1, regardless of how high a timeframe you are viewing.Chỉ báocủa merchantOfProfits114
PDB - 4 MA4 Moving Averages RED = 20 YELLOW = 50 PURPLE = 100 WHITE = 200 Built for dark mode; adjust color for light mode MA Value can be changed if you don't like my defaults :-( Chỉ báocủa PrintDemBandz2
EMA Ribbon Retest (Non-Repaint)EMA Ribbon Retest (Non-Repaint) + Stochastic RSI Exit System Overview This indicator combines an EMA Ribbon structure, a trend-based retest detection system, and a Stochastic RSI exit mechanism to provide clean, non-repainting buy/sell signals with structured trade management logic. It is designed for traders who focus on trend continuation entries after pullbacks (retests) and want a systematic exit strategy based on momentum exhaustion. Core Components 1. EMA Ribbon Trend Structure The indicator uses four exponential moving averages: EMA 20 EMA 50 EMA 100 EMA 200 These EMAs form a trend ribbon that defines market direction: Bullish Trend: EMA 20 > EMA 50 > EMA 100 > EMA 200 Bearish Trend: EMA 20 < EMA 50 < EMA 100 < EMA 200 This structure filters trades only in clear directional markets. 2. Ribbon Compression Filter Before a valid setup is considered, the indicator checks for EMA ribbon compression. Ribbon width is calculated as the percentage distance between the highest and lowest EMA relative to price. When this width is below the defined threshold, the market is considered compressed (consolidation phase). This helps identify accumulation zones before breakout continuation moves. 3. Retest Logic (Entry Signals) The system looks for price returning to the midpoint of the EMA ribbon after compression. Buy Setup: A BUY signal is triggered when: Market is in bullish trend Previous candle shows ribbon compression Price retests the mid-ribbon zone Price closes back above the midpoint Sell Setup: A SELL signal is triggered when: Market is in bearish trend Previous candle shows ribbon compression Price retests the mid-ribbon zone Price closes back below the midpoint This creates a trend continuation after pullback strategy. 4. Non-Repaint Signal Engine To ensure reliability: Signals are only confirmed on closed candles A cooldown period prevents repeated signals in a short time Prevents signal clustering during choppy market conditions 5. Stochastic RSI Exit System The indicator includes a momentum-based exit filter using Stochastic RSI (K & D lines). Long Position Exit: Triggered when Stochastic RSI is above the upper band (default 80) AND a bearish crossover occurs (K crosses below D) Short Position Exit: Triggered when Stochastic RSI is below the lower band (default 20) AND a bullish crossover occurs (K crosses above D) This ensures exits happen when momentum starts fading, not randomly. Position State Logic The script maintains internal position tracking: Activates long state after BUY signal Activates short state after SELL signal Resets position state on exit conditions This allows structured trade lifecycle logic inside an indicator. Visual Features EMA ribbon displayed with 4 colored EMAs Background highlight during compression phases BUY / SELL labels directly on chart EXIT markers for trade management Clean and minimal visual structure for clarity Alerts The script includes alert conditions for: BUY signals SELL signals BUY exits SELL exits These can be used for real-time notifications or automation workflows. Strategy Concept This indicator is based on a three-stage market model: Compression Phase → Market builds energy Retest Phase → Price revisits equilibrium zone Continuation Phase → Trend resumes Combined with momentum-based exits, it creates a full trend continuation system with structured risk control. Best Use Cases Trend trading Swing trading Breakout continuation strategies Multi-timeframe analysis (higher TF = stronger signals) Notes This is a non-repainting indicator Signals are confirmed only on closed candles Best performance in trending marketsChỉ báocủa filipitiCập nhật 37
Paid By AidsUses 3 cross stratetgy KST, RSI, MACD used maximum of 2m time frame Chỉ báocủa PaidAidsCập nhật 1113
PulseFlow Pro by Sam George - Volume Entries + TMO ExitsPulseFlow Pro PulseFlow Pro is a free, open script shared with the TradingView community for educational and discretionary trading use. It is designed to help traders quickly answer one practical question: Is this signal happening with trend, strength, momentum, and enough volume? Attribution: Core volume entry logic, EMA filtering, trade box, insight panel, risk/target tools, visual structure, and overall system design are by Sam George. The TMO-based exit engine is adapted from "TMO Trade Trigger System v1.1" / "TMO Trigger v1.1" by Kristoph Jeffers. Full credit is given to Kristoph Jeffers for the original TMO trade trigger concept used for exit guidance in this script. What this script does: • Detects directional volume spike entries using candle direction and volume standard deviation. • Filters entries using EMA 9, a selectable trend EMA defaulted to EMA 200, and optional ADX strength filtering. • Displays EMA trend zones between 9/21, 30/55, and 100/200. • Shows a live Entry / SL / TP trade box for the current active signal. • Provides selectable stop-loss modes: Signal Candle, Recent Swing, Recent Doji, or Risk Reward. • Shows TP1 and optional TP2 levels. • Uses TMO-based exit guidance, with an EMA fallback exit. • Tracks max favorable move and final exit percentage on the entry label. • Offers optional post-exit doji re-entry prompts. • Includes a compact panel for volume strength, RSI state, RSI vs RSI SMA, ADX, SL/TP levels, and multi-timeframe trend context. How to read the main signals: A green BUY label means a bullish volume spike has appeared while price is above EMA 9, above the selected trend EMA, and passing the ADX filter if enabled. A red SELL label means a bearish volume spike has appeared while price is below EMA 9, below the selected trend EMA, and passing the ADX filter if enabled. The first valid signal in a move is treated as the main signal. Optional smaller Re labels can be used for re-entry context. Best use: PulseFlow Pro works best when used with the trend. For stronger buy setups, look for: • Multi-timeframe trend mostly Up • Price above the selected trend EMA, default EMA 200 • ADX above the selected threshold • Volume reading above 1.8 SD or 2 SD • RSI above 50 • RSI above its SMA For stronger sell setups, look for: • Multi-timeframe trend mostly Down • Price below the selected trend EMA, default EMA 200 • ADX above the selected threshold • Volume reading above 1.8 SD or 2 SD • RSI below 50 • RSI below its SMA How to read the panel: State: Shows whether the script is currently tracking a BUY, SELL, or FLAT condition. Gain: Shows the current gain/loss percentage from the active entry. Volume: Shows whether current volume is normal or above 1 SD, 1.5 SD, 1.8 SD, or 2 SD. Higher readings suggest stronger participation. RSI: Shows the current RSI zone: • RSI > 50 supports bullish momentum. • RSI > 70 shows strong upside momentum, but can also mean price is extended. • RSI < 50 supports bearish momentum. • RSI < 30 shows strong downside momentum, but can also mean price is oversold. RSI SMA: Shows whether RSI is above or below its own smoothing average. • RSI > SMA supports improving bullish momentum. • RSI < SMA supports weakening or bearish momentum. ADX: Shows trend strength. Higher ADX generally means the market is trending more clearly. Lower ADX can mean chop or uncertainty. SL Mode: Shows which stop-loss method is active. Entry / SL / TP1 / TP2: Shows the active trade levels used in the visual trade box. TF Trend: Shows trend direction across the selected timeframes. This is useful for checking whether the signal agrees with broader market structure. Stop-loss modes: • Signal Candle: uses the signal candle high/low. • Recent Swing: uses the most recent swing high/low. • Recent Doji: uses the most recent doji high/low. • Risk Reward: calculates stop loss from TP1 and the selected RR value. Trade box: The live trade box helps visualize the current setup: • White line = Entry • Red line/zone = Stop Loss and risk area • Green line/zone = TP1 reward area • Optional blue dashed line = TP2 Exit logic: Exit logic is based on the TMO exit engine adapted from Kristoph Jeffers’ TMO Trade Trigger System. Buy exits are triggered after the upper TMO exit condition is armed and bearish confirmation occurs. Sell exits are triggered after the lower TMO exit condition is armed and bullish confirmation occurs. If no TMO exit appears first, the fallback EMA exit can provide an alternate exit prompt. Re-entry logic: After an exit, the script can suggest a cautious Re entry when a qualifying doji is broken in the direction of the prior trade and price remains on the correct side of EMA 21. Suggested workflow: 1. Check whether the multi-timeframe trend supports your trade direction. 2. Confirm price is on the correct side of the trend EMA. 3. Look for a BUY or SELL signal with strong volume. 4. Check RSI, RSI SMA, and ADX in the panel. 5. Use the trade box to understand Entry, SL, TP1, and optional TP2. 6. Use EXIT labels as trade-management prompts, not guaranteed outcomes. Free use: This script is shared freely for traders to use, study, and adapt in accordance with TradingView’s House Rules and any applicable open-source requirements. If you reuse or modify it publicly, please preserve attribution to Sam George and to Kristoph Jeffers for the TMO-derived exit logic. Important: This indicator is not financial advice. It is a discretionary analysis and trade-management tool. It does not guarantee profitable trades, accuracy, or future results. Always test settings on your own market, timeframe, and risk plan before using them live. Chỉ báocủa drsamgeorgeCập nhật 11633
ADX + EMA Cross Signaladx 20 alti 10 ema 20 emayi yukari keserse al adx 50 ustu 20 ema 10 emayi asagi keserse satChỉ báocủa mustafaseker75Cập nhật 6
FTT Plus BBMAThe FTT Plus BBMA indicator combines Bollinger Bands with a unique 3-candle momentum pattern to identify potential trend reversal signals. It is designed for traders who follow price action and volatility-based strategies. 🔹 How It Works: Bollinger Bands (20, 2) – Used to identify overbought and oversold conditions. The upper and lower bands act as dynamic support/resistance levels. FTT Candlestick Pattern – A 3-bar pattern that confirms momentum shifts before a potential breakout. 🔹 Bullish Signal (BUY): Triggered when the following conditions are met: Candle-2: Bullish (close > open) Candle-1: Bearish (close < open) Current Candle: Bullish (close > open) Price breaks above the previous high Price closes above the upper Bollinger Band 🔹 Bearish Signal (SELL): Triggered when: Candle-2: Bearish (close < open) Candle-1: Bullish (close > open) Current Candle: Bearish (close < open) Price breaks below the previous low Price closes below the lower Bollinger Band 🔹 Visual Features: Candles are highlighted in cyan for bullish signals and yellow for bearish signals. BUY (triangle up) and SELL (triangle down) labels appear directly on the chart. Built-in alert conditions for both signals (BUY / SELL). 🔹 Best Used On: Timeframes: 5min to 1 hour (scalping & intraday) Markets: Forex, Crypto, Stocks, Indices 🔹 Note: This indicator works best in trending or high-volatility conditions. Avoid using in choppy or sideways markets without additional filters.Chỉ báocủa padencodex11
Multi Time Frame Alignment ( 9 / 21 EMA cloud based )This indicator is a complete, multi-timeframe trend alignment tool built around the classic 9 and 21 Exponential Moving Averages (EMA). It is designed to keep your charts clean while providing instant, at-a-glance confirmation of market structure across macro and micro timeframes. Perfect for day traders and swing traders who require strict higher-timeframe confluence before executing a setup. Key Features: Multi-Timeframe Dashboard: A fully customizable on-screen table that tracks the 9/21 EMA trend across the Weekly, Daily, 4H, 1H, 15m, and 5m timeframes. Fractal Alignment Warnings: The dashboard automatically calculates two distinct alignment modules: Swing/Macro Alignment: Weekly / 4H / 15m Intraday Alignment: Daily / 1H / 5m "NO TRADE ZONE" Alerts: If your selected timeframes are not completely in sync (e.g., the 1H is bullish but the 5m is bearish), the alignment row will distinctly flag a "NO TRADE ZONE" to help prevent entering during choppy or corrective price action. Toggleable Chart Cloud: Visually plots the 9/21 EMA lines and fills the cloud between them directly on your current chart. This can be easily toggled off in the settings if you prefer naked price action. Integrated Session VWAP: Includes a built-in, toggleable VWAP line with customizable thickness for intraday liquidity and mean-reversion references. Highly Customizable UI: Every visual element can be adjusted. You can change the table position, text size, and independently adjust the colors and transparencies of the table clouds versus the chart clouds.Chỉ báocủa J_S0LCập nhật 10
ZP AlignedEdge multi-confluence tradingZP AlignedEdge is a multi-confluence trading suite built on one core principle: only trade when market structure, momentum, and higher timeframe trend align. HOW IT WORKS Market Structure Engine detects pivot highs and lows using configurable swing length. Supply zones form at confirmed swing highs, Demand zones at swing lows. Zone width scales dynamically with ATR(50). Overlapping zones are filtered automatically. Zones invalidate and convert to BOS markers when price closes beyond them. Fair Value Gap (FVG) detection identifies 3-bar imbalances in both directions. Each FVG displays its Consequent Encroachment (CE) level. Gaps auto-remove when price fully mitigates them. MSB + EMA Signal fires only when three conditions align simultaneously: a confirmed Market Structure Break (close crossing a validated swing high or low), an EMA crossover (EMA50/EMA100 or EMA100/LWMA240), and the Higher Timeframe trend filter (user-selectable M15 H1 H4). All signals fire on bar close only. Fully anti-repainting. Market Sessions display London, New York, Tokyo, Hong Kong, Sydney with DST-aware timing. PVSRA Liquidity Zones highlight institutional volume candles. Credits: PVSRA Liquidity Zone logic — TradersReality/Traders_Reality_Lib ZigZag library — TradingView/ZigZag/7 FVG and Supply Demand Zone structure inspired by DIY Custom Strategy BuilderChỉ báocủa Mytruong79001159
ZP AlignedEdge multi-confluence tradingZP AlignedEdge is a multi-confluence trading suite built on one core principle: only trade when market structure, momentum, and higher timeframe trend align. HOW IT WORKS Market Structure Engine detects pivot highs and lows using configurable swing length. Supply zones form at confirmed swing highs, Demand zones at swing lows. Zone width scales dynamically with ATR(50). Overlapping zones are filtered automatically. Zones invalidate and convert to BOS markers when price closes beyond them. Fair Value Gap (FVG) detection identifies 3-bar imbalances in both directions. Each FVG displays its Consequent Encroachment (CE) level. Gaps auto-remove when price fully mitigates them. MSB + EMA Signal fires only when three conditions align simultaneously: a confirmed Market Structure Break (close crossing a validated swing high or low), an EMA crossover (EMA50/EMA100 or EMA100/LWMA240), and the Higher Timeframe trend filter (user-selectable M15 H1 H4). All signals fire on bar close only. Fully anti-repainting. Market Sessions display London, New York, Tokyo, Hong Kong, Sydney with DST-aware timing. PVSRA Liquidity Zones highlight institutional volume candles. Credits: PVSRA Liquidity Zone logic — TradersReality/Traders_Reality_Lib ZigZag library — TradingView/ZigZag/7 FVG and Supply Demand Zone structure inspired by DIY Custom Strategy BuilderChỉ báocủa Mytruong790013
Edo HMA CoreEdo HMA Core — Clean Trend Reading Built on the Hull Moving Average with Slope, State, Fast Acceleration, Inflexion Markers and Information Panel The Hull Moving Average was introduced by Alan Hull in 2005 to solve the permanent dilemma of classical moving averages: the smoother the average, the more lag; the faster the average, the more noise. By combining three weighted moving averages with mathematically derived lengths, the HMA produces a curve that is visually smooth but reacts to price flips with significantly less lag than an equivalent EMA or SMA. Edo HMA Core takes that original idea and turns it into a complete trend indicator. On its own, an HMA is just a line. With Edo HMA Core, that line gains state colour, a percentage slope reading, an automatic inflexion detector, a translucent state fill between price and average, and a second faster HMA that adds an acceleration reading. Five coordinated layers on a single overlay, designed to keep the visual purity of a moving average while delivering far richer information about the regime of the asset. THREE HMA VARIANTS A single dropdown selects between three Hull constructions: — Standard — Alan Hull's original three-WMA formula. Balanced, default option. Recommended for 4H, daily and weekly charts. — Exponential (EHMA) — Variant built with EMA instead of WMA. Slightly smoother and slower to react. Useful on highly volatile assets or low timeframes. — Triple (THMA) — Variant using three WMAs with 1/3, 1/2 and full lengths weighted for sharper turns. Most reactive variant, useful for early inflexion detection at the cost of a small noise increase. The three variants share plots, markers and panel — only the calculation engine of the line changes. SLOPE AND STATE CLASSIFICATION Slope is calculated as the difference between the current HMA value and its value a few bars back: slope = HMA − HMA The Slope Lookback parameter (default 2) controls how reactive the reading is. Low lookbacks catch turns earlier; high lookbacks filter noise. Based on the sign of the slope, the indicator assigns one of three states: — Trend Up — Slope > 0. Main HMA, fast HMA and fill turn green. — Trend Down — Slope < 0. Main HMA, fast HMA and fill turn red. — Flat — Slope = 0. Lines turn neutral teal. The colour system is consistent across every visual element, so the regime is readable at a glance without needing to look at the panel. FAST HMA AND ACCELERATION CROSSES A second HMA is calculated with a shorter length (21 by default), sharing type and source with the main. The relationship between fast and main is read as an acceleration measure: — Fast above main → recent momentum accelerating relative to the underlying trend — Fast below main → recent momentum decelerating or reversing Each cross is automatically marked with an X-cross: green below the candle for a Fast Cross Up, red above the candle for a Fast Cross Down. These are acceleration signals, not trend-change signals — for that, the indicator provides explicit inflexion triangles. INFLEXION MARKERS The most structural signals of the indicator. Every time the main slope changes sign, the indicator draws a triangle: — Flip Up (▲) — Green triangle below the candle when slope crosses from negative to positive. Start of a new bullish regime. — Flip Down (▼) — Red triangle above the candle when slope crosses from positive to negative. Start of a new bearish regime. Every flip is accompanied by a simultaneous update of the HMA colour, fast HMA colour and state fill. PRICE / HMA CROSSES AND STATE FILL Direct crosses of price with the main HMA do not produce visual markers (to keep the chart clean) but are available as alert conditions: — Price Crossed Above HMA — close reclaims the main HMA. Bullish reclaim. — Price Crossed Below HMA — close loses the main HMA. Loss of dynamic support. Between price and HMA the indicator draws a translucent fill whose colour matches the active state. Fill Opacity is configurable from 50 (very opaque) to 99 (almost invisible), default 85. The fill provides an immediate state reading and makes the magnitude of the price/HMA separation visible at all times. INFORMATION PANEL A five-field panel summarises the current regime in real time: — State — Trend Up / Trend Down / Flat — Slope — current slope as a percentage of the HMA value (e.g. +4.402%, −0.739%) — Price vs HMA — distance of price from the HMA as a percentage (e.g. +50.25%, −13.00%) — Fast — relative position of the fast HMA versus main (Fast > Slow, Fast < Slow, Off) — Type — current variant and length (e.g. Standard - 55) Numeric fields are coloured according to the active state. The panel can be placed in any of the four chart corners and resized to Small or Medium. Dark and Light themes adapt the panel to the chart background. CONFIGURATION — Hull MA: HMA Length (default 55), HMA Type (Standard / Exponential / Triple), Source (default close), HMA Line Width (1-5) — Fast Cross: Show Fast HMA Cross, Fast HMA Length (default 21), Fast HMA Width (1-4) — State: Show Inflexion Markers, Slope Lookback in bars (1-10), Fill Between Price and HMA, Fill Opacity (50-99) — Style: Bull Color, Bear Color, Neutral Color, Theme (Dark / Light) — Panel: Show Panel, Panel Position (four corners), Panel Size (Small / Medium) ALERTS Six predefined alert conditions cover every meaningful event: — HMA Flip Up — slope crosses from negative to positive — HMA Flip Down — slope crosses from positive to negative — Fast Cross Up — fast HMA crosses above main — Fast Cross Down — fast HMA crosses below main — Price Crossed Above HMA — close reclaims the main HMA — Price Crossed Below HMA — close loses the main HMA All alerts evaluate on bar close in the active timeframe. The two inflexion alerts work well for medium and long-term position management; the two fast crosses are common in active management; the two price/HMA alerts confirm breaks of the average in mature trends. HOW TO READ IT A clean reading combines the five layers into common patterns. Clean bullish reactivation — After prolonged Trend Down, a Flip Up appears, price reclaims the HMA, the fast crosses above the main and the fill switches from red to green. The cleanest sequence for confirming a new bullish regime. Bullish exhaustion — In a sustained Trend Up, slope shrinks while price keeps advancing. A Fast Cross Down appears before any slope change. Usually precedes a Flip Down. Bearish capitulation — In an advanced Trend Down, a Fast Cross Up appears inside the red fill. If price then reclaims the HMA and slope turns, a Flip Up arrives. Sideways noise — In flat zones, slope crosses zero repeatedly and alternating flips appear within a few bars. Raise Slope Lookback to 5+ bars to filter non-structural flips. OPEN SOURCE Edo HMA Core is published as a free open source indicator. The full Pine Script is publicly accessible on TradingView for study, adaptation and integration into any workflow. Part of the Edolab Markets free tools ecosystem alongside Edo SuperTrend Core, Edo EMA Core Cross, Edo Sentiment Map, Edo TRIX Core Cross, Edo RSI Dual, Edo Multi Stoch, Edo A/D Flow Core, Edo Liquidity Zones, Edo ZigZag Auto Fib SR and Edo Bands Fusion. This indicator is a technical analysis tool for educational and informational purposes only. It does not generate automatic buy or sell signals and should not be considered financial advice. Trading financial markets involves significant risk of capital loss. Past performance does not guarantee future results. Always use proper risk management.Chỉ báocủa EdoLab-Markets8
Auto Range / Lateral Consolidation Box DetectorAuto Range / Lateral Consolidation Box Detector Overview The Auto Range / Lateral Consolidation Box Detector is designed to automatically identify and draw price ranges where a stock is moving sideways after a prior advance. Instead of manually drawing rectangle boxes around consolidation areas, this indicator detects them objectively using price containment, range width, prior trend movement, ADR, moving-average structure, and optional volume/RSI filters. The purpose is to help traders identify: lateral consolidations tight launch shelves continuation bases range breakouts failed ranges breakout/retest zones early momentum continuation structures This tool is especially useful for traders who look for stocks that have already shown strength, pause in a controlled range, and then attempt to continue higher. Core Concept Many strong momentum moves do not happen randomly. They often follow a repeatable structure: Prior advance → sideways range → breakout → continuation This indicator attempts to locate that sideways range automatically. The blue dashed boxes show detected consolidation zones. When price breaks above a completed range, the indicator can mark the breakout and preserve the prior box so the trader can review the structure historically. The goal is not to predict breakouts blindly. The goal is to make range structure easier to detect, measure, and trade with defined risk. What the Indicator Detects The indicator identifies two main types of structures: 1. Standard Rectangle Range This is a broader lateral consolidation that usually forms over a larger number of candles. It is useful for detecting: multi-week consolidations continuation bases sideways digestion after an advance breakout/retest setups controlled pullbacks above moving averages A standard rectangle is best used when price has already advanced and then begins moving sideways in a defined box. 2. Tight Launch Shelf This is a shorter, tighter range that often forms just before a momentum expansion. It is useful for detecting: short pauses near highs high-tight continuation shelves pre-breakout compression momentum names that do not build long bases stocks that pause briefly before expanding again This feature was added because some of the strongest stocks do not consolidate for weeks. They may only pause for several sessions before breaking out. How the Boxes Work The indicator measures the range using completed prior candles only. This is important because the breakout candle itself should not distort the range. For example, if a stock breaks out above a tight rectangle, the breakout candle may be much larger than the range. If the script included that candle in the box calculation, it would make the range look wider than it actually was. This script avoids that issue by asking: “Before the current breakout candle, was there a valid sideways range?” That allows the indicator to draw the actual consolidation area more accurately. Visual Guide Visual ElementMeaningBlue dashed boxDetected standard rectangle rangePurple dashed boxDetected tight launch shelfUpper box lineRange resistance / breakout levelLower box lineRange support / invalidation referenceMidlineInternal range midpointBO markerBreakout above range with volumeBO? markerPrice breakout without volume confirmationFAIL markerBreakdown below rangeScore labelShows range quality, width, ADR, prior move, and containment How I Use It in My Strategy This indicator fits into a continuation-style trading strategy built around strength, structure, and timing. The process is: 1. Find a stock with prior strength I want to see that the stock has already proven demand. That may include: strong prior advance relative strength versus the market rising moving averages reclaim or hold above the 200 SMA improving volume profile strong sector or theme participation recent earnings, catalyst, or institutional attention The indicator is not used to find random sideways stocks. It is used to find sideways ranges after strength has already appeared. 2. Let the stock build a range Once a stock has moved, I want to see whether it can hold gains. A clean range tells me: buyers are defending higher prices sellers are not fully taking control price is digesting instead of collapsing moving averages may be catching up risk can be defined around the box This is where the auto box becomes useful. Instead of manually drawing every range, the indicator highlights areas where price is compressing or consolidating. 3. Use the box for trade planning The box gives me three major trade locations: Trade LocationUse CaseRange lowSupport-defense entryRange highBreakout triggerBreakout retestPreferred continuation entry I generally do not want to enter randomly in the middle of the box unless I have another strong reason. The best trades usually come from: range-low defense, breakout through range high, or breakout followed by a retest that holds. 4. Confirm with other tools This indicator identifies structure, but it is not a standalone buy signal. Before taking a trade, I still want confirmation from: relative strength catalyst/news/earnings context sector/theme strength ADR/movement potential volume expansion VWAP/AVWAP location volume profile levels option-chain liquidity if using options broader market regime The box tells me where the trade may be forming. The rest of the process tells me whether it deserves capital. How Other Traders Can Use It This indicator can be adapted to several trading styles. Momentum Traders Momentum traders can use it to identify stocks that are pausing after a strong move and preparing for another push. Best use: breakout above range high breakout with volume tight launch shelf breakouts high-relative-volume names strong sector/theme participation Swing Traders Swing traders can use it to locate multi-day or multi-week continuation bases. Best use: buy breakout/retest enter near range support with defined risk use the box low as invalidation use the box height for measured-move targets combine with daily/weekly trend structure Breakout Traders Breakout traders can use the box high as an objective breakout level. Best use: price closes above the range high volume expands above average range is not too wide stock is above key moving averages market regime supports continuation Mean-Reversion Traders Mean-reversion traders can use the range boundaries in the opposite way. Best use: fade weak breakouts back into the range buy range low if buyers defend sell/avoid failed range highs use the midpoint as a decision level Position Traders Position traders can use detected boxes as add zones during a larger trend. Best use: add after a valid base forms above rising moving averages trail risk below higher base lows identify where trend continuation is being accepted avoid adding after emotional vertical moves without digestion Input Settings Explained Standard Rectangle Bars Controls how many prior candles are used to detect a normal consolidation box. Higher values detect longer bases. Lower values detect shorter ranges. Suggested use: StyleSettingFast momentum8–12Swing trading12–20Longer bases20–40 Tight Launch Shelf Bars Controls how many prior candles are used to detect short, tight shelves near highs. This is designed for stocks that pause briefly before breaking out. Suggested use: StyleSettingVery fast momentum4–6Normal launch shelf6–10Slower swing shelf10–15 Prior Move Lookback Bars Determines how far back the script looks to measure whether the stock had a prior advance before the range. Higher values allow the script to detect bases after larger, older moves. Suggested use: StyleSettingShort-term momentum20–35Swing continuation35–60Longer trend bases60–100 Minimum Prior Advance % Defines how much price must have advanced before the range qualifies. This helps prevent the script from highlighting random sideways chop. Suggested use: Market TypeSettingLarge caps8%–15%Mid caps15%–25%Small caps / high ADR20%–40% A higher setting makes the script more selective. Minimum Close Containment % Controls how many closes must remain inside the box. A higher value requires cleaner sideways behavior. Suggested use: Range QualitySettingLoose ranges60%–70%Normal ranges70%–80%Very tight clean bases80%–90% Max Standard Range Width x ADR Controls how wide a normal range can be compared with the stock’s average daily range. Lower values require tighter bases. Higher values allow wider, looser consolidations. Suggested use: PreferenceSettingTight clean bases only1.5–2.25Balanced2.5–3.0Loose momentum names3.0–4.0 Max Tight Shelf Width x ADR Controls how wide a tight launch shelf can be. Because launch shelves should be tighter than standard ranges, this number is usually lower. Suggested use: PreferenceSettingVery tight shelves1.0–1.3Balanced1.4–1.8Volatile small caps1.8–2.5 ADR Length Controls the lookback period for average daily range. Default is 20, which approximates one trading month. Suggested use: PurposeSettingShort-term sensitivity10Standard20Smoother ADR30–50 Volume Average Length Controls the average volume lookback used for breakout and volume comparison. Suggested use: StyleSettingFast momentum10Standard swing20Smoother volume filter30–50 Max Range Volume vs Avg This controls how much volume is allowed during the range if the volume filter is enabled. Lower values require quieter consolidation. Higher values allow more active ranges. Suggested use: Range TypeSettingQuiet base0.8–1.0Normal base1.0–1.25Active momentum range1.25–1.75 RSI Settings RSI filters can be used to avoid ranges that are either too weak or too extended. Suggested use: PurposeSettingAvoid weak rangesMinimum RSI 40Allow momentum leadersMaximum RSI 80–85Stricter resetMax RSI 70–75 For strong momentum stocks, I prefer leaving RSI control flexible because strong names can remain elevated before breaking out. Require Price Above 200 SMA When enabled, the script only accepts ranges where price is above the 200 SMA. This is useful for trend-following and continuation strategies. Turn this off if you want to scan: bottoming structures early reversals 200 SMA reclaim attempts accumulation ranges below the 200 SMA Require Prior Advance When enabled, the script requires price to have moved up before forming the range. This is best for continuation traders. Turn this off if you want to study: accumulation bases bottoming ranges reversal setups sideways structures before a first move Require Volume Control When enabled, the range must have controlled volume relative to average volume. This helps filter out chaotic ranges. However, for volatile small caps or active momentum names, I often leave this off because strong stocks can consolidate with active volume. Require RSI Control When enabled, RSI must remain within the selected range. This can help avoid weak or overextended setups. However, momentum leaders can remain strong for longer than expected, so this setting is optional depending on the strategy. Setup Score The label displays an Auto Range Score out of 10. The score considers: prior move price above 200 SMA containment inside the range range width versus ADR volume behavior OBV behavior RSI condition ADR level The score is not a buy signal. It is a structure-quality score. General interpretation: ScoreInterpretation9–10Very clean structure7–8Good watchlist candidate5–6Needs more confirmationBelow 5Low-quality or incomplete structure Trading Notes A detected box is only a location tool. It does not replace: market regime analysis risk management catalyst research relative strength checks liquidity checks options-chain review trade planning The highest-quality setups usually combine: strong prior move + clean box + range containment + volume expansion on breakout + supportive market conditions. Risk Management The box can help define risk. Common invalidation methods: stop below range low stop below breakout candle low stop below retest low stop below rising 20 EMA or 50 SMA exit if breakout fails back into range avoid if price breaks below the box with volume The cleanest setups are usually those where the box gives a tight, logical invalidation level. Important Disclaimer This indicator is for educational and research purposes only. It does not provide financial advice, investment advice, or guaranteed trade signals. All trading involves risk. Traders should use their own research, risk management, and judgment before entering any position.Chỉ báocủa rick84etter55
9/21 EMA Structure Clouds9/21 EMA Structure Clouds - EMA of high / EMA of close / EMA of low setup Chỉ báocủa jackbiernesserCập nhật 5
21 EMA Structure CloudEMA of high / EMA of close / EMA of low setup — three 21-period EMAsChỉ báocủa jackbiernesser0