EMA Cross Signal FILTER- Close cross EMA6, EMA10 - >Buy/Sell Signal - Filter: EMA10 follow EMA30. Work for GOLD 30M, SILVER 30MChỉ báocủa thangvq_okysaigon5
MATC + Ichimoku Projection 📌 MATC ICHIMOKU PROJECTION — SYSTEM DESCRIPTION (ENGLISH) MATC Ichimoku Projection is a hybrid market structure and momentum system that combines a custom mathematical trend engine (MATC) with a projected Ichimoku Cloud model to detect high-probability breakout zones. The system does not rely on a single indicator. Instead, it builds a multi-layer confirmation model using trend structure, volatility expansion, and projected equilibrium zones. 🔷 1. MATC STRUCTURE (Market Adaptive Trend Calculation) MATC is a dynamic band-based trend engine built on: Percentage-based upper/lower deviation from price Smoothed mirror expansion of volatility EMA-based stabilization of structural levels This creates: Dynamic resistance Dynamic support Midline equilibrium MATC interprets market compression and expansion cycles mathematically, rather than using static indicators. 🔷 2. ICHIMOKU PROJECTION CLOUD Instead of traditional Ichimoku interpretation, this system uses a projected cloud state: Span A = (Tenkan + Kijun) / 2 Span B = highest/lowest range equilibrium The cloud is used not as lagging support/resistance, but as a: 🔹 Future regime filter (bull or bear probability zone) 🔷 3. STRONG BUY LOGIC (PROBABILITY EVENT) A Strong Buy signal is generated only when two independent systems align: ✔ MATC Breakout Condition Price must break above MATC resistance: This confirms structural expansion ✔ Ichimoku Bull Regime Span A > Span B (green cloud state) Indicates bullish future market structure ✔ Combined Confirmation A Strong Buy occurs only when: MATC breakout AND Ichimoku green regime align This creates a dual-projection confirmation system, reducing false signals significantly. 🔷 4. SINGLE EVENT PER CLOUD CYCLE To avoid overtrading and duplicate signals: Each Ichimoku green cloud phase generates only one Strong Buy Signal reset occurs only when a new cloud regime begins This ensures: One institutional-style confirmation per market expansion phase 🔷 5. SYSTEM CHARACTERISTICS This model is: ✔ Non-repainting in logic structure ✔ Regime-based (trend + future projection) ✔ Volatility adaptive ✔ Designed for breakout confirmation rather than prediction ✔ Built to reduce fake breakouts via dual confirmation ⚠️ LIMITATIONS / DISCLAIMER Like all technical systems, MATC Ichimoku Projection: Does not guarantee accuracy Can generate false signals in low-volume or choppy markets Works best in trending or expanding volatility environments Should be used with risk management filters 📌 CONCLUSION MATC Ichimoku Projection is a dual-layer market intelligence system combining: Structural trend mathematics (MATC) Future probability cloud modeling (Ichimoku Projection) The goal is not to predict the market, but to identify: “Where probability of expansion becomes statistically dominant” 📌 MATC ICHIMOKU PROJEKSİYON — SİSTEM AÇIKLAMASI (TÜRKÇE) MATC Ichimoku Projection, özel bir matematiksel trend yapısı (MATC) ile projeksiyon Ichimoku Bulutu’nun birleştirildiği hibrit bir piyasa analiz sistemidir. Sistem tek bir indikatöre dayanmaz. Bunun yerine çok katmanlı doğrulama modeli kullanır: Trend yapısı Volatilite genişlemesi Gelecek rejim tahmini 🔷 1. MATC YAPISI (Piyasa Adaptif Trend Hesaplama) MATC sistemi şu matematiksel yapıya dayanır: Fiyatın yüzde bazlı üst/alt bandı Volatiliteye göre genişleyen mirror yapı EMA ile yumuşatılmış trend seviyeleri Sonuç olarak: Dinamik destek Dinamik direnç Orta denge (midline) MATC, piyasayı sabit çizgilerle değil: genişleme ve sıkışma döngüleriyle matematiksel olarak okur 🔷 2. ICHIMOKU PROJEKSİYON BULUTU Klasik Ichimoku yerine burada: Span A = Tenkan + Kijun ortalaması Span B = yüksek/düşük denge bölgesi Bulut artık gecikmeli değil: 🔹 “gelecek piyasa rejimi filtresi” olarak kullanılır 🔷 3. STRONG BUY MANTIĞI (PROBABILİTY EVENT) Strong Buy sinyali sadece iki sistem aynı anda doğrulama verdiğinde oluşur: ✔ MATC kırılımı Fiyat MATC direncini yukarı kırar ✔ Ichimoku yeşil rejim Span A > Span B ✔ birleşik doğrulama İki sistem aynı anda bullish rejim üretir Bu yapı: çift projeksiyonlu doğrulama sistemi oluşturur 🔷 4. HER BULUTTA TEK SİNYAL Aynı bölgede tekrar sinyal üretmemek için: Her yeşil bulutta sadece 1 STRONG BUY Yeni bulut başladığında reset Bu sayede: “kurumsal tek onay sistemi” davranışı oluşur 🔷 5. SİSTEM ÖZELLİKLERİ ✔ Repaint mantığına karşı filtrelenmiş yapı ✔ Trend + gelecek rejim sistemi ✔ Volatilite adaptif ✔ Breakout odaklı ✔ Fake sinyalleri azaltmak için çift doğrulama ⚠️ SINIRLAR Her sistem gibi %100 doğruluk garanti etmez Yatay piyasalarda false signal üretebilir Trend ve hacimle birlikte kullanılması önerilirChỉ báocủa onderarslantas10787
Pranjal Abhigyan Indicator Proranjal Abhigyan Indicator Pro The Pranjal Abhigyan Indicator Pro is an advanced multi-timeframe trend-following system built to identify market direction, filter out noise, and manage trades with dynamic risk control. It is designed around a Parabolic Weighted Moving Average (PWMA) which gives higher importance to recent price action while still maintaining smooth trend structure. The indicator works across higher timeframes using a built-in MTF engine to ensure better trend alignment. 🔷 Core Features 📈 Trend Detection (PWMA System) The indicator uses a Parabolic Weighted Moving Average (PWMA) to determine the dominant market direction. Price above PWMA = bullish trend Price below PWMA = bearish trend This helps traders stay aligned with the main market structure. 🌊 Volatility Filter (Noise Reduction) A built-in volatility filter ignores small and unstable movements in price. It filters out 3–4 candle fake reversals, ensuring that only meaningful trend shifts generate signals. This helps avoid: Sideways market traps False breakouts Choppy price action signals 🛑 ATR-Based Trailing Stop Loss The indicator includes a dynamic trailing stop-loss system based on ATR (Average True Range). SL automatically adjusts based on market volatility Moves only when price shows significant progress Helps lock profits while avoiding premature exits The SL is also direction-aware: Green = Long protection (bullish trend) Red = Short protection (bearish trend) 🎯 Minimum SL Movement Filter To avoid constant SL updates in small fluctuations, a minimum ATR-based movement filter is applied. This ensures: No micro-adjustments No SL noise Clean and stable trailing behavior 🔄 Trend Confirmation Logic The system includes internal structure validation inspired by market behavior (CHOCH & BOS logic) to strengthen trend confirmation. This helps ensure that: Trend changes are meaningful Fake reversals are minimized Continuation trends are respected 💰 Trade Management Levels The indicator provides automatic trade management zones: Break-even Level – helps secure risk-free trades TP1 (First Target) – early profit booking zone TP2 (Extended Target) – trend continuation target These levels are based on ATR for dynamic adaptability across all markets. 🎨 Visual Structure Color-coded PWMA for trend direction Clean BUY/SELL signals Minimal chart clutter Optional visual offset for better alignment 📌 How to Use Follow PWMA direction for trend bias Enter trades on confirmed BUY/SELL signals Use trailing SL for risk management Book partial profits at TP1 and TP2 Hold trades while trend remains intact ⚡ Summary The Pranjal Abhigyan Indicator Pro is a complete trading system combining: Trend identification Volatility filtering Dynamic risk management Structured trade execution It is designed for traders who prefer clean charts, disciplined entries, and systematic trade management rather than emotional decision-making. If you want, I can also write: 🔥 Short TradingView title (SEO optimized) 🔥 Tags/keywords list 🔥 Strategy backtest version (with win rate stats format)Chỉ báocủa pranjalabhigyan30
Daily Trading DashboardDaily Trading Dashboard (Multi-Timeframe Market Regime Matrix) Overview. The Daily Trading Dashboard (DTD) is a compact, high-performance tactical HUD built entirely in Pine Script v6. It condenses multiple complex layers — dollar liquidity profiling, volatility regime analysis, statistical trend maturity (Z-Score), intraday conviction velocity, and higher-timeframe momentum — into a single clean table overlay.Instead of stacking several indicator panes that consume resources and clutter your screen, DTD executes everything in one optimized stream, giving you institutional-grade market regime awareness at a glance. Core Components & Logic. Real-Time Dollar Liquidity Engine (D-Liq): Dynamically measures daily liquidity depth: Dollar Liquidity = SMA(Volume, Lookback) × Close / 1,000,000,000 The cell turns green when liquidity exceeds your custom billion-dollar threshold, helping you avoid thin, dangerous instruments. Customizable Normal Distribution Regime (Z-Score) Calculates statistical position relative to a user-selectable moving average (SMA/EMA): Z-Score = (Close − MA) / StDev Instantly labels the trend maturity with clear risk zones: OVERSOLD (≤ -3) → HOSTILE → WEAK → NEUTRAL → STRONG → OVERBOUGHT (≥ 3) Quantified Average Daily Range Delta Velocity (D-qADR% & ΔqADR%): The proprietary heart of the script. qADR% = SMA((High/Low − 1) × 100, Lookback) — historical expected daily range percentage. ΔqADR% measures how much of that expected range has already been covered in the current session. When ΔqADR% reaches or exceeds +100% / -100%, it signals powerful institutional conviction and potential exhaustion. Macro Timeframe Synergy: Pulls Weekly ROC(50) and Weekly RSI(14) via request.security so you can instantly see higher-timeframe alignment without changing charts. Parabolic Exhaustion Banner: When both Daily RSI and Weekly RSI exceed your chosen threshold (default 80), the dashboard expands with a bold, high-visibility “PARABOLIC” warning banner — your cue to tighten trailing stops or prepare for mean reversion. Visual & Operational Features. Matrix Background States: Entire rows shift between soft green (price above chosen MA) and soft red (price below MA). Daily Conviction Circles: Tiny circles plotted above/below bars on the daily timeframe show exact ΔqADR% conviction levels (deep green = strong bullish, deep red = strong bearish). Optional Bar Coloring: Toggle “Color Bars by Daily ΔqADR Conviction” to paint solid green/red candles once the 100% historical range threshold is reached. Clean Pine v6 Architecture: Uses strict typing, tuple functions, single security call, and conditional table.clear() to ensure maximum performance and zero visual jitter. Alert Conditions (Built-in): D-ΔqADR% ≥ +100% → “Very Strong Bull conviction on Daily” D-ΔqADR% ≤ -100% → “Very Strong Bear conviction on Daily” BECAME Parabolic → Both Daily & Weekly RSI cross above your threshold NO LONGER Parabolic → Exit from parabolic stateChỉ báocủa weeklystockchartsCập nhật 3
Adaptive 2 EMA Cloud (Trend-Aware)Liquidity Zone Indicator V2 is a chart overlay designed to highlight potential high-activity price areas using volume spikes and recent price extremes. The script detects possible liquidity zones and visualizes them directly on the chart using dynamic boxes or marker signals. Features Configurable liquidity lookback period Volume-threshold based liquidity detection Optional liquidity zone visualization Extendable zones until invalidation Dual-color or monochrome display modes Bullish and bearish liquidity zone highlighting Lightweight overlay design Built-in alert condition support Detection Logic The indicator identifies potential liquidity areas when: Volume exceeds the selected moving average threshold Price reaches recent highs or lows within the configured lookback range Zones are automatically managed and removed after invalidation conditions are met. Visual Options Liquidity zones as boxes or marker signals Adjustable colors for bullish and bearish zones Monochrome mode support Zone transparency customization Alerts Includes alert conditions for detected liquidity events: “Liquidity Zone Alert” Inputs Liquidity lookback Volume threshold multiplier Zone extension toggle Zone display mode Dual-color mode Bullish/Bearish colors Monochrome color selection Notes This indicator is intended for chart visualization and market structure analysis. Volume-based signals may behave differently across markets and timeframes. Use additional confirmation methods when analyzing price action. Open-source script This script is open-source and available for educational and analytical purposes in accordance with platform rules and guidelines.Chỉ báocủa charleyRT5
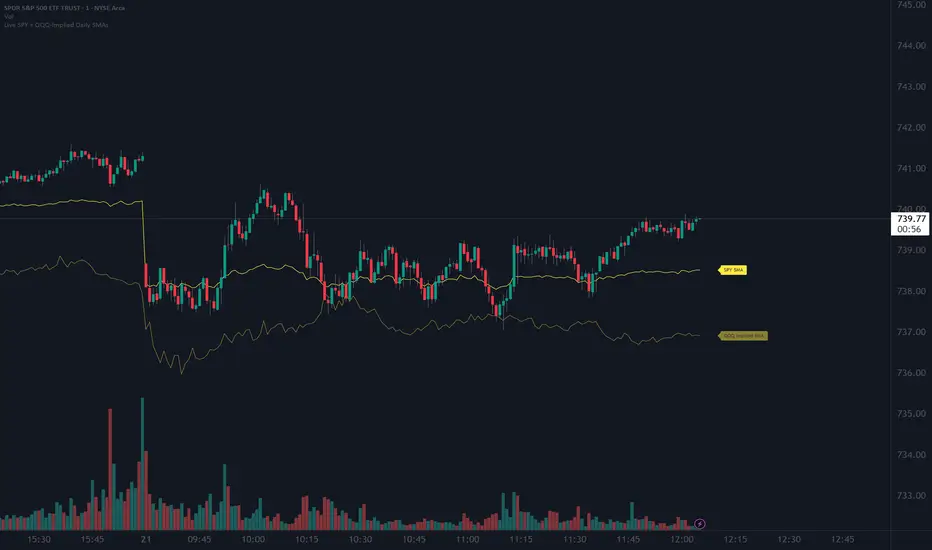
Live Intraday Daily SMAsShows real-time 5, 20, and 200 period daily SMA's on intraday chartsChỉ báocủa shanerprice2
Two Candle Comparison TMP V 5.0.1.1Candle comparison in 4H and combined moving averages and some other indicatorsChỉ báocủa prasaaforexCập nhật 2
pranjalabhigyan# pranjalabhigyan — Parabolic Weighted Moving Average (PWMA) pranjalabhigyan is a custom Parabolic Weighted Moving Average (PWMA) indicator designed to provide smoother trend detection while reacting faster to price action compared to traditional moving averages. Unlike SMA or EMA, this indicator applies a parabolic weighting system, giving progressively higher importance to recent candles. This helps traders identify momentum shifts and trend direction with improved responsiveness. ## Features • Custom Parabolic Weighted Moving Average • Manual timeframe selection (Multi-Timeframe Support) • Dynamic trend color changes • BUY and SELL signal labels • Alert conditions for crossovers • Clean and lightweight chart overlay ## How It Works The indicator calculates a weighted moving average using squared (parabolic) weights. Recent price candles receive significantly more influence than older candles, allowing the PWMA to adapt quickly during trending markets while remaining smoother than many fast-moving averages. ## Signals • BUY Signal → Price crosses above PWMA • SELL Signal → Price crosses below PWMA ## Timeframe Flexibility Users can manually select a custom timeframe independent of the chart timeframe. Examples: • 5 → 5 Minutes • 15 → 15 Minutes • 60 → 1 Hour • 240 → 4 Hours • D → Daily ## Best Use Cases • Trend following • Momentum confirmation • Dynamic support and resistance • Multi-timeframe analysis • Scalping, intraday, and swing trading ## Disclaimer This indicator is intended for educational and analytical purposes only and should not be considered financial advice. Always use proper risk management before trading. Chỉ báocủa pranjalabhigyan4
MTF Market Structure BiasMulti-TimeFrame Market Structure Bias A customizable multi-timeframe trend and market structure indicator designed to help traders align higher timeframe directional bias with lower timeframe trend structure using EMA-based regime analysis. This indicator uses the relationship between the EMA 20 and EMA 50 across two user-defined timeframes to identify: directional bias, market structure alignment, and overall trend condition. It is built to simplify multi-timeframe analysis into a clean and intuitive dashboard suitable for intraday, swing, futures/fx/crypto trading. How It Works The indicator compares: EMA 20 EMA 50 on two independently customizable timeframes: 1. Directional Bias Timeframe Defines the broader market direction. Example: 1H 4H Daily 2. Trend Structure Timeframe Defines the lower timeframe trend condition and execution environment. Regime Logic Bullish Condition EMA 20 > EMA 50 Bearish Condition EMA 20 < EMA 50 The indicator then evaluates whether both timeframes are aligned. Alignment States: FULL BULLISH / FULL BEARISH / MIXED FULL BULLISH : Both timeframes bullish FULL BEARISH : Both timeframes bearish MIXED: Not Aligned Example Configurations Intraday Trading Directional Bias TF = 1H Structure TF = 15M Swing Trading Directional Bias TF = Daily Structure TF = 4H Scalping Directional Bias TF = 15M Structure TF = 5M This indicator helps traders: stay aligned with dominant trend flow, avoid counter-trend trades, improve trade selection, filter low-quality setups, and better understand overall market structure. When higher and lower timeframe trends align, probability and momentum continuation often improve significantly.Chỉ báocủa Kamaalique16
T3 + RSI ZigZag + S/R + MA This was done for testing purposes; it's for those who develop the code and benefit from it.Chỉ báocủa GLRSMEER81
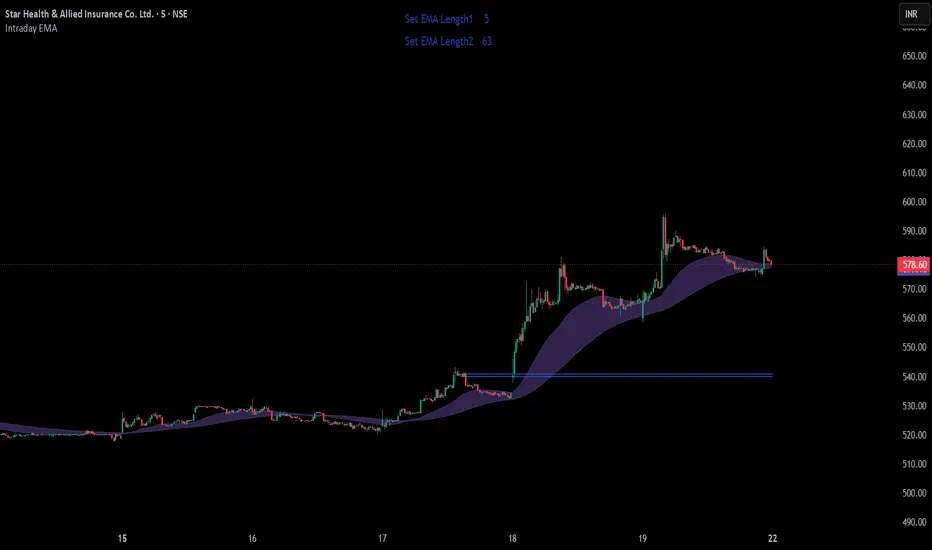
Daily EMA Custom EMA Ribbon (3x Daily) This indicator plots three Exponential Moving Averages (EMAs) that are always calculated on the daily timeframe — no matter what chart timeframe you're viewing. Whether you're on the 1-minute, 5-minute, or 4-hour chart, the EMAs will always reflect daily values, giving you a clear view of the higher timeframe trend while you trade on lower timeframes. Default EMAs: 9 / 21 / 50 (fully customizable via settings)Chỉ báocủa pnjonkerinvestments5
Koko's Sniper Entry This indicator is built around one core idea: wait for everything to align, then strike with precision. Koko's Sniper Entry combines a dynamic EMA channel with a 4-hour bias filter and 5-minute entry confirmation to identify high-probability trade setups across futures and crypto markets. Designed for YM, MYM, MGC, NQ, SI, and LTCUSD. How it works: The EMA channel defines the range. When price breaks out with a strong clearing bar, the system checks three things before firing a signal — the 4-hour candle's wick rejection (which direction is the market actually defending), whether the 5-minute entry candle shows clean intent with no wicks fighting the move, and whether the session timing is right. Only when all of those align does the indicator mark a signal. That's the sniper shot. Signal types: BUY-E / SELL-E — Early signal. Clearing bar confirmed, watching for full entry. BUY-S / SELL-S — Smart signal. Full confirmation. This is the entry. Built-in features: 4-hour bias filter using wick rejection analysis ATR-based stop loss and take profit levels Session filter for Asia, London, and NY 4-hour trade window — auto-expires after the setup window closes PickMyTrade webhook alerts for automated execution On-chart dashboard showing bias, session, signal state, and ATR The philosophy: Most traders overtrade. This system is designed to make you wait — and when the moment comes, you already feel it before you see it. The indicator just confirms what you know. For educational purposes. Not financial advice. Always trade within your prop firm rules and risk parameters.Chỉ báocủa ds40148
Marlow System HelperMarlow System Helper — это трендовый сигнальный индикатор, разработанный для поиска более качественных точек входа с помощью многоуровневой системы фильтрации. В основе алгоритма лежит комбинация EMA crossover, momentum-анализа и фильтрации рыночной волатильности. Индикатор не пытается выдавать большое количество сигналов — его задача заключается в том, чтобы отсеивать слабые и хаотичные входы, оставляя только наиболее вероятные продолжения движения. В индикатор встроено несколько независимых фильтров: • Trend Filter (EMA 200) Сигналы BUY появляются только выше глобального тренда, а сигналы SELL — только ниже него. Это позволяет избегать большинства контртрендовых входов и снижает количество ложных сигналов во флэте. • EMA Direction Filter Дополнительно анализируется направление самой трендовой EMA. Система ищет только те входы, которые совпадают с текущим направлением рынка. • Momentum Confirmation Перед появлением сигнала алгоритм проверяет наличие импульса в движении цены. Это помогает исключать слабые пробои и случайные пересечения скользящих средних. • ATR Volatility Filter Встроенный фильтр волатильности анализирует текущую активность рынка через ATR. Сигналы во время низкой волатильности и бокового движения автоматически игнорируются. • Smart Signal Filter Индикатор использует систему защиты от повторных сигналов. Вместо большого количества одинаковых BUY или SELL подряд отображается только первый подтвержденный вход в направлении движения. • Cooldown System После появления сигнала алгоритм делает небольшую паузу перед поиском следующего входа. Это дополнительно уменьшает шум и снижает количество лишних уведомлений. Индикатор специально выполнен в минималистичном стиле — на графике отображаются только точки входа без лишних линий и перегруженных элементов интерфейса. Подходит для: — Поиска трендов — Скальпинга — Forex / Crypto / Indices Лучше всего работает на волатильных трендовых рынках.Chỉ báocủa EminMarlowFX13
QuantEdge Scalper ProФильтр тренда Стек EMA 20 / EMA 50 + позиция относительно VWAP. Все три должны совпадать. Обнаружение компрессии EMA блокирует торговлю во флэте. EMA 20 EMA 50 VWAP Фильтр волатильности (ATR) ATR(14) сравнивается с его скользящей средней. Сигналы появляются только когда ATR между 0.5× и 4× базового уровня — исключаются флэт и экстремальные всплески. ATR(14) SMA ATR Мин/Макс Фильтр объёма Объём текущего бара должен превышать 1.5× от 20-периодной SMA объёма. Множитель настраивается. Флаг всплеска используется повторно в подтверждении пробоя. SMA объёма(20) Всплеск 1.5× ADX — анти-боковик ADX(14) по Уайлдеру должен быть выше 20 (настраивается) И должна отсутствовать компрессия EMA. Оба условия нужны для подтверждения тренда. ADX(14) DI+ / DI− Компрессия EMA Рыночная структура Пивоты определяют HH/HL (бычий рынок) и LH/LL (медвежий). Только подтверждённые пивоты без заглядывания вперёд. Пробой структуры (BOS) — бонусный триггер. HH/HL LH/LL BOS Ликвидационное сметание Охота на стопы: фитиль прокалывает недавний экстремум, свеча закрывается обратно внутри. Бычье сметание = фитиль ниже минимума + закрытие выше него. Охота на стопы Прокол фитилём Разворот Подтверждение пробоя Цена должна закрыться за пределами 20-барного диапазона при одновременном всплеске объёма И теле свечи выше среднего. Фильтр ложных пробоев проверяет следующий бар. Диапазон(20) Размер тела Ложный пробой Зоны дисбаланса (FVG) Паттерн из 3 свечей: разрыв между максимумом свечи и минимумом свечи с подтверждающей средней свечой. Зоны отображаются прямоугольниками. 3-свечной гэп Зона дисбаланса Ордер-блоки (OB) Последняя противоположная свеча перед сильным импульсным движением (тело > 1.5× среднего). Бычий ОБ = медвежья свеча перед большой бычьей. Источник импульса Тело 1.5× Фильтр сессий Сигналы только в Лондонскую (08:00–17:00 GMT) и Нью-Йоркскую (13:00–22:00 ET) сессии. Перекрытие 13:00–17:00 GMT — наилучшие условия. Лондон Нью-Йорк Перекрытие MTF-байас (опционально) Данные старшего ТФ через lookahead_off — без перерисовки. По умолчанию ТФ: 60m. Лонги только если старший ТФ бычий. EMA старшего ТФ Нет lookahead RSI-импульс Опциональный фильтр RSI(14). Лонги: RSI > 60. Шорты: RSI < 40. Оба порога настраиваются. По умолчанию включён — отключите для чистого прайс-экшн. RSI(14) 60 / 40Chỉ báocủa Lizard_Trade113
Tension Flow Trend [BigBeluga] - Historical RRTension Flow Trend is a high-performance trend-following framework that treats price action like a reactive elastic system. By moving beyond static averages, this indicator introduces "Price Tension"—a sophisticated measurement of how overstretched a trend is relative to its baseline—now enhanced with a live Historical RR (Risk:Reward) backtesting engine. By combining the ultra-low-lag properties of the Hull Moving Average (HMA) with real-time Z-Score volatility analysis, this indicator visualizes not just the direction of the market, but the mathematical "exhaustion" of every move. 🔵 THE ELASTICITY FRAMEWORK The Ultra-Responsive HMA Baseline: At the heart of the system is a 50-period Hull Moving Average. Specifically engineered to eliminate the lag found in traditional SMAs, the HMA provides a "true north" that reacts instantly to structural shifts without the usual delay. Price Tension (Z-Score Engine): The indicator measures the vertical distance between price and the HMA, normalizing it using standard deviation. This Z-Score represents the "Tension" of the trend—showing you exactly when the market has deviated too far from its mean. Dynamic Transparency Feedback: As price enters an extreme Z-Score range, the trend ribbon’s transparency increases. A bright, solid ribbon indicates compressed, high-probability energy, while a fading ribbon warns that the "elastic band" is stretched to its limit. 🔵 PERFORMANCE & RISK INTELLIGENCE Automated RR Projection: Upon every "START" signal, the script automatically plots dynamic Risk:Reward boxes. It calculates an ATR-based stop loss and projects a take-profit target based on your custom RR ratio, visualizing the trade's path in real-time. Rolling Performance Tracker: The indicator features a built-in backtester that tracks the win/loss history of the most recent trades. It calculates your Win Rate based on a rolling sample size, allowing you to see how the strategy is performing under current market conditions. Signal Cooldown Logic: To eliminate "whipsaw" noise, a configurable cooldown engine ensures that signals only trigger during significant structural shifts. This prevents signal clustering in sideways or choppy markets. 🔵 DUAL-DASHBOARD SYSTEM Energy Monitor (Bottom-Right): Tracks the numerical Z-Score and categorizes the market status. "Strong" indicates healthy momentum, while "Overextended" warns of an imminent mean-reversion risk. RR Performance Table (Top-Right): Provides an institutional-grade breakdown of your strategy performance, including total Wins, Losses, and the current Win Rate percentage for the specified trade window. 🔵 STRATEGIC APPLICATION The Momentum Breakout: Look for "START" labels that appear when the HMA slope aligns with a price crossover. These represent the birth of a new trend cycle where tension is low and expansion is likely. Managing Trend Exhaustion: When the ribbon begins to fade and the Energy Dashboard hits "Overextended," it is time to tighten stops or take partial profits. High tension usually precedes a sharp snap-back to the baseline. Confirming with Win Rate: Use the Performance Dashboard to gauge market regime. If the rolling Win Rate is high, the market is respecting the trend envelopes; if it drops, the market may be entering a consolidation phase where you should wait for better alignment. Mean Reversion Targets: For contrarian traders, the HMA baseline serves as a natural "magnet." When price is significantly overextended, look for price to be pulled back into the HMA "Neutral Zone." Tension Flow Trend transforms your chart into a map of market stress and opportunity. By visualizing the tension behind every candle and providing real-time performance feedback, it ensures you stay on the right side of the trend while trading with professional-grade risk management.Chỉ báocủa BigBeluga1717 4.1 K
Daily MAs on Intraday Charts (Indian Market)Daily Moving Averages + VWAP — Indian Market (NSE/BSE) A comprehensive intraday analysis tool built exclusively for the **Indian stock markets (NSE & BSE)**. This indicator combines key Daily Moving Averages with a session-aware VWAP, all plotted directly on intraday charts — giving you a complete picture of where price stands relative to the most important daily levels without ever having to switch timeframes. --- **⚙️ How It Works** The Indian cash market trades for exactly **375 minutes per day** (9:15 AM – 3:30 PM IST). This indicator uses that fixed session length to dynamically back-calculate the exact number of intraday bars required to replicate each Daily Moving Average on any lower timeframe. Whether you are on a 1-minute or a 125-minute chart, every MA will always reflect its true daily value — no manual input or reconfiguration required when switching timeframes. --- **📈 Moving Averages Plotted** | MA | Type | Colour | |---|---|---| | 5 Day | SMA | White | | 10 Day | EMA | Sky Blue | | 21 Day | EMA | Green | | 50 Day | EMA | Orange | The **5 SMA** acts as a short-term trend filter and is widely tracked by momentum traders. The **10 and 21 EMAs** are key levels for swing and positional traders, offering dynamic near-term support and resistance. The **50 EMA** represents the medium-term trend and is one of the most watched levels by institutional traders in the Indian markets. --- **🕐 Supported Timeframes** The indicator automatically calculates the correct bar period for all intraday timeframes, including **1 min, 3 min, 5 min, 15 min, 25 min, 75 min, 125 min**, and any other intraday interval. It also works natively on the **Daily** and **Weekly** timeframes. > ⚠️ TradingView imposes a **5,000 bar limit** on historical data. As a result, MAs that require more bars than this limit on lower timeframes will display **"Insuf. Data"** in the table and will not plot on the chart. The affected MAs vary by timeframe as follows: > - **1 min** — only 5 SMA and 10 EMA are available > - **3 min** — 5 SMA, 10 EMA and 21 EMA are available > - **5 min and above** — all four MAs plot fully --- **📊 VWAP** The indicator includes a fully session-aware **Volume Weighted Average Price (VWAP)** plotted in purple. VWAP is one of the most widely used intraday benchmarks by institutional desks, prop traders, and retail participants alike, offering a real-time view of the average price weighted by volume traded during the session. Two modes are available via the settings: - **Historical VWAP on** — Plots TradingView's built-in VWAP continuously across all visible sessions, allowing you to study how price behaved relative to VWAP on previous days - **Historical VWAP off** — Acts as a true **Anchored VWAP**, anchored strictly to the **9:15 AM first candle of the current trading day**. All previous session VWAP lines are completely hidden, keeping the chart clean and focused on today's session only --- **🧮 Distance Table** An on-chart table displays the **live percentage distance of the current price from each MA and VWAP** in real time. This tells you at a glance how extended or compressed the price is relative to each key level. - 🟢 **Green** — price is trading above the level - 🔴 **Red** — price is trading below the level - ⚫ **Grey / "Insuf. Data"** — insufficient historical bars to calculate the MA on the current timeframe The table can be toggled on or off and repositioned to any of **9 positions** on the chart — top, middle, or bottom, aligned left, center, or right — so it never interferes with your price action. --- **🛠️ Settings** | Setting | Description | |---|---| | Show Distance Table | Toggle the MA and VWAP distance table on or off | | Label Position | Place the table in any of 9 positions on the chart | | Show VWAP | Toggle the VWAP line and its table row on or off | | Show Historical VWAP | When on, shows VWAP across all sessions. When off, anchors VWAP to today's 9:15 AM candle only | --- **⚠️ Important — Indian Markets Only** This indicator is **specifically calibrated for the Indian stock markets (NSE/BSE)** and is **not suitable for use on any other global market**. The period calculation is hardcoded to **375 minutes per trading day**, which is unique to the Indian cash market session. Applying this indicator to markets with different session lengths — such as US markets (390 minutes), European markets, or 24-hour crypto markets — will cause all Moving Averages to drift significantly from their true daily values and produce incorrect readings. --- *Built for Indian intraday, swing, and positional traders who trade with full awareness of key daily levels and session VWAP dynamics.*Chỉ báocủa RJ_lonewolfCập nhật 44118
Sourav Gold ADX + EMA 9/21 + EMA 200 SignalThis is EMA cross over signal with trending time only. Signal you get minimum. It's best work in 5 min time frame.Chỉ báocủa tooadi1124
XAUUSD ADX + EMA 9/21 + EMA 200 SignalThis is cross over signal but when market on trendingChỉ báocủa tooadi13
Scalping Signals (Range Filter + EMA)Scalping Signals Range Filter + EMA Gate Indicator — Confirmed Signals The Indicator is a trend-following and momentum confirmation tool designed to identify high-probability BUY and SELL opportunities while filtering out market noise and low-quality signals. This indicator combines a dynamic Range Filter system with EMA trend alignment, optional Bollinger filtering, and non-repainting confirmed candle logic to create cleaner market entries. Core Concepts 1. Range Filter Engine At the heart of the indicator is a smoothed Range Filter that adapts to market volatility. The filter acts as a dynamic trend baseline: Price above the filter → bullish pressure Price below the filter → bearish pressure The filter continuously adjusts based on recent market movement, helping reduce false signals during choppy conditions. 2. EMA Gate System The indicator uses a dual EMA gate mechanism: Fast EMA (default: 50) Slow EMA (default: 150) Signals are only allowed in the direction of the active EMA gate: 50 EMA above 150 EMA → long signals only 50 EMA below 150 EMA → short signals only This prevents counter-trend trades and helps align entries with the dominant market structure. 3. Optional EMA 200 Trend Filter An additional higher-timeframe style trend filter can be enabled using the EMA 200. When enabled: BUY signals require price above EMA 200 SELL signals require price below EMA 200 This helps avoid trading against the broader trend. 4. Optional Bollinger Filter The Bollinger filter can be enabled to further validate momentum: Longs allowed only above Bollinger basis Shorts allowed only below Bollinger basis This can help remove weak signals during sideways conditions. 5. Confirmed Non-Repainting Signals The indicator uses confirmed candle logic: Signals only appear after candle close No future candle references No lookahead logic No repainting on closed candles This makes the signals more reliable for live trading and alerts. Features Adaptive Range Filter EMA Gate Direction System Optional EMA 200 Trend Filter Optional Bollinger Confirmation Filter BUY/SELL Signal Labels Confirmed Candle Signals Non-Repainting Logic Heikin-Ashi Source Support Alert Conditions Included Debug Visualization Mode Recommended Usage This indicator works best in trending environments and can be used for: Trend-following strategies Pullback entries Momentum continuation trades Scalping Intraday trading Swing trading Popular timeframes: 1m 5m 15m 1H Alerts Included alert conditions: BUY Signal Confirmed SELL Signal Confirmed EMA Gate Bullish Confirmed EMA Gate Bearish Confirmed For best results, use TradingView alerts with: “Once Per Bar Close” Notes This indicator is designed as a signal and confirmation tool, not a complete trading system. Proper risk management, stop-loss placement, and market context analysis are still required.Chỉ báocủa JOEXYZzzCập nhật 649
Aureate Market Architecture Strategy [JOAT]Aureate Market Architecture Strategy Introduction Aureate Market Architecture Strategy is an open-source TradingView strategy that integrates regime classification, structure bias, breakout pressure, liquidity confirmation, and risk management into one confirmed-bar execution model. The strategy is built for users who want a rules-based implementation of the broader JOAT architecture rather than a single-indicator signal stream. Its design goal is not to maximize trade count. Its design goal is to trade only when multiple independent conditions agree: the market is in an expansion-permitted regime structure bias supports direction pressure is strong enough to justify participation liquidity context confirms the move risk and daily drawdown constraints allow a new position This produces a strategy that is intentionally selective and explicitly non-repainting. Core Concepts 1. Regime Detection The strategy classifies the market into accumulation, expansion, or exhaustion using ATR behavior, balance width, and normalized breakout pressure. A persistence requirement prevents the regime state from flipping too quickly. 2. Structure Bias Filter Directional participation is gated by confirmed medium-term structural breaks, EMA orientation, and price location relative to the fast EMA. An optional higher-timeframe bias filter can be added using completed higher-timeframe candles only. 3. Pressure Confirmation Breakout pressure is derived from a composite of multiple ROC windows and smoothed into an adaptive signal. The strategy does not permit entries unless that signal exceeds its volatility-adjusted threshold. 4. Liquidity Context The strategy estimates upper and lower liquidity anchors, counts relative touch density, and looks for sweep failure behavior to confirm whether the current move has supportive liquidity context. 5. Risk and Exit Stack Every position uses an initial stop, a take-profit target based on risk multiple, an adaptive trailing component, a daily loss lockout, and a cooldown after exit. Features Three-state regime engine: accumulation, expansion, and exhaustion Persistence logic: regime changes require confirmation across multiple bars Structure bias filter: confirmed BOS logic combined with EMA alignment Optional HTF bias filter: completed higher-timeframe candles only Adaptive breakout pressure: multi-window ROC model normalized by its own volatility Liquidity confirmation: anchor touches, sweep failures, and relative-volume support Long and short entry logic: both directions use the same confirmed-bar architecture Risk management: ATR-based initial stop, target, trailing logic, and daily loss control Cooldown control: prevents immediate re-entry after an exit Dashboard and chart overlays: display current state, active bias, and risk context Default Strategy Properties Initial Capital: 100000 Order Size: 10% of equity Commission Model: Percent Commission Value: 0.01 Pyramiding: 0 Calc On Order Fills: enabled Calc On Every Tick: disabled Input Parameters Regime Engine Regime ATR Length Regime Baseline Length Balance Window Accumulation Volatility Threshold Expansion Volatility Threshold Regime Persistence Bars Structure Bias Short Pivot Medium Pivot Fast EMA Slow EMA Use Confirmed HTF Bias Filter HTF Bias Timeframe Breakout Pressure Fast ROC Medium ROC Slow ROC Macro ROC Pressure Smoothing Pressure Threshold Multiplier Liquidity Context Liquidity Window Sweep Depth ATR Relative Volume Floor Risk Management Initial Stop ATR Take Profit R Multiple Trail ATR Multiple Daily Lockout % Cooldown Bars After Exit How to Use This Strategy Step 1: Treat the Regime as the First Gate The strategy only wants to be active in the expansion state. If the dashboard shows accumulation or exhaustion, the system is designed to be more selective or inactive. Step 2: Check Directional Alignment The cleanest trades occur when structure bias, EMA alignment, pressure, and liquidity all support the same side. Step 3: Respect the Risk Model The stop, target, trail, and daily lockout are part of the strategy logic. They should not be ignored when evaluating results. Step 4: Expect Selectivity This strategy is built to filter aggressively. Users looking for frequent trades may need different settings or a different methodology. Step 5: Evaluate Over Enough Trades No strategy should be judged from a very small sample. Assess it across enough market conditions to understand where the architecture performs well and where it degrades. Strategy Limitations This strategy uses chart-derived liquidity and regime approximations rather than exchange microstructure data Selective filters can reduce trade frequency substantially on some instruments and timeframes Backtest results depend on instrument, timeframe, commission, slippage assumptions, and session behavior Non-repainting logic reduces false signals but can also introduce later entries than predictive systems Originality Statement Aureate Market Architecture Strategy is original in the way it integrates regime state, structural confirmation, normalized pressure, liquidity context, and layered risk controls into one coherent execution model. The purpose of the integration is practical: each component addresses a different failure mode that appears when breakout systems rely on only one dimension of evidence. Disclaimer This strategy is provided for educational and informational purposes only. It is not financial advice and does not guarantee profitability. Backtest outcomes are hypothetical and derived from historical data. Live trading includes slippage, execution variance, and market conditions that can differ materially from historical results. Chiến lượccủa officialjackofalltrades18
Mirror MomentumThis indicator uses a mirror-based momentum structure built on an adaptive center axis. Unlike traditional inverted indicators that simply negate price or apply static transformations, this model introduces a dynamic reflection mechanism: Price is mirrored around a moving EMA-based center This creates an adaptive reflection axis that evolves with market structure The mirrored signal is then combined with smoothed momentum mirrorMomentum = (2 * (center - price)) + momentum Core Components Symmetry mapping (reflection around a dynamic center) Momentum injection (trend force embedded into the mirrored structure) Adaptive distortion (volatility reshaping the mirror behavior) This results in a dual-sided momentum oscillator that captures both directional movement and its reflected pressure. It is not a simple inverse price oscillator, but a center-based adaptive mirrored momentum system. Structural Interpretation (Important) The indicator evaluates the distance (spread) between momentum and its mirrored structure as a measure of internal trend strength. Wide separation between lines → strong trend expansion (trend continuation phase) Narrowing of the lines → compression phase (trend exhaustion or potential reversal zone) In addition, extreme wide expansion zones often correspond to major tops and bottoms, meaning that signals tend to behave more reliably within trending conditions. Therefore, signals are generally more suitable for trend-following confirmation rather than standalone prediction, and the structure is better interpreted visually for identifying potential reversal zones. 🇹🇷 Türkçe Açıklama Bu indikatör, dinamik merkez ekseni üzerine kurulu mirror (ayna) tabanlı bir momentum yapısı kullanır. Klasik tersleme indikatörlerinden farklı olarak (sadece fiyatı negatiflemek veya sabit çevirme yapmak gibi), bu model adaptif bir yansıma mekanizması içerir: Fiyat, EMA tabanlı hareketli bir merkez etrafında yansıtılır Bu sayede piyasa yapısına göre değişen bir “dinamik ayna ekseni” oluşur Daha sonra bu yansıma, momentum ile birleştirilir mirrorMomentum = (2 * (center - price)) + momentum Temel Bileşenler Simetri haritalaması (dinamik merkez etrafında yansıma) Momentum enjeksiyonu (trend gücünün yapıya eklenmesi) Adaptif bozulma (volatiliteye göre şekil değiştiren ayna davranışı) Bu yapı, hem yönü hem de karşıt hareketi yakalayan çift taraflı bir momentum osilatörü üretir. Bu sistem klasik “inverse price” indikatörü değildir; merkez bazlı adaptif mirror momentum yapısıdır. Yapısal Yorum (Önemli) İndikatör, momentum ile mirror yapı arasındaki mesafeyi (spread’i) trend gücü olarak yorumlar. Çizgilerin geniş açılması → güçlü trend genişlemesi (trend devam fazı) Çizgilerin daralması → sıkışma (zayıflama / olası dönüş bölgesi) Ayrıca en geniş açılma bölgeleri genellikle majör tepe ve dip bölgelerine denk gelir, bu yüzden sinyaller trend koşullarında daha sağlıklı çalışır. Bu yapı, tek başına tahmin aracı olmaktan çok trend takibi ve görsel analiz için daha uygundur, özellikle dönüş bölgelerini gözle okumak için güçlü bir yapı sunar.Chỉ báocủa onderarslantas1072226
Trinity Magic EMA Ribbon Pro### **User Guide – Trinity Magic EMA Ribbon Pro + Candle Coloring** #### **1. What Does This Indicator Do?** It creates a **3-line EMA Ribbon** (High, HLC3, Low) and dynamically colors: - The ribbon itself (bullish / bearish / neutral) - The candles (body, border, and wick) based on the ribbon’s position relative to price. #### **2. How to Read the Ribbon** | Ribbon Position | Color | Meaning | Candle Color | |--------------------------|----------------|----------------------------------|--------------| | Ribbon **below** price | **Green** | Strong Bullish Trend | Green | | Ribbon **above** price | **Red** | Strong Bearish Trend | Red | | Price **inside** ribbon | **Orange/Yellow** | Consolidation / Weak Trend | Orange | #### **3. Settings Explained** **EMA Ribbon Settings** - **EMA High / HLC3 / Low Period** → Default = **20** (you can change all three) - **Ribbon Fill Transparency** → How see-through the background fill is (0 = solid, 100 = invisible) - **Bull / Bear / Neutral Colors** → Colors for the ribbon lines and fill - **Show EMA Lines** → Turn the 3 EMA lines on/off **Candle Coloring Settings** - **Color Candles Based on Ribbon** → Main on/off switch - Bull / Bear / Neutral sections → Full control over **Body**, **Border**, and **Wick** colors #### **4. How to Use It Effectively** - **Trend Trading**: Look for green candles + ribbon below price (strong uptrend) - **Mean Reversion**: Orange candles when price is inside the ribbon (range trading) - **Reversals**: Watch for color changes (especially ribbon flipping from red to green or vice versa) - Best used on **lower timeframes** with period 20, or higher timeframes with higher periods (e.g. 50–96) #### **5. Tips** - Turn off “Color Candles” if you prefer standard TradingView candles. - You can hide the EMA lines and only use the fill + candle coloring for a cleaner chart. - Works on any market: Stocks, Forex, Crypto, Futures. Chỉ báocủa EMA34TRADER22288
Uptrick: Liquid Reversal BandsIntroduction Liquid Reversal Bands is an overlay indicator designed to help traders identify dynamic support and resistance zones, detect mean-reversion opportunities, and read price position within a volatility-aware envelope. Rather than using fixed standard deviation bands around a single moving average, this system builds its band width from multiple volatility components simultaneously, creating a more adaptive and stable envelope that responds to changing market conditions without overreacting to short-term noise. The candle coloring, fair value line, and band fills all carry live visual information, making it possible to assess market state and recent signal context at a glance without needing additional tools on the chart. How It Works The centerline, referred to as the Liquid Fair Value, is computed by blending an EMA and an ALMA with a fixed offset and phase bias, then applying a secondary smoothing pass. This produces a centerline that is faster than a plain EMA but more stable than a raw ALMA, reducing lag while avoiding erratic pivots. Band width is calculated from four volatility components: the standard deviation of price deviation from the fair value, a standard ATR reading, an EMA of absolute deviation, and an EMA of bar range energy. These four components are weighted and blended into a single composite width value that is then smoothed again before being applied to the upper and lower bands. This approach means the bands widen during high-volatility conditions driven by any combination of momentum, range expansion, or sustained deviation, rather than relying on a single measure that may miss one type of volatility while overreacting to another. Reversal signals are generated when price closes back inside a band after having closed outside it on the prior bar. This close-crossing logic filters out brief wicks and requires a confirmed return into the envelope before triggering. An optional cooldown parameter prevents back-to-back signals within a defined number of bars. Candle coloring operates in two selectable modes. In Reversal Heat mode, candles are colored continuously based on their real-time position within the band range, shifting from the bullish teal near the lower band to the bearish magenta near the upper band, with a full gradient in between. In Latest Signal mode, all candles take the solid color of the most recent confirmed signal direction, holding that color until the opposite signal fires. This mode is useful for traders who want a persistent visual reminder of the current signal bias rather than a moment-to-moment position readout. The fair value line uses a separate slope-based gradient that transitions between bull and bear color depending on the direction and smoothed magnitude of the centerline trend. Optional outer bands extend beyond the primary envelope and can be enabled to identify extreme extension zones. Baseline Design Rationale The Liquid Fair Value uses EMA and ALMA specifically because they address opposite weaknesses. A standard EMA is computationally stable and reacts smoothly to recent price but carries lag from its uniform weighting. ALMA uses a Gaussian-weighted kernel that concentrates sensitivity toward recent bars while suppressing older data, which reduces lag but can introduce instability on sharp reversals. Blending the two captures the smoothness and stability of the EMA alongside the reduced lag of the ALMA, producing a centerline that neither drags excessively in trends nor overreacts to brief spikes. The secondary EMA pass applied afterward further damps any residual instability from the ALMA component without reintroducing significant lag. Features Liquid Fair Value centerline blending EMA and ALMA with dual-pass smoothing for a stable yet responsive mid-line Composite band width derived from four volatility sources: deviation standard deviation, ATR, absolute deviation EMA, and bar range energy EMA Primary upper and lower bands with independent multiplier controls Optional outer bands for identifying extreme price extension, each with its own multiplier Candle Coloring Mode selector with two options: Reversal Heat for continuous gradient coloring based on live band position, and Latest Signal for persistent directional coloring based on the most recent confirmed signal Slope-based gradient coloring on the fair value line, transitioning between bullish and bearish color depending on trend direction and strength Slope sensitivity and smoothing controls to tune how quickly the fair value line color responds to directional changes Close-crossing reversal signals that trigger only when price re-enters a band after a confirmed close outside it Configurable signal cooldown to space out signals and reduce repetitive triggers in choppy conditions Gradient band fills between the fair value and upper and lower bands using directional color transparency Outer band fills rendered separately with their own transparency layer when enabled Alert conditions for both buy and sell signals Inputs Source: The price series used for all calculations. Defaults to close. Fair Value Length: Controls the lookback period for both the EMA and ALMA that form the Liquid Fair Value centerline. Higher values produce a smoother and slower centerline. Z-Width Lookback: The lookback window used to compute deviation standard deviation and absolute deviation mean. Larger values stabilize band width but reduce responsiveness to recent volatility shifts. Band Smoothness: Controls the final EMA smoothing applied to the composite band width. Higher values produce wider, more stable bands. Upper Band Multiplier and Lower Band Multiplier: Scale the upper and lower band distances from the fair value independently. Higher values push the bands further out, producing fewer signal triggers. Outer Upper Band Multiplier and Outer Lower Band Multiplier: Applied on top of the primary multipliers to define the outer band distance. Only visible when outer bands are enabled. Candle Coloring Mode: Selects how candles are colored. Reversal Heat maps each candle continuously to its current position within the band range. Latest Signal holds the color of the most recent confirmed buy or sell signal until the opposite signal fires. Show Signals: Toggle to enable or disable reversal signal labels on the chart. Signal Cooldown: Minimum number of bars that must pass between consecutive signals. Set to zero to allow signals on every qualifying bar. Show Outer Bands: Toggle to enable or disable the outer band plots and their fills. Slope Smoothing Length: Controls how many bars are used to smooth the fair value slope before it is mapped to a color. Lower values make the line color react faster to direction changes. Slope Color Sensitivity: Scales how aggressively the slope magnitude maps to the color gradient. Lower values cause the line to reach full bull or bear color more quickly. Originality Most band-based indicators derive their width from a single volatility measure, typically standard deviation or ATR alone. Liquid Reversal Bands constructs its width from a weighted blend of four distinct volatility inputs, each capturing a different aspect of market activity. The additional smoothing hierarchy applied to both the centerline and the width ensures that bands expand and contract in a measured way rather than spiking on single-bar outliers. The dual candle coloring system offers two meaningfully different visual modes: one that reflects continuous real-time price positioning within the envelope, and one that reflects confirmed signal direction as a persistent state, giving traders a choice between positional awareness and signal context depending on their preference. The slope gradient on the fair value line is driven by a normalized and smoothed slope calculation, making it resistant to brief direction changes while still reflecting genuine trend shifts. Conclusion Liquid Reversal Bands is built for traders who want a mean-reversion and trend context tool that adapts to volatility through multiple lenses simultaneously. The composite width model, the selectable candle coloring modes, and the close-crossing signal logic together produce a system designed for clarity, stability, and honest visual representation of price state within the envelope. Disclaimer This indicator is published for educational and analytical purposes only. It does not constitute financial advice. Past behavior of any indicator does not guarantee future results. Always apply your own analysis and risk management before making any trading decisions.Chỉ báocủa Uptrick11 1.2 K