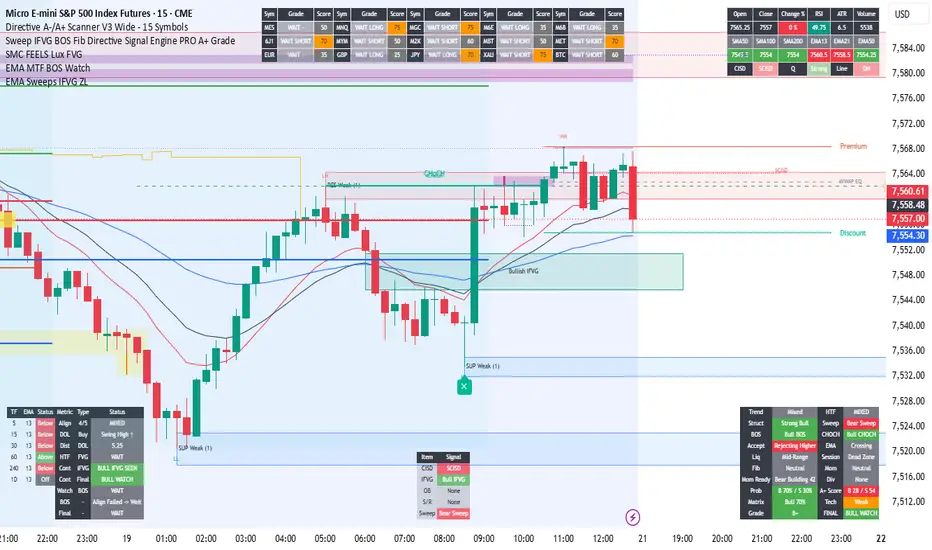
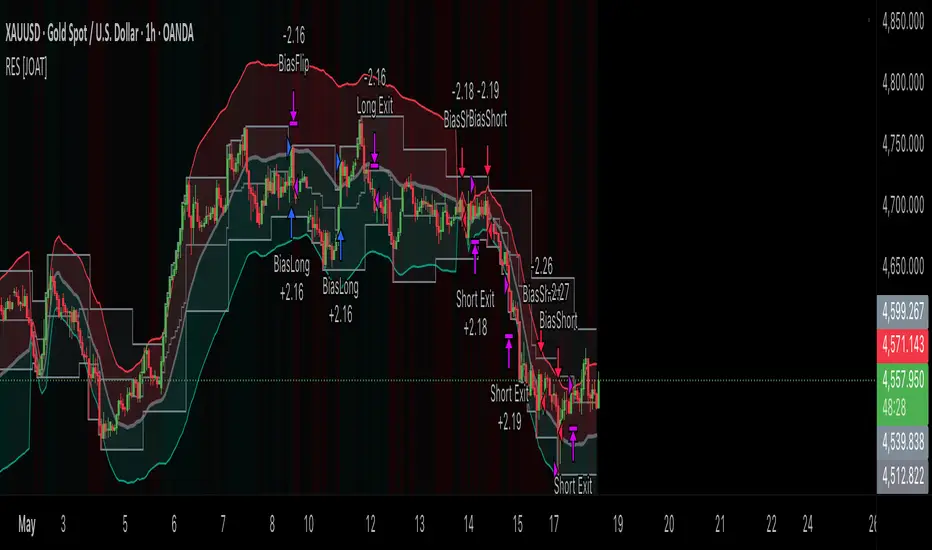
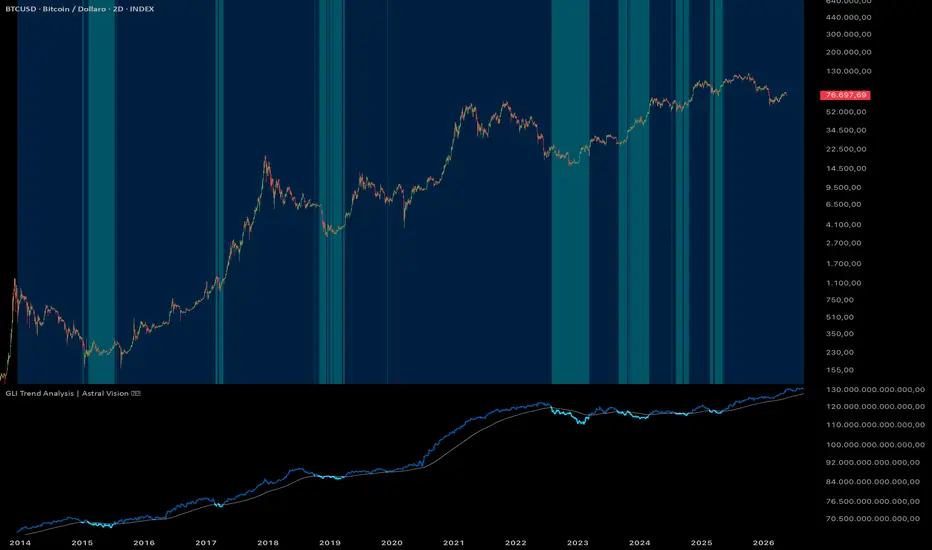
SwiftLevelsSwiftLevels is a clean, all-in-one overlay indicator that keeps the most important price reference levels and daily moving averages visible at a glance — without cluttering your chart.
━━━━━━━━━━━━━━━━━━━━━━━━━━━━━━━━━━━━━
PRIOR DAY & PRIOR WEEK LEVELS
━━━━━━━━━━━━━━━━━━━━━━━━━━━━━━━━━━━━━
On intraday charts, SwiftLevels draws horizontal lines for the prior day high/low and prior week high/low. Lines are anchored to the prior session's open so they don't clutter the left side of the chart. Labels float at the right edge of the current session and update each bar close to show the live percentage distance from price — positive when price is above, negative when below.
Example: PRIOR DAY (+1.24%) PRIOR WEEK (-0.87%)
Colors and label visibility are fully configurable per level group.
━━━━━━━━━━━━━━━━━━━━━━━━━━━━━━━━━━━━━
DAILY MOVING AVERAGES (5 fully configurable)
━━━━━━━━━━━━━━━━━━━━━━━━━━━━━━━━━━━━━
Five independent moving averages, each calculated from daily chart data regardless of your current timeframe.
On intraday charts:
• Each MA is drawn as a clean horizontal line starting at today's session open and extending right — no stair-stepping history, no noise from previous sessions.
• Labels appear just before the line starts, showing the MA name and live % distance from price, updated each bar close.
• Example: 20d SMA (+2.11%) 50d SMA (-0.44%)
On the daily chart:
• MAs are displayed as traditional full-history plots so you can see the curve over time.
• Can be toggled on/off with the "Display on Daily" checkbox.
On weekly/monthly charts:
• MAs are hidden to keep those timeframes uncluttered.
Each moving average is independently configurable:
• Enable / disable
• Length (default: 5, 10, 20, 50, 200)
• SMA or EMA toggle
• Custom color
• Line width
Chỉ báo