AG Pro OBV Pressure Divergence [AGPro Series]AG Pro OBV Pressure Divergence
Overview
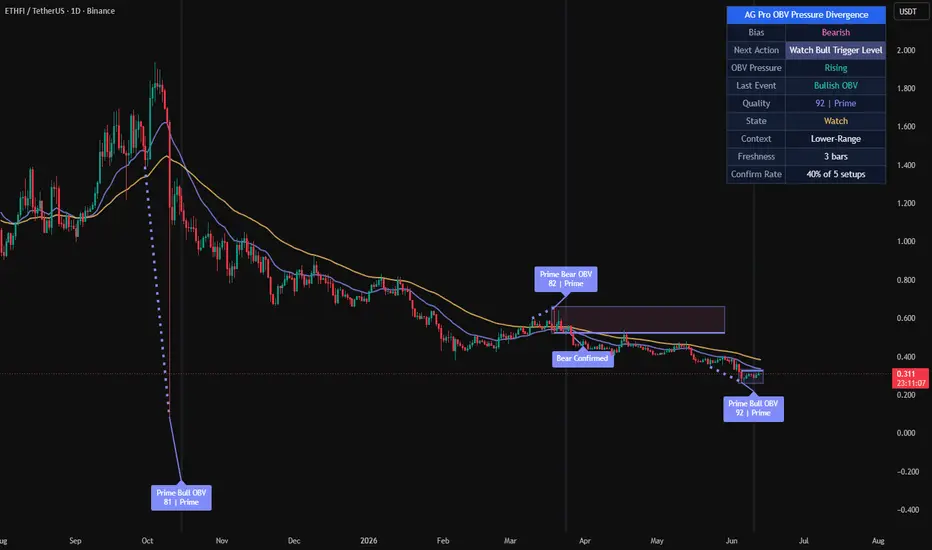
AG Pro OBV Pressure Divergence is a context-aware divergence quality map built around the relationship between price structure and On-Balance Volume pressure.
The script is designed to identify bullish and bearish divergence events, then rank those events by participation quality, structural context, and follow-through behavior. Instead of treating every divergence as equally important, it separates weaker pressure disagreements from more meaningful setups and organizes them into a cleaner decision framework.
This is not a generic divergence marker that prints every local mismatch between price and an underlying series. Its purpose is to classify divergence events through a layered process that includes pivot structure, price displacement, OBV behavior, trend context, confirmation timing, and visual emphasis.
The result is a tool that can be used to study when price and participation begin to disagree, while still preserving a practical chart view that remains readable during live market conditions.
What this script does
- Detects bullish divergence when price forms a lower low while OBV forms a higher low
- Detects bearish divergence when price forms a higher high while OBV forms a lower high
- Filters divergence candidates using pivot separation and ATR-based price swing requirements
- Scores events by quality instead of treating all signals the same
- Highlights the strongest events with more prominent chart objects
- Tracks confirmation and invalidation behavior after the initial event
- Displays a compact summary panel for state, pressure, context, and freshness
Unique Edge
Many divergence tools stop at basic detection. They show a disagreement between price and an oscillator or cumulative volume series and leave the rest to the user.
This script takes a different approach.
Its goal is not to maximize the number of divergence labels on the chart. Its goal is to classify divergence quality.
That difference matters. A simple divergence can appear in noisy conditions, in weak structural locations, or without any meaningful follow-through. In those cases, the event may still be technically valid, but not equally useful from an analytical point of view.
AG Pro OBV Pressure Divergence attempts to address that by combining several layers:
1. Structural divergence detection
2. ATR-normalized price displacement filtering
3. OBV pressure comparison between pivots
4. Local trend context using fast and slow EMA structure
5. Setup monitoring through confirmation and invalidation logic
6. Visual hierarchy that distinguishes lower-quality from higher-quality events
Because of this design, the script is better understood as a divergence classification framework rather than a simple divergence marker.
It is also distinct from breakout, reclaim, or trend continuation tools. It does not evaluate break-retest mechanics, VWAP reclaim logic, or general trend strength as its primary objective. Its focus is the quality of price-versus-participation disagreement.
Methodology
The script begins by identifying swing pivots through a configurable pivot length. These pivots form the structural anchor points used to compare price and OBV behavior.
For bullish divergence:
- price must form a lower low
- OBV must form a higher low
For bearish divergence:
- price must form a higher high
- OBV must form a lower high
After a raw divergence is found, the script applies additional requirements before the event is accepted:
Pivot Separation
A minimum bar gap is enforced between pivots so that tightly packed micro-swings do not dominate the output.
Minimum Price Swing
The distance between the two relevant pivots is measured relative to ATR. This prevents very small structural changes from being treated like full-quality events.
Pressure Evaluation
The OBV relationship between the two pivots is examined to determine whether participation is actually improving or weakening in a meaningful way.
Trend Context
Fast and slow EMA structure is used to frame whether the event is appearing against or within the prevailing price environment.
Contextual Location
The script also evaluates where the event is occurring in its local range structure. This helps separate mid-range noise from more interesting reversal or exhaustion locations.
Scoring
All of the above components contribute to a quality score. That score is then used to separate lower-priority events from stronger ones.
Confirmation
After the initial event, the script tracks a confirmation window. During that window, the setup may confirm, remain pending, expire, or become invalidated.
This layered structure is intentional. The script does not assume that a divergence label alone is enough.
Signal Structure
The script organizes events into a sequence instead of a single binary output.
Event Detected
A new bullish or bearish divergence is found and scored.
Pending State
The event remains active while the script monitors whether follow-through appears within the confirmation window.
Confirmed
If the confirmation condition is met within the allowed window, the event is marked as confirmed.
Invalidated
If price fails the setup before confirmation, the event is marked as invalidated.
Expired
If no confirmation occurs within the defined number of bars, the setup is no longer treated as active.
This state-based behavior is useful because it prevents the chart from presenting all divergence events as finalized conclusions the moment they appear.
Quality Model
The script uses a quality threshold and a premium threshold to distinguish event strength.
Lower-quality events can still be displayed when the user wants a fuller map of all structure, but the script can also be configured to focus only on stronger setups.
This creates three practical layers of interpretation:
Building
A divergence exists, but the score is lower and the event should be treated with more caution.
High
The event passes the main quality threshold and receives stronger visual treatment.
Premium
The event exceeds the premium threshold and receives the strongest category treatment in the script.
This does not mean that premium events are guarantees, and it does not imply that lower-quality events are unusable. It simply reflects that not every divergence deserves the same level of attention.
Panel Summary
The summary panel is intended to give quick context without forcing the user to inspect every label one by one.
The panel includes:
- Bias
A simple view of the current directional background based on the fast and slow EMA relationship.
- Pressure
A quick summary of whether OBV pressure is rising, falling, or mixed.
- Last Event
Shows the most recent detected divergence direction.
- Quality
Displays the score and current classification of the most recent event.
- State
Shows whether the most recent tracked setup is in watch, confirmed, invalidated, or idle state.
- Context
Provides a compact view of the local environment, such as trend-up, trend-down, or range-related placement.
- Freshness
Indicates how many bars have passed since the latest tracked event.
Visual Design
The chart output is intentionally organized with hierarchy.
Qualified events are easier to spot than weaker ones.
Confirmation labels are visually distinct from initial event labels.
Link lines help explain which two pivots created the divergence.
Optional background pulse and active setup zone provide temporary emphasis without permanently dominating the chart.
EMA context remains available but is visually secondary to the divergence structure.
Tooltips are included for key settings so that the logic behind the inputs remains understandable directly from the settings panel.
Signals and Alerts
The script includes alert conditions for the main state transitions:
- New Bullish Pressure Divergence
- New Bearish Pressure Divergence
- Premium Bullish Pressure Divergence
- Premium Bearish Pressure Divergence
- Bullish Pressure Divergence Confirmed
- Bearish Pressure Divergence Confirmed
- Pressure Divergence Invalidated
These alerts are designed to reflect internal script states rather than making claims about future price outcomes.
Key Inputs
Pivot Length
Controls how swings are defined. Higher values reduce noise but may delay detection.
OBV Smoothing
Smooths the OBV series before divergence analysis. Higher values create a cleaner but slower pressure curve.
Minimum Pivot Separation
Prevents overly compressed pivots from producing excessive clustering.
Minimum Price Swing (ATR)
Requires meaningful structural movement before a divergence is accepted.
Quality Threshold
Defines the minimum score required for a divergence to be treated as a qualified event.
Premium Threshold
Defines the score level required for premium classification.
Confirmation Window (Bars)
Controls how long a pending event is monitored before it expires.
Use Close-Based Confirmation
Switches confirmation logic between close-based behavior and intrabar high/low behavior.
Main Label Size
Scales event, confirmation, and invalidation labels.
Panel Text Size
Controls panel readability independently from chart labels.
Drawing Emphasis
Adjusts how visually prominent lines, EMA context, and active zone objects appear on the chart.
How to use it
This script is best approached as a context tool, not as a stand-alone decision engine.
A practical workflow may look like this:
1. Identify whether the panel context is aligned with a broad directional background or whether the market is behaving more like a range.
2. Observe whether a new divergence appears in a meaningful local location rather than in the middle of random price noise.
3. Compare the quality score and classification.
4. Watch whether the event confirms or invalidates within the chosen time window.
5. Combine the information with your own structure, risk, and execution framework.
The script is often more informative when used to reduce attention on weaker disagreements and concentrate on better-formed pressure divergences.
Who it may be useful for
This script may be useful for users who want:
- a more structured way to study price and OBV disagreement
- a cleaner divergence map with stronger visual hierarchy
- a chart that distinguishes raw detection from confirmed follow-through
- a volume-pressure oriented lens that is different from standard oscillator-only divergence tools
It may be less suitable for users who want a high-frequency signal stream, a one-click entry engine, or a tool that treats every local divergence as equally relevant.
Limitations and Transparency
This script has important limitations.
First, divergence is an analytical concept, not a guaranteed turning-point mechanism. A divergence can appear and still fail, extend, or resolve slowly.
Second, the scoring model is a ranking method, not a prediction formula. A higher score does not mean certainty. It only means that the event better satisfies the script's internal conditions.
Third, pivot-based logic requires structure to form. This means the script necessarily depends on completed swing information and will not behave like a forward-only projection model.
Fourth, confirmation and invalidation logic are simplifications intended to organize event follow-through. They do not replace full trade management, execution rules, or independent risk control.
Fifth, any indicator that uses volume-derived inputs depends on the characteristics of the underlying market data. Users should be aware that data quality and market structure can differ across symbols and venues.
This script is therefore best used as a contextual classification tool rather than a complete standalone methodology.
What this script is not
- It is not a guarantee of reversals.
- It is not a promise engine.
- It is not a fully automated trading system.
- It is not a substitute for independent structure analysis or risk management.
- It is not designed to predict every local top or bottom.
- It is not intended to imply that premium signals are always superior in every market condition.
Its purpose is narrower and more practical:
to organize OBV-based divergence events into a more useful analytical framework.
Risk Disclosure
This script is for chart analysis and research purposes only.
It does not provide financial advice, investment advice, portfolio advice, or a guarantee of future market behavior. Market conditions can change quickly, and any signal or classification generated by the script can fail or become invalid.
Users should make independent decisions and apply their own risk controls before acting on any chart output.
In summary
AG Pro OBV Pressure Divergence is a public, chart-based tool for analyzing divergence quality through the interaction of price structure and OBV pressure.
Its main contribution is not that it detects divergence, but that it attempts to rank divergence events by structural relevance, pressure context, and follow-through state.
For users who want a cleaner way to study whether price and participation are beginning to disagree, this script aims to provide a more selective and better-organized framework than a raw all-events divergence marker.
Chỉ báo