Chỉ báo
Các điểm Pivot

Chỉ báo
Pivot point labelThis script provides the user with a label containing the high and low pivot points from a period defined by the user.
Chỉ báo

Chiến lược

Ultimate Pivot PointsLately, there are a plethora of Pivot scripts on TV, I'll be adding one more :3
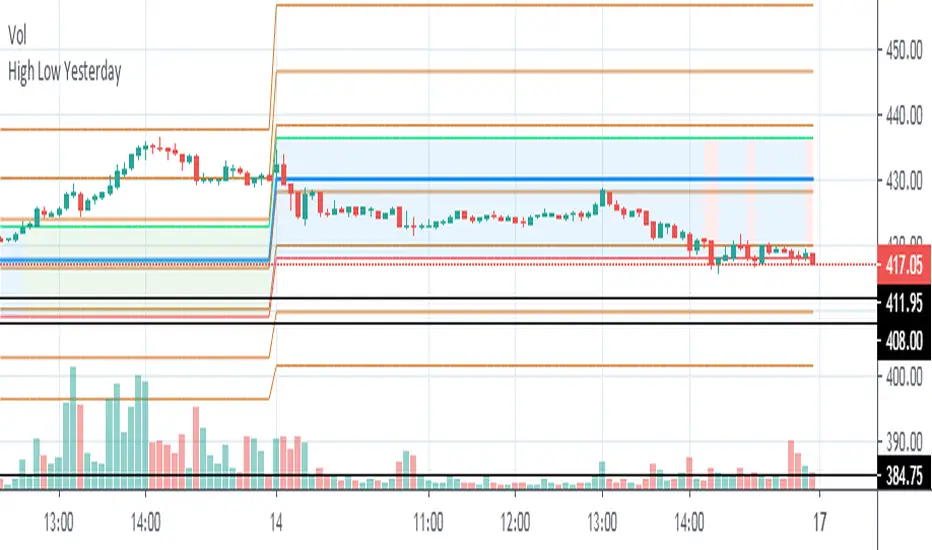
This is a combination that I use for my personal use so I've coded accordingly. Its the best combination of the regular pivot, woodie pivot, fib, and cams, in my humble opinion. Also added previous day high and low as those are the key levels for intraday traders.
Also, this is a multi-timeframe version.
Enjoy~
Chỉ báo

Pivot Reversal AlertsPivot Reversal Study script, for generating Alerts and visual plotting of Pivot Reversal lines on the charts. Use a Strategy script (like Figs & Dates), for backtesting different settings on various time frames and charts.
Chỉ báo

Ely Waves PivotsThese pivot points are used to create an expected range based on open and closing candle data. It's a mixture of two different types of pivots and together they form an expected range for various time frames. You can set them up from as little as 4 hours to 1 month. My personal favorites are 4 hour, 1 day, 1 week, and 1 month.
The dashed lines create the pivot area for the time frame chosen, and the thick lines create the expected high and low for the chosen time frame.
These are very powerful if used correctly!
Hope you enjoy!
Chỉ báo

CAMZONEAdded Fractals which establishes high and low based on Bill Williams definition. Added one type of Pinbar (where the open and close is near extreme of the range and with long shadow that is at least 80% of the range). It is a powerful reversal pattern especially on the daily charts. These bars are identified with the character P. Also included dots below momentum candles.
Chỉ báo

Chỉ báo

Fractal Adaptive Entry IndicatorThis entry indicator was inspired by John Ehle'rs "Fractal Adaptive Moving Average"
It's a very sensitive entry indicator that must be paired with a long-term trend detector in order to filter false positives.
Warning I have not backtested this indicator and will not make any claims to its performance.
Visually, it looks promising, however, backtesting and statistical analysis takes time.
Happy trading
<3
Chỉ báo

True Strong Classical Support/Resistance LevelsThis script is based on the approach of filtering signals by checking higher timeframes.
So basically setting higher numbers in "Strength Of Levels" option, will make the indicator check for support and/or resistance levels in timeframes higher than the current.
Unfortunately, I was forced to still use inefficient built-in functions pivothigh() and pivotlow(). I hope they fix them up soon!
I'm looking for any opinion about the idea and if you like any of my scripts, anything you send means a lot to me.
This script is published for the third time because of some moderators absurd behavior.
But thank heavens, the code is now more clean and of course the option "Strength Of Levels" accepts float numbers.
Chỉ báo

Chỉ báo

Chỉ báo

SOT INDICATOR for VSARussian language
SOT бар для VSA (Volume spread analysis)
Индикатор обозначает бары указывающие на остановку цены и возможный разворот.
Индикатор в первую очередь написан для таймфреймов от одного часа. На таймфреймах менее 1 часа сигнал будет приводить к неверным результатам, поскольку вечерние объемы существенно ниже дневных.
условие 1: закрытие текущего бара близко к закрытию предыдущего (достигается путём сравнения среднего диапазона последних 5 баров)
sma(high-close,5) - это средний диапазон за 5 баров
итого получается разница между закрытиями меньше 1/2 среднего диапазона за последние 5 баров.
Условие 2: должен быть хвост продаж или покупок (критерий - составляет не менее 2/3 от всего диапазона бара)
Условие 3: объемы должны быть увеличивающиеся (я взял, что текущей объем должен быть больше среднего за последние 5 баров)
Индикатор следует использовать совместно с теорией VSA.
English language (Google Translate)
SOT bar for VSA
The indicator indicates bars indicating a stop of the price and a possible reversal.
The indicator is primarily written for time frames from one hour. On time frames of less than 1 hour, the signal will lead to incorrect results, since evening volumes are significantly lower than daily volumes.
Condition 1: closing the current bar is close to closing the previous one (achieved by comparing the average range of the last 5 bars)
sma (high-close, 5) is the average range for 5 bars
total, the difference between closures is less than 1/2 of the average range for the last 5 bars.
Condition 2: there must be a tail of sales or purchases (the criterion is at least 2/3 of the entire range of the bar)
Condition 3: volumes must be increasing (I took that the current volume should be more than the average for the last 5 bars)
The indicator should be used in conjunction with VSA theory.
Chỉ báo

D, W, M_CPR + Camarilla + Value Area _ By SoumyaAll in one pivot points of combined D, W, M CPR, Camarilla & Value area. Inspired by Pivotboss book.
Chỉ báo

Pivot Points [CB]Automatically label pivots as HH/LH and HL/LL.
The criteria for determining pivot points can be configured.
Chỉ báo

SW System - EMAs - Pivots v2//=========================================================
// Indicator Name: SW System - Traditional Pivots and MA cross alerts - Plus Psychological Sup/Res
// Type: Main panel
// Version: 2
// Description: MA cross alerts - Plus Psychological Sup/Res
// Traditional Pivots in any time frame
// Author: Sergio Waldoke (Argentina)
// First Release: June 23rd, 2019
// Last Release: June 27 th, 2020
//
// This source code is subject to the terms of the Mozilla Public License 2.0 at mozilla.org
// © galileogalilei1 (Sergio Waldoke)
//==========================================================
Set of tendence and Support/Resistance with Pivots and psychological S/R in main prices. Four moving averages are provide which may be chosen between EMA or simple Moving Average.
Some alerts in crosses are provide.
Enjoy!
Chỉ báo
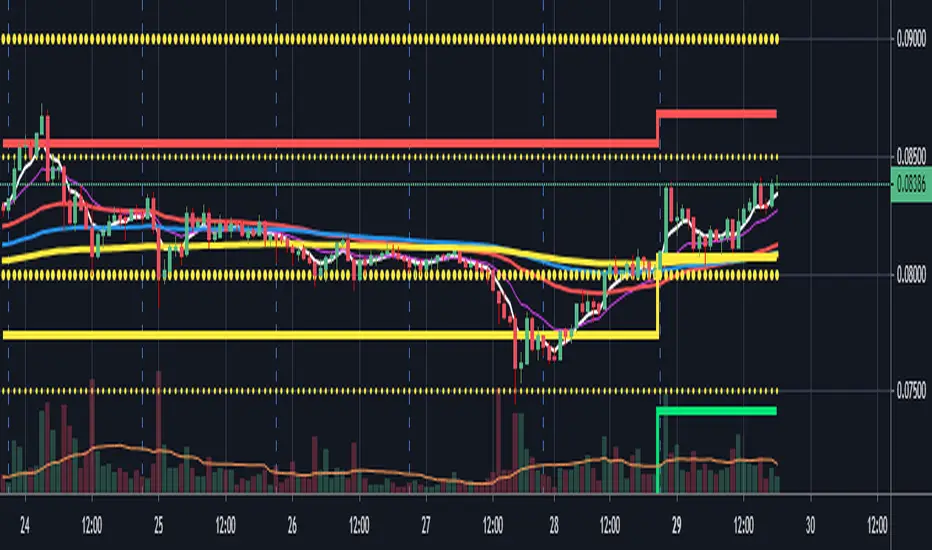
Monthly Weekly Daily Pivot Points StandardShow the monthly weekly and daily pivot points all at once , suitable for daytrading
Chỉ báo

Pivot Points with Monthly and Weekly optionsA pivot point indicator that has possibility to see even the monthly or the weekly pivot points .
Pivot points are very powerful if used in correct way.
most of the time the price can be rejected from the pivot point or if the price break it it will be a nice entry if retest the pivot
R2/S2 are a very strong pivots to break but of course you need a certain distance between the pivot
Chỉ báo
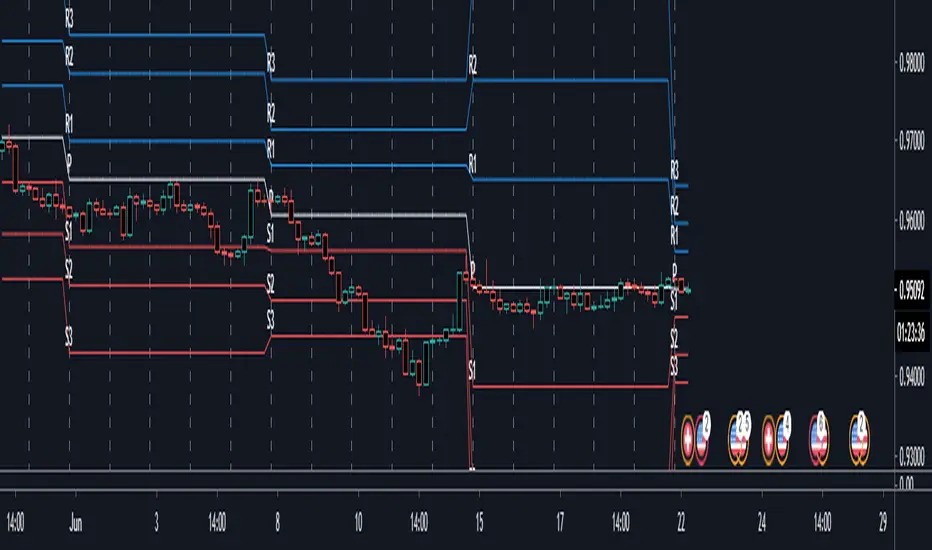
RVC-Trade-With-Pivot-LevelsHow to Use PIVOT Levels for Trading
Always remember ->: *Trade with trend*
About script:
1. Daily and Weekly close above Pivot Level.
-- Sentiment is highly positive. Pivot Level acts as strong support.
2. Daily Close above Pivot and Weekly Close Below Pivot
-- Sentiment is positive.Weekly Pivot Level may act as strong resistance.
3. Daily close below Pivot and weekly close above Pivot
-- Sentiment is negative but weekly Pivot Level can acts as strong support.
4. Daily and Weekly Close below Pivot Level
-- Sentiment is highly Negative. Pivot Level acts as strong resistance.
BUY/SELL -- ENTRY
BUY ABOVE 23.6% UPWARD
IF Trend is positive and price cross and sustains above 23.6%(R1) upside, then it will be entry from BUY perspective.
If R1 is entry, R2/R3/R4/R5 ... will be targets.
SELL Below 23.6% Downward
IF Trend is negative and price cross and sustains below 23.6%(S1) downside, then it will be entry from SELL perspective.
If S1 is Sell side entry, S2/S3/S4/S5 will be targets.
Before taking ENTRY on BUY or SELL Side, please know your risk levels, Stop Loss and trade EXECUTION process.
Finally:
My view is my view and remains with me only. Once you accept it and trade it, it becomes your view. So credit or blame all yours.:)
Chỉ báo

Montly Pivot Points indicatorA pivot point indicator that has possibility to see even the monthly or the weekly pivot points.
Pivot points are very powerful if used in correct way.
most of the time the price can be rejected from the pivot point or if the price break it it will be a nice entry if retest the pivot
R2/S2 are a very strong pivots to break but of course you need a certain distance between the pivot.
Chỉ báo

Shark-32 Pattern for Candle sticks AnalysisThis script is the perfect strategy for the all mighty shark-32 pattern.
It shows the power tussle between demand and supply before either of them finally gives up.
Chỉ báo

Classical Supports & ResistancesThis indicator shows classical resistance and support levels which retraced the chart lately. Notice that the condensed lines laying close together are showing an area of support and/or resistance.
But after all, it was a tedious work creating this indicator because like I've already said, pine script is a very odd and weak language which does not have many ordinary features like useful loops, simple line drawing and even reasonable variable casting!
So I was forced to use its built-in pivothigh() and pivotlow() functions without any handy documentation. I assume that even these functions don't work as expected, and because of that, I embedded "Sensitivity" and "Lookback Time" options in the indicator as a workaround.
Feel free to use it and send me your comments/solutions.
Chỉ báo
