PSG Ratio (price-sales/sales growth)This script plots the ratio of P/S (price-to-sales ratio) to Sales Growth Rate.Chỉ báocủa perfectforesight8
Risk Manager [SkaleHub]Overview The ultimate capital preservation tool. This indicator calculates mathematically secure stop-loss placements based on real-time market volatility (ATR) and features a dynamic dashboard that tells you the exact position size to take to protect your account. The Edge Amateurs blow accounts by guessing their lot sizes and placing arbitrary stop-losses. This tool professionalizes your risk. By adjusting your position size relative to the asset's current volatility, it ensures that whether you are trading a quiet forex pair or a volatile crypto asset, your monetary risk remains an exact, controlled percentage of your capital. Key Features: Volatility-Based Stops: Automatically calculates stop-loss levels using the Average True Range (ATR), ensuring your stop is safely tucked behind the market's natural "noise" to prevent early liquidations. Auto-Position Sizing: Input your account balance and risk tolerance (e.g., 1%), and the built-in dashboard instantly outputs the exact number of shares or units you should buy. On-Chart Visual Guardrails: Optionally plots dynamic crosshair lines on the chart so you can visually see exactly where your mathematically optimized stop-loss should be placed before entering a trade. How to Use Apply the indicator and open the settings menu. Enter your total account balance and your strict risk percentage (1-2% is highly recommended). When your Level 3 Momentum Trigger fires an entry signal, look at the Risk Manager dashboard in the corner of your screen. Execute the trade using the exact "Position Size (Units)" displayed on the dashboard, and immediately set your hard stop-loss at the "Stop Distance" mapped out on the chart. Author's Note This is a premium, Invite-Only script. It is Level 4 of the SkaleHub Training System. To gain access, your TradingView username must be explicitly authorized through the SkaleHub Academy.Chỉ báocủa SkaleHub4
Xander Scalping Strategy [Price Action + Confirmation]🚀 Xander Scalping Strategy by @wijayanto_ok A multi-confirmation scalping strategy combining trend filtering, dynamic support/resistance, Stochastic RSI momentum, and volume confirmation — with visual Risk/Reward estimation for disciplined trading. ================================================================================ 📌 OVERVIEW ================================================================================ Xander Scalping Strategy is a Price Action-based trading tool designed for traders who prioritize high-probability, multi-layer confirmation before entry. It helps identify: ✅ Trend Direction using EMA 13/21 crossover ✅ Dynamic Support & Resistance from confirmed swing highs/lows ✅ Precision Entry Signals via Stochastic RSI + Volume spike confirmation ✅ Visual Risk/Reward Estimator for smarter position management 🎯 Best For: Timeframes 5m – 1H | Liquid assets (Forex majors, BTC/ETH, Indices) ================================================================================ ✨ KEY FEATURES ================================================================================ 🔹 1. Trend Filter (EMA 13/21) --------------------------------- • Fast EMA (13) & Slow EMA (21) with dynamic coloring: 🟢 Green = Uptrend | 🔴 Red = Downtrend | ⚪ Gray = Sideways • Real-time trend label in top-right corner for quick reference 🔹 2. Dynamic Support & Resistance --------------------------------- • Auto-detects Swing High/Low using ta.pivothigh() / ta.pivotlow() • Horizontal S/R lines extended to the right (real-time visualization) • Updates automatically when new swings are confirmed ⚠️ Note: 1-candle lag for pivot confirmation = non-repainting logic 🔹 3. Multi-Layer Entry Confirmation --------------------------------- Component | Settings | Purpose -------------------|---------------------------------------|--------------------------- Stochastic RSI | RSI Len: 14, %K: 3, %D: 3, OB: 80, OS: 20 | Momentum timing & reversal signals Volume Filter | Avg Volume (20-period) | Filters low-liquidity false signals Price Action | Pullback to EMA zone OR bounce/reject at S/R | Confirms structural alignment ✅ BUY Signal Conditions: 1. Uptrend (EMA 13 > EMA 21) 2. Price pulls back to EMA zone OR bounces from Support 3. StochRSI crosses UP from Oversold (<20) 4. Volume > 20-period average → Green "BUY" arrow appears below candle ✅ SELL Signal Conditions: 1. Downtrend (EMA 13 < EMA 21) 2. Price pulls back to EMA zone OR rejects from Resistance 3. StochRSI crosses DOWN from Overbought (>80) 4. Volume > 20-period average → Red "SELL" arrow appears above candle 🔹 4. Visual Risk/Reward Table (Top-Right) --------------------------------- Metric | Description ----------|-------------------------------------------------- Status | Current trend or active signal (LONG/SHORT/UPTREND/DOWNTREND) Est. RR | Estimated Risk:Reward ratio based on latest swing levels 💡 Tip: Use RR ≥ 1:1.5 as an additional filter for higher-quality entries. 🔹 5. Alert System --------------------------------- • 🔔 "Xander Buy Signal" — Triggered when all BUY conditions met • 🔔 "Xander Sell Signal" — Triggered when all SELL conditions met • Compatible with TradingView alerts (popup, email, webhook, SMS) ================================================================================ ⚙️ HOW TO USE ================================================================================ 🔧 Setup: 1. Apply script to chart with timeframe 5m, 15m, or 1H 2. Recommended assets: • Forex: EURUSD, GBPUSD, USDJPY • Crypto: BTCUSDT, ETHUSDT • Indices: US30, NAS100, SPX500 🎯 LONG Entry Setup: 1. Confirm "UPTREND 🟢" label is visible 2. Wait for pullback to EMA 13-21 zone OR bounce from green Support line 3. Confirm: Green BUY arrow appears + candle closes bullish 4. StochRSI: Crosses up from <20 zone 5. Volume: Bar higher than 20-period average 📍 Stop Loss: Below nearest lastSwingLow 🎯 Take Profit: Nearest lastSwingHigh OR RR target ≥1:1.5 🎯 SHORT Entry Setup: 1. Confirm "DOWNTREND 🔴" label is visible 2. Wait for pullback to EMA 13-21 zone OR rejection from red Resistance line 3. Confirm: Red SELL arrow appears + candle closes bearish 4. StochRSI: Crosses down from >80 zone 5. Volume: Bar higher than 20-period average 📍 Stop Loss: Above nearest lastSwingHigh 🎯 Take Profit: Nearest lastSwingLow OR RR target ≥1:1.5 ⚠️ Recommended Filters: ❌ Avoid trading when label shows "SIDEWAYS ⚪" ❌ Skip signals with Est. RR < 1:1 ❌ Avoid entries 5 min before/after high-impact news events ✅ Always confirm with candlestick patterns (pinbar, engulfing, etc.) ================================================================================ 🔍 TECHNICAL NOTES (Advanced Users) ================================================================================ 📐 Pivot Detection (Non-Repainting): ph = ta.pivothigh(high, lookbackPeriod, lookbackPeriod) pl = ta.pivotlow(low, lookbackPeriod, lookbackPeriod) • Requires rightBars = lookbackPeriod for confirmation → NO REPAINTING • New swing confirmed only after N candles close to the right • Recommended: lookbackPeriod = 50 for significant swings; 20-30 for responsive signals 📊 Stochastic RSI Calculation: rsiSource = ta.rsi(close, 14) stoch = (rsiSource - lowestRSI) / (highestRSI - lowestRSI) * 100 %K = ta.sma(stoch, 3), %D = ta.sma(%K, 3) • Measures relative momentum within 0–100 range • Crosses at extremes (20/80) offer high-probability reversal signals 📈 Risk/Reward Estimation: // For BUY: risk = close - lastSwingLow reward = lastSwingHigh - close RR = reward / risk • Uses latest confirmed swing levels as reference for SL/TP ⚠️ Estimates only — always adjust to real-time market structure ================================================================================ ⚠️ DISCLAIMER & RISK WARNING ================================================================================ 🚨 IMPORTANT: This script is an analytical tool only. It does NOT guarantee profits or replace sound trading judgment. 1. Backtest First: Test in demo mode for 2–4 weeks before live trading. 2. No Holy Grail: No strategy wins 100%. Manage expectations and use strict money management. 3. Market Conditions: Performs best in trending markets. May underperform in extreme sideways or news-driven volatility. 4. Non-Repainting: Signals appear only after candle close and pivot confirmation. Minor 1-candle lag on swing detection is intentional for reliability. 5. Always Use Stop Loss: Never trade without predefined risk protection. 🔹 Trading forex, crypto, and derivatives carries substantial risk of loss. Trade only with capital you can afford to lose. ================================================================================ 🔄 VERSION HISTORY ================================================================================ Version | Date | Changes --------|------------|-------------------------------------------------- 1.0 | May 2026 | Initial release: EMA + S/R + StochRSI + Volume + RR Table ================================================================================ 💬 FEEDBACK & SUPPORT ================================================================================ • 🛠 Found a bug? Report with screenshot + timeframe + asset for faster resolution. • 💡 Have an improvement idea? Comment below or DM @wijayanto_ok. • 🌟 Enjoying the script? A like/follow helps support future updates! "Plan your trade, trade your plan. Consistency > Perfection." — Xander Scalping Philosophy ================================================================================ 🔖 TAGS (For Search Optimization) ================================================================================ scalping, price-action, ema, support-resistance, stochastic-rsi, volume, risk-reward, swing-trading, confirmation, non-repainting, tradingview, pine-script ================================================================================ ✅ PRE-PUBLISH CHECKLIST ================================================================================ Tested on 3+ assets & timeframes All inputs have sensible defaults Code is well-commented & structured Risk disclaimer included Alert conditions defined No unwanted repainting logic Documentation complete & professional ================================================================================ 🙏 Thank you for using Xander Scalping Strategy! Happy trading, and may your RR always be in your favor. 🎯📈 ================================================================================Chỉ báocủa wijayanto_ok28
NQ Rounded Levels Full + ATR Displayall NQ levels plus large ATR to see, its easy to add lines with 10-20-30-50-60-70-80-90 increments Chỉ báocủa jonukas20195
CREA DOM v.1.0A right-anchored Depth of Market ladder for the current pane, showing 10 price levels above and 10 below the current price. Bid and ask volume are estimated from bar data (buy/sell volume proxy) and displayed as horizontal bars growing outward from the centre price column — bids to the left in cyan, asks to the right in red. The current price row is always highlighted. Volume numbers are shown on each side, level spacing is ATR-derived and snapped to the instrument's tick size, and a bid/ask imbalance indicator is displayed at the bottom. Font sizes for row labels, the current price, and the header are independently configurable from the settings panel. Note: True Level 2 data requires a broker-integrated feed or a premium TradingView plan with DOM access. This indicator synthesises depth from bar volume using exponential decay — it reflects directional pressure, not real order book data.Chỉ báocủa ionutz666bzz39
P/E Based Earnings SignalsP/E Based Earnings Signals This script is an event-driven indicator that evaluates earnings releases through a valuation and share-structure lens. Instead of focusing only on price action, it uses reported earnings data, estimated earnings data, and shares outstanding to identify conditions that may be relevant after an earnings update. The main idea is to filter earnings events using simple but specific fundamental rules, then display signals only when those conditions are met. Concept: Many earnings-based tools focus only on whether a company beat or missed expectations. This script takes a more structured approach by combining: • Actual earnings-based P/E • Estimated earnings-based P/E • Share structure stability over time The goal is to identify earnings events where valuation conditions and dilution stability align with the signal logic. How It Works The script requests: • Actual EPS from earnings data • Estimated EPS from earnings data • Total shares outstanding from financial data It then calculates: • Actual P/E = Price / Actual EPS • Estimated P/E = Price / Estimated EPS Signals are only evaluated on bars where a new earnings value is detected. Buy Signal Logic A buy signal requires all of the following: • A new earnings event is detected • Actual P/E is above the selected buy threshold • Actual P/E is greater than estimated P/E • Shares outstanding have remained relatively stable over the selected lookback period This is intended to isolate higher-P/E earnings events while excluding names with major recent changes in share structure. Sell Signal Logic A sell signal requires all of the following: • A new earnings event is detected • Actual P/E is below the selected sell threshold • Estimated P/E is at or above the selected expected threshold • Shares outstanding have remained relatively stable over the selected lookback period This is intended to flag lower-P/E earnings conditions under a separate valuation filter. Share Structure Filter One part of the script is dedicated to filtering out companies with large recent changes in shares outstanding. It compares current shares outstanding to a historical reference point over a configurable number of days and calculates the percentage change. If the change exceeds the selected threshold, signals are blocked. This helps reduce noise from companies with unstable share structures or significant dilution. Visual Features • Buy labels below price when buy conditions are met • Sell labels above price when sell conditions are met • Earnings bars highlighted in the background • Summary table showing current P/E values, share change, and signal status Dashboard Metrics The built-in table displays: • Reported P/E • Estimated P/E • 1-year share change percentage • Current buy status • Current sell status This makes it easier to understand why a signal did or did not trigger. Use Cases This tool may be useful for: • Earnings-focused traders • Fundamental event screening • Combining valuation filters with chart review • Monitoring companies with more stable share structures Notes This script is a rules-based earnings filter, not a complete investment model. It is best used alongside: • Fundamental research • Price action review • Broader context around the earnings report • Risk management Because financial data can vary by symbol and reporting availability, users should verify that the required data fields are supported for the instrument being analyzed.Chỉ báocủa ZenOutMan17
Candle Delta Pro (Body + Wick - Stable) This indicator use to get quick idea of any stock range. Chỉ báocủa pinakin84Cập nhật 19
Gold Fair Value (IDR per Gram)Gold Fair Value (IDR per Gram) This indicator calculates the theoretical fair value of gold in Indonesian Rupiah per gram based on the global gold price and the USD/IDR exchange rate. The calculation follows a simple market conversion: Global gold prices are quoted in USD per troy ounce, while local gold prices in Indonesia are typically quoted in IDR per gram. Since 1 troy ounce equals 31.1035 grams, the indicator converts the global gold price into grams and then multiplies it by the current USD/IDR exchange rate. Formula used: Gold Price per Gram (IDR) = (XAUUSD ÷ 31.1035) × USDIDR Where: XAUUSD = Global gold price in USD per troy ounce 31.1035 = grams in one troy ounce USDIDR = USD to Indonesian Rupiah exchange rate The indicator displays: • A line showing the estimated fair value of gold per gram in IDR • A table summarizing the current gold price, exchange rate, and calculated fair value This value represents the theoretical spot price of gold if converted directly from the global market. Keep in mind that retail gold prices in Indonesia may differ due to: minting and fabrication costs distribution and dealer margins brand premium (Antam, UBS, etc.) buyback spreads Therefore, the calculated price should be interpreted as a reference baseline rather than the exact retail price. Traders and investors can use this indicator to quickly compare the global gold market value with local gold prices, helping identify whether gold is relatively expensive or cheap in the domestic market.Chỉ báocủa rahmadsaleh863
Trade TrackerThis indicator is a lightweight trade P/L monitor that takes a manual entry price, direction (long/short), position size, and a configurable dollar value per point/tick. It computes real-time profit/loss by comparing the current close to the entry price, converting the move into points and then dollars based on your size and tick value. On the last bar, it draws an entry line at the specified price and renders a stacked label at that level showing Buy/Sell, size, dollar P/L (green/red), and the point P/L. It continuously deletes and redraws the line/labels to keep the chart clean, and it also plots the entry price so the value is visible in the data window and price scale. Chỉ báocủa gggoaaat13
P/E Ratio (TTM)This indicator plots the trailing P/E ratio (TTM) using GAAP EPS (TTM) sourced directly from TradingView’s fundamental data. It includes valuation‑zone color coding, yearly labels, and a clean, compressed visual layout suitable for most equities. The goal is to provide a fast, intuitive view of how expensive or cheap a stock is relative to its historical earnings power. Note: The indicator caps P/E values around 120 for visual clarity. Negative P/E ratios are intentionally excluded, since P/E is undefined when EPS is negative. You can adjust the cap or remove it entirely if you prefer a full‑range view. This tool is especially useful for identifying periods when a company is trading at historically elevated or discounted valuation levels.Chỉ báocủa followmytradingjournal106
P/E, EPS, Price & Price-to-Sales DisplayThis indicator displays key fundamental valuation metrics for the selected stock. It shows: Earnings Per Share (EPS) Price-to-Earnings (P/E) ratio Calculated theoretical price based on P/E × EPS Price-to-Sales (P/S) ratio These values help traders quickly assess valuation without switching to separate financial panels. 🛠 Instructions for Use Add the indicator to your chart. Click on the three dots (⋯) next to the indicator name. Select Move to → New pane above. Minimize the indicator pane to display only the numerical values. Hide the plotted lines if you want a clean, numbers-only view. This setup allows you to monitor fundamental metrics efficiently without cluttering the price chart.Chỉ báocủa namovenkatashiva11161
PEG RSI [Auto EPS Growth]The PEG RSI is a hybrid indicator that combines fundamental valuation with technical momentum. It applies the Relative Strength Index (RSI) directly to the Price/Earnings-to-Growth (PEG) Ratio. Unlike traditional PEG indicators that require manual input for growth rates, this script automatically calculates the Compound Annual Growth Rate (CAGR) of Earnings Per Share (EPS) based on historical data. Key Features - Auto-Calculated Growth: Uses historical TTM Earnings Per Share (EPS) to calculate the CAGR over a user-defined period (Default: 4 years). - Dynamic Valuation: Converts the static PEG ratio into an oscillator (RSI) to identify relative valuation extremes. - Trend & Momentum: Visualizes the momentum of the PEG ratio relative to its own history. Educational Case Study This indicator is designed for educational purposes and research. Instead of relying on fixed overbought or oversold levels, users are encouraged to study the correlation between the PEG RSI and price action independently. - Observe how the price reacts when the PEG RSI reaches upper or lower extremes. - Different stocks may respect different RSI zones based on their growth stability. - Use this tool to analyze how market valuation momentum shifts over time. Settings: - Years for CAGR Growth: Timeframe to calculate EPS growth (Default: 4 years). - RSI Length: Lookback period for the RSI calculation (Default: 14). Note: This indicator works best on stocks with a consistent history of earnings. It requires financial data to function (will not work on assets without EPS like Crypto or Forex).Chỉ báocủa waranyutrkm20
PE Fair ValueIn short, it’s an automated fair value estimator based on the price-to-earnings model, with full manual control if TradingView’s fundamental data is missing. Summary: 1. Lets the user choose the EPS source – either automatically from TradingView fundamentals (EPS TTM) or a manual value. 2. Attempts to fetch the stock’s P/E ratio (TTM) automatically; if unavailable, it uses a manual fallback P/E. 3. Calculates: Actual P/E = current price ÷ EPS Fair Value = EPS × chosen (auto/manual) P/E Percentage difference between market price and fair value 4. Plots the fair-value line on the chart for visual comparison. 5. Displays a table in the top-right corner showing: EPS used Target P/E Actual P/E Fair value Current price Difference vs fair value (colored green or red) 6. Creates alerts when the stock is trading above or below the calculated fair value. 7. Also plots the current closing price for reference. Chỉ báocủa joakimandersson7803Cập nhật 47
Quarterly EarningsThis Pine script shows quarterly EPS, Sales, and P/E (TTM-based) in a styled table.Chỉ báocủa Avinaash46
PE Rating by The Noiseless TraderPE Rating by The Noiseless Trader This script analyzes a symbol’s Price-to-Earnings (P/E) ratio, using Diluted EPS (TTM) fundamentals directly from TradingView. The script calculates the Price-to-Earnings ratio (P/E) using Diluted EPS (TTM) fundamentals. It then identifies: PE High → the highest valuation point over a 3-year historical range. PE Low → the lowest valuation point over a 3-year historical range. PE Median → the midpoint between the two extremes, offering a fair-value benchmark. PE (Int) → an additional intermediate low to track more recent undervaluation points. This is calculated based on lowest valuation point over a 1-year historical range These levels are plotted directly on the chart as horizontal references, with markers showing the exact bars/dates when the extremes occurred. Candles corresponding to those days are also highlighted for context. Bars corresponding to these extremes are highlighted (red = PE High, green = PE Low). How it helps Provides a historical valuation framework that complements technical analysis. We look for long opportunity or base formation near the PE Low and be cautious when stocks tends to trade near High PE. We do not short the stock at High PE infact be cautious with long trades. Helps identify whether current price action is happening near overvalued or undervalued zones. Adds a long-term perspective to support swing trading and investing decisions. If a stock is coming from Low PE to Median PE and along with that if we get entry based on Classical strategies like Darvas Box, or HH-HL based on Dow Theory. Offers a simple visual map of how far the market has moved from “cheap” to “expensive.” This tool is best suited for long-term investors and swing traders who want to merge fundamentals with technical setups. This indicator is designed as an educational tool to illustrate how valuation metrics (like earnings multiples) can be viewed alongside price action, helping traders connect fundamental context with technical execution in real market conditions.Chỉ báocủa kaushikakiwatkarCập nhật 1414173
EPS+Sales+Net Profit+MCap+Sector & Industry📄 Full Description This script displays a comprehensive financial data panel directly on your TradingView chart, helping long-term investors and swing traders make informed decisions based on fundamental trends. It consolidates key financial metrics and business classification data into a single, visually clear table. 🔍 Key Features: 🧾 Financial Metrics (Auto-Fetched via request.financial): EPS (Earnings Per Share) – Displayed with trend direction (QoQ or YoY). Sales / Revenue – In ₹ Crores (for Indian stocks), trend change also included. Net Profit – Also in ₹ Crores, along with percentage change. Market Cap – Automatically calculated using outstanding shares × price, shown in ₹ Cr. Free Float Market Cap – Based on float shares × price, also in ₹ Cr. 🏷️ Sector & Industry Info: Automatically identifies and displays the Sector and Industry of the stock using syminfo.sector and syminfo.industry. Displayed inline with metrics, making it easy to know what business the stock belongs to. 📊 Table View: Compact and responsive table shown on your chart. Columns: Date | EPS | QoQ | Sales | QoQ | Net Profit | QoQ | Metrics Metrics column dynamically shows: Market Cap Free Float Sector (Row 4) Industry (Row 5) 🌗 Appearance: Supports Dark Mode and Mini Mode toggle. You can also customize: Number of data points (last 4+ quarters or years) Table position and size 🎯 Use Case: This script is ideal for: Fundamental-focused traders who use EPS/Sales trends to identify momentum. Swing traders who combine price action with fundamental tailwinds. Portfolio builders who want to see sector/industry alignment quickly. It works best with fundamentally sound stocks where earnings and profitability are a major factor in price movements. ✅ Important Notes: Script uses request.financial which only works with supported symbols (mostly stocks). Market Cap and Free Float are calculated in ₹ Crores. All financial values are rounded and formatted for readability (e.g., 1,234 Cr). 🙏 Credits: Developed and published by Sameer Thorappa Built with a clean, minimalist approach for high readability and functionality. Chỉ báocủa sameer_thorappaCập nhật 22155
Metatrader CalculatorThe “ Metatrader Calculator ” indicator calculates the position size, risk, and potential gain of a trade, taking into account the account balance, risk percentage, entry price, stop loss price, and risk/reward ratio. It supports the XAUUSD, XAGUSD, and BTCUSD pairs, automatically calculating the position size (in lots) based on these parameters. The calculation is displayed in a table on the chart, showing the lot size, loss in dollars, and potential gain based on the defined risk.Chỉ báocủa legiozCập nhật 11362
The Strat with Continuity [starlord_xrp]This indicator shows entry and exit points for The Strat as well as potential setups. It also has full time frame continuity detection. Chỉ báocủa starlord_xrp11301
Financial GrowthThis indicator will acquire the financial data provided by Tradview. the data is compare between Quarter, Annual and TTM in term of percent of growth. YoY, QoQ and CAGR is also available by this script (The minimum is 4). in addition, ploting of data, label and table also available (you can check the mark to toggle on / off). Data : Revenue, Net Income, EBITDA, EPS, DVPS, Free Cash Flow and Forward PE . How to use it. just select the financial data, period and size of data to compare. you can check the box to toggle the plotting line, label and table. Enjoy. Chỉ báocủa morzor61Cập nhật 6565 1.3 K
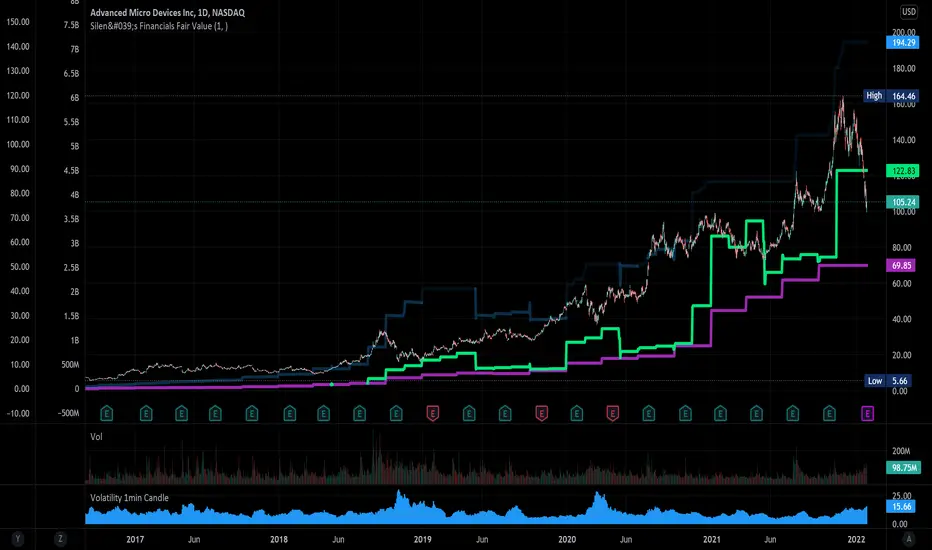
Silen's Financials Fair ValueIt is finally here! 🔥 My 3rd and most important script in my Financial series! 🚀 Ever imagined to see all fundamentals (or many that is) combined into one indicator that is right on your chart, showing you how your favorite stock is trading compared to its fundamentals? Well, here is your answer! 📡 ____________________________________________________________________________________________ This script shows you my own personal interpretation of fair value, based solely on the financial fundamentals of a company compared to market averages. I don't believe that certain sectors of the market should be priced higher than others. If you look at historical data you'll see that favored sectors always rotate - placing insanely high P/E multiples on some sectors. Once they are "out" and people rotate away from those sectors you're left with nothing but the naked fundamentals that matter. So, you'll see many companies, that have been doing well on paper, see their share price decline by 70-90% for no other reasons than people favoring other sectors. That's why it's even more important to focus on fair value that is solely fundamentals-based. Know when your stock gets to expensive. 🤯 ____________________________________________________________________________________________ To give you some examples: - Most Megacaps trade at historically high valuations, several times my fair value. Those include AAPL, MSFT, NVDA, AMZN, TSLA, JPM, TSM, V and so on. And no, in the past they partially traded below (my) fair value. - Most Cybersecurity / Cloud companies are trading at truly massive multiples of my fair value. (NET, DDOG, etc) - Many Smallcaps & Midcaps are trading several multiples (OESX, CODX, QFIN) below my fair value. And no, in the past they partially traded above (my) fair value. Ok, so much about the market. You ultimately decide how much you want to orientate on fair value. 👨🏫 ____________________________________________________________________________________________ This fair value indicator (purple line): Takes the P/E rate of the company and compares it to the market (50% weight) Takes the P/S rate of the company and compares it to the market (50% weight) Then adds boni and mali f or debt/equity rates and debt and equity itself Also looks at past growth and calculates future P/E and P/S rates which adds , in some cases, value to the fair value (green line) Also compares how historical valuations have behaved compared to fair value and simulates a fair value guideline (dark blue line) ____________________________________________________________________________________________ This script is part 3️⃣ of a series of indicators that work well together. Script 1️⃣ of the series is: P/E & P/S Rates Script 2️⃣ of the series is: Debt & Equity If you use all 3 scripts together it will look like this, giving you truly deep and simple information about the fundamentals of a company: Example 1 - AMD Example 2 - HZO Example 3 - APPS I hope this script makes your investing and stock picks a lot easier! 🔆💹🕗 Disclaimer: Fair value is always subjective. There are many different approaches to fair value. This one is only my personal interpretation. Disclaimer 2: This script works only for the Day-Timeframe. Disclaimer 3: This script uses 17,5 P/E and 3,0 P/S as market averages. The actual average keeps changing but, historically speaking, these seemed to be good numbers. Feel free to share your thoughts and feedback! 🙃 Chỉ báocủa The_Silen1818540
FX Profit CalculatorWith this indicator, you will be able to see how much you earn in forex in dollar terms. It asks you 3 things when adding the indicator. TP point SL point Position Entry point If you have selected the TP point above, the entry zone below it, and the SL point below it, the indicator will automatically understand that there is a BUY order and will make the calculations accordingly. The same is true for the opposite. When you use the indicator in any parity, you will have problems switching to other parities. So either use it only in one parity, or update your targets from the indicator settings at every parity change. You will get the same error if: Your trading entry point should be between your TP and SL points. If you do not set it this way, the indicator will warn that please fix it. If you are in the trade, tick the settings and show the dollar-based profit of your position according to the instant closing price. The percentage variable works like this: When you adjust for one parity, shifts occur in the chart when you switch to the other parity. When switching to non-circulating graphics at the same prices, the user is prompted to re-enter so that the graphic does not deteriorate. BONUS : You can move these lines up and down with your mouse on the graphic :) Chỉ báocủa only_fibonacciCập nhật 55693
Price and EarningsPrice, Earnings and PE ratio are indexed to 100 % at the desired date.Chỉ báocủa sidhakir77421
Silen's Financials Debt & EquityThis Script shows Debt (red) & Equity (green), as well as Total Equity and Net Income in a preformatted way for a symbol. Total revenue's and Net income's visibility is turned off by default and can be activated in the indicator settings. 🍳 Disclaimer: Any content in this script can be completely replicated by using Tradingview's Build-In Financial Indicators: Total debt, Total equity, Net income and Total revenue. It requires a lot of formatting work to get them to this state though. 👌 However, you are going to need 4 Financial Indicators clogging 🚽 your screen. With this indicator you have them preformatted as an overlay on your chart so you know exactly what's going on with your ticker's financials. 💰 I recommend only using Debt & Equity OR Total Equity & Net Income together. Although displaying all 4 indicators together is possible, it will make your chart quite messy. This is how the indicator looks like for Total equity and Net Income: This Script (2) is part of a Series that will contain 3 scripts to help you easily evaluate if a stock is trading in harmony with its fundamentals or not. ☯ Script 1 already exists: Script 3 will be a Fair Value Indicator. 📣 Script 1 and 2 combined will look like this: 🌄 If you have any questions, let me know! 🙂Chỉ báocủa The_Silen111190