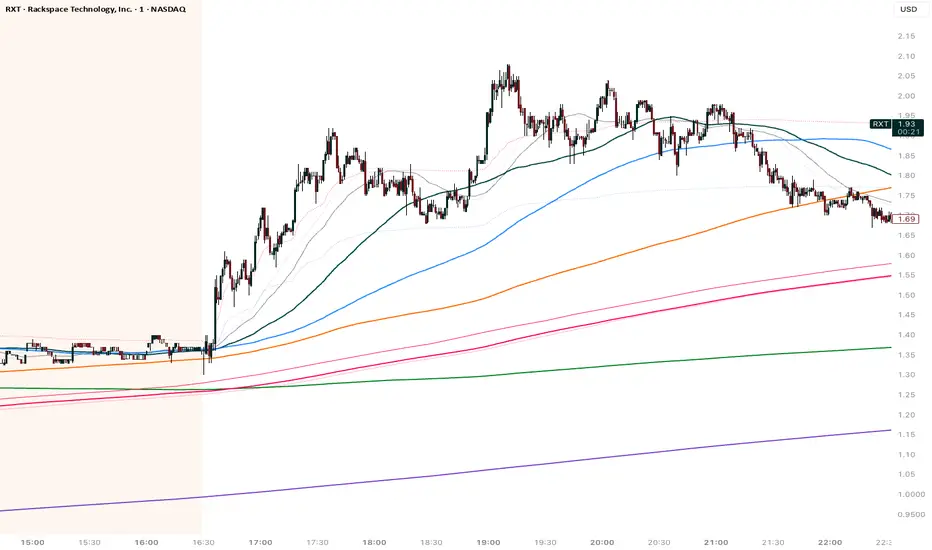
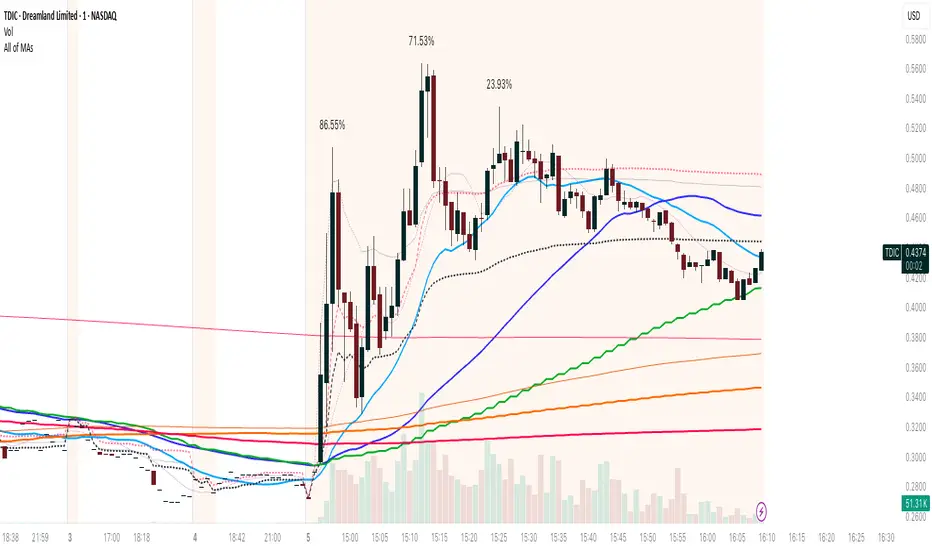
Moving Averages (10, 21, 50, 200)Moving Averages including 10, 21, 50 and 200 period. Intended mainly for use on a daily chart, but will work for any period.Chỉ báocủa RobertoDTCập nhật 6
MA Strength Indicator EnhancedThe "MA Strength" is an indicator that measures market trend strength or (in the case of forex pairs) the relative strength of individual currencies based on up to five different moving averages (MA). It offers multiple calculation methods, such as simple summation, normalized value, or measuring ATR/percentage distance from the price. The results are summarized in a clear table, and it provides customizable alerts for trend changes or shifts in currency strength. The high level of configurability (e.g., MA weighting, "all MA alignment" requirement) allows for fine-tuning the strategy. 💬 Interpreting the Table (Top Rows) The top row of the table shows the final output of the indicator. This changes according to the set "Table Mode". Trend Mode: The top row shows the final, aggregated trend status (e.g., "BULLISH", "NEUTRAL") and the corresponding "Trend Value". This is the value the indicator compares to its thresholds. Forex Mode: (Only on 6-character pairs): The top two rows show the strength of the Base currency and the Quote currency separately. Calculation of the top rows: The indicator calculates the individual score of all active MAs (according to the chosen method). Trend Value: This is the final value calculated from the scores. If "Enable Averaging" is ON, this will be the average of the scores (e.g., MA1 score is 5.0, MA2 score is 7.0 -> Trend Value is 6.0). If averaging is OFF, this will be the sum of the scores (e.g., 5.0 + 7.0 = 12.0). Forex Calculation: "Forex Mode" uses this "Trend Value". If the Trend Value is +6.0 (on an EURUSD pair): The Base currency (EUR) value will be +6.0. The Quote currency (USD) value will be -6.0. The indicator compares these values to the thresholds to determine the "STRONG" status for EUR and "WEAK" status for USD. 📊 Calculation Methods The indicator can calculate trend strength using 5 methods. The final "Trend Value" is derived from the results of these calculations. Sum: Description: Simply adds up the individual scores of all enabled moving averages (MA). Formula: If the price is above an MA, it gets the "Score Above" value (e.g., +2.0); if below, it gets the "Score Below" value (e.g., -2.0). Example: Result = (MA1 score) + (MA2 score) + ... Normalized: Description: Takes the sum obtained by the "Sum" method and converts it to a scale between -100% (maximally bearish) and +100% (maximally bullish). It takes into account the maximum possible positive and negative scores. Formula: Result = (Total Score / Max Possible Score) * 100 Percentage Distance: Description: This method also considers distance. The further the price is from the MA in percentage terms, the higher the score. Formula: MA Score = (|Close Price - MA| / MA * 100) * Weight (The "Weight" is the "Score Above/Below" value set in settings). ATR Distance: Description: Similar to percentage distance, but normalizes the distance using volatility via ATR (Average True Range). Formula: MA Score = (|Close Price - MA| / ATR) * Weight Candle Count: Description: Counts how many consecutive candles have been above or below the MA. It multiplies this number by the set weight. Formula: MA Score = (Number of consecutive candles) * Weight ⚙️ Settings Options Moving Averages (MA 1-5) For each moving average, you can set: Enable MA: Turn the specific MA on or off. Type: The type of moving average (SMA, EMA, WMA, etc.). Period: The period of the MA (e.g., 50, 200). Score Above / Below: The most important setting. This defines the "weight" of the MA in the calculation. In "Sum" mode, this is a fixed score; in distance-based modes, this is a multiplier (weight). It is advisable to write a positive number for "Score Above" and a negative number for "Score Below". Calculation Settings Enable Averaging: If this is on, the indicator shows the average of the active MA scores, not the total score. Exception: This function is not available in "Normalized" mode. Require All MA Alignment: This is a strict filter. If enabled, the indicator only gives a "BULLISH" (or "STRONG") signal if the price is above all enabled moving averages. Similarly, a "BEARISH" signal only occurs if the price is below all moving averages. If the price is on the opposite side of even just one MA (e.g., above 4, below 1), the status becomes "NEUTRAL", regardless of the scores. Strength / Trend Thresholds Enable Extra Levels: If active, statuses are expanded: "EXT. BULLISH" / "EXT. BEARISH" (Trend mode) or "EXT. STRONG" / "EXT. WEAK" (Forex mode). This indicates stronger, overbought/oversold conditions. Threshold setting: The thresholds (e.g., "Strong Above - ATR") determine when the calculated value counts as a "STRONG" or "WEAK" status. 🔢 Setting Thresholds via Calculation If "Enable Averaging" is OFF, the "Trend Value" shown in the table will be the sum of the individual MA scores. Therefore, we must define the threshold by adding up the minimum expected performance from each moving average. This allows us to set different expectations for short, medium, and long-term averages. Step 1: Determine MA weights In our example, we use 3 active MAs with the following weights (Score Above values): MA1 (Short): Weight = +2 MA2 (Medium): Weight = +3 MA3 (Long): Weight = +4 Step 2: Determine the minimum expected distance Define a minimum distance expected from each MA to trigger a "Strong" signal. Step 3: Calculate target scores and the final threshold Note: If "Enable Averaging" is ON, the resulting value (sum of target scores) must be averaged to get the final threshold. Example 1: ATR Distance -Goal: I want a "Strong" signal if the price is... ...at least 1.0 ATR above MA1 (Short), ...at least 1.5 ATR above MA2 (Medium), ...and at least 2.0 ATR above MA3 (Long). -Calculation (Expected Distance * Weight): MA1 Target Score: 1.0 * 2 = 2.0 MA2 Target Score: 1.5 * 3 = 4.5 MA3 Target Score: 2.0 * 4 = 8.0 -Final Threshold (Sum of Target Scores): 2.0 + 4.5 + 8.0 = 14.5 -Setting: Set "Strong Above - ATR" threshold to 14.5. If "Enable Averaging" is ON, the obtained value must be averaged, and the result will be the threshold: 4.8 (14.5 / 3 = 4.83). Example 2: Percentage Distance -Goal: I want a "Strong" signal if the price is... ...at least 0.5% above MA1, ...at least 1.0% above MA2, ...and at least 1.5% above MA3. -Calculation (Expected Distance * Weight): MA1 Target Score: 0.5 * 2.0 = 1.0 MA2 Target Score: 1.0 * 3.0 = 3.0 MA3 Target Score: 1.5 * 4.0 = 6.0 -Final Threshold (Sum): 1.0 + 3.0 + 6.0 = 10.0 -Setting: Set "Strong Above - Percentage" threshold to 10.0. If "Enable Averaging" is ON, the obtained value must be averaged, and the result will be the threshold. Example 3: Candle Count -Goal: I want a "Strong" signal if... ...at least 3 consecutive candles are above MA1, ...at least 5 consecutive candles are above MA2, ...and at least 10 consecutive candles are above MA3. -Calculation (Expected Candle Count * Weight): MA1 Target Score: 3 * 2.0 = 6.0 MA2 Target Score: 5 * 3.0 = 15.0 MA3 Target Score: 10 * 4.0 = 40.0 -Final Threshold (Sum): 6.0 + 15.0 + 40.0 = 61.0 -Setting: Set "Strong Above - Candle" threshold to 61.0. If "Enable Averaging" is ON, the obtained value must be averaged, and the result will be the threshold. Example 4: Sum In this mode, distance does not matter, only whether the price is above or below the MA. -Goal: "Strong" signal if the price is above the long-term averages, but can be below the short-term (MA1). MA1 (Short): Can be below (Weight: -2.0) MA2 (Medium): Must be above (Weight: +3.0) MA3 (Long): Must be above (Weight: +4.0) -Calculation: -2.0 + 3.0 + 4.0 = 5.0 -Setting: Set "Strong Above - Sum" threshold to 5.0. If it must be above all three moving averages, the threshold would be 2.0 + 3.0 + 4.0 = 9.0. If "Enable Averaging" is ON, the obtained value must be averaged, and the result will be the threshold. Example 5: Normalized The basic logic is similar to the "Sum" method. -Goal: "Strong" signal if price is above MA2 and MA3, but potentially below MA1. -Calculation: Target Sum: 5.0. Max Possible Score (above all): 9.0. -Threshold: (5.0 / 9.0) * 100 = 55.5 In this calculation method, averaging cannot be set. The Usage of the "ATR %" Row The "ATR %" row shows the percentage movement of an average candle. How to use this with "Percentage Distance" mode: This number gives a baseline. It helps decide if the "Percentage Distance" threshold is realistic. Example: You see the "ATR %" value is hovering around 1.2%. This means a "normal" candle moves about 1.2%. If you set the Percentage threshold to 0.5%, it is too low. The indicator will constantly give a "Strong" signal because even average movement (noise) exceeds the threshold. Correct Usage: If "normal" movement is 1.2%, then a "strong" movement (trend) needs to be significantly larger. For example, set the threshold to double the ATR %: 2.4 (2 * 1.2). Thus, you only get a "Strong" signal if the movement is twice the average volatility. Supplementary Information Rounding Differences: The numbers displayed in the table and the precision of calculations in the background differ. Table Display: The indicator rounds numbers to two decimal places in the table. So, if the value is 0.996, the table shows 1.00 (rounded up). Internal Calculation: The background calculation uses much higher precision. When determining status (STRONG vs NEUTRAL), the program compares the precise, unrounded value to the threshold. Result: Due to rounding, it may happen that if the threshold is 1.00 and the table shows 1.00, the status flickers between Strong and Neutral. If this is bothersome, it is advisable to set a slightly lower threshold (e.g., 0.98). 🔔 Alert Settings The indicator can send alerts when the status changes. Alert Method: Trend: Alerts when the main trend status changes (e.g., from "NEUTRAL" to "BULLISH"). You can specify which direction to alert for (e.g., only "BULLISH"). Forex: Works only on 6-character forex pairs. You can set separate alerts for the Base or Quote currency. Forex Strength Level: You can specify at which status level to alert (e.g., "WEAK" or "EXT. STRONG"). 📈 Trading Tips Trend Confirmation: Use the "BULLISH" / "BEARISH" status to confirm your existing strategy (e.g., breakouts, bounces off support). Forex Pairing: In Forex mode, look for pairs where the Base currency is "STRONG" and the Quote currency is "WEAK" (or "EXT. STRONG" / "EXT. WEAK") for a long position. Short Position: Reverse the above (Base: WEAK, Quote: STRONG).Chỉ báocủa nzsolti18Cập nhật 3328
SMA AreaSMA indicator modified to show as Area instead of plain indicating if this is under water or above water Chỉ báocủa PandaChaser1
Mebane Faber GTAA 5In 2007, Mebane Faber published research that challenged the conventional wisdom of buy-and-hold investing. His paper, titled "A Quantitative Approach to Tactical Asset Allocation" and published in the Journal of Wealth Management, demonstrated that a simple timing mechanism could reduce portfolio volatility and drawdowns while maintaining competitive returns (Faber, 2007). This indicator implements his Global Tactical Asset Allocation strategy, known as GTAA5, following the original methodology. The core insight of Faber's research stems from a century of market data. By analyzing asset class performance from 1901 onwards, Faber found that a ten-month simple moving average served as an effective trend filter across major asset classes. When an asset trades above its ten-month moving average, it tends to continue its upward trajectory; when it falls below, significant drawdowns often follow (Faber, 2007, pp. 12-16). This observation aligns with momentum research by Jegadeesh and Titman (1993), who documented that intermediate-term momentum persists across equity markets. The GTAA5 strategy allocates capital equally across five diversified asset classes: domestic equities (SPY), international developed markets (EFA), aggregate bonds (AGG), commodities (DBC), and real estate investment trusts (VNQ). Each asset receives a twenty percent allocation when trading above its ten-month moving average. When an asset falls below this threshold, its allocation moves to short-term treasury bills (SHY), creating a dynamic cash position that scales with market risk (Cambria Investment Management, 2013). The strategy's historical performance during market crises illustrates its function. During the 2008 financial crisis, traditional sixty-forty portfolios experienced drawdowns exceeding forty percent. The GTAA5 strategy limited losses to approximately twelve percent by reducing equity exposure as prices declined below their moving averages (Faber, 2013). This asymmetric return profile represents the strategy's primary characteristic. This implementation uses monthly closing prices retrieved via request.security() to calculate the ten-month simple moving average. This distinction matters, as approximations using daily data (such as a 200-day moving average) can generate different signals during volatile periods. Monthly data ensures the indicator produces signals consistent with published academic research. The indicator provides position monitoring, automatic rebalancing detection on either the first or last trading day of each month, and share calculations based on user-defined capital. A dashboard displays current trend status for each asset class, target versus actual weightings, and trade instructions for rebalancing. Performance metrics including annualized volatility and Sharpe ratio provide ongoing risk assessment. Several limitations warrant acknowledgment. First, the strategy rebalances monthly, meaning it cannot respond to intra-month market crashes. Second, transaction costs and taxes from monthly rebalancing may reduce net returns for taxable accounts. Third, the ten-month lookback period, while historically robust, offers no guarantee of future effectiveness. As Ilmanen (2011) notes in "Expected Returns", all timing strategies face the risk of regime change, where historical relationships break down. This indicator serves educational purposes and portfolio monitoring. It does not constitute financial advice. References: Cambria Investment Management (2013). Global Tactical Asset Allocation: An Introduction to the Approach. Research Report, Los Angeles. Faber, M.T. (2007). A Quantitative Approach to Tactical Asset Allocation. Journal of Wealth Management, Spring 2007, pp. 9-79. Faber, M.T. (2013). Global Asset Allocation: A Survey of the World's Top Asset Allocation Strategies. Cambria Investment Management, Los Angeles. Ilmanen, A. (2011). Expected Returns: An Investor's Guide to Harvesting Market Rewards. John Wiley and Sons, Chichester. Jegadeesh, N. and Titman, S. (1993). Returns to Buying Winners and Selling Losers: Implications for Stock Market Efficiency. Journal of Finance, 48(1), pp. 65-91.Chỉ báocủa EdgeTools55
2t's MA 50, MA 150, ATRThis indicator displays three key technical signals on the chart: SMA 50 – Short-term trend direction SMA 150 – Medium-term trend direction ATR – Market volatility (Average True Range) Line colors and lengths can be customized in the settings. The ATR is plotted on the same chart for quick volatility reference without needing a separate panel. This tool is designed for traders who want a clean, lightweight view of trend strength and volatility in a single indicator.Chỉ báocủa matan2tCập nhật 5
paigep.llc - SuperMASuperMA is a multi-layered moving-average and candle-coloring system that combines SMA, EMA, and optional HMA logic to help traders visualize trend shifts, pullbacks, and momentum changes in a clean, structured way. The script includes multiple modules: trend-based moving averages, pullback signals, exit logic, and an optional HMA cross engine. 📌 Core Features 1. Full SMA + EMA Framework The indicator plots multiple moving averages (8, 9, 13, 20, 50, 200) using both SMA and EMA calculations. Each line automatically colors bullish or bearish based on its relationship to the 200-period baseline.Users can toggle SMAs and EMAs independently for clearer chart control. 2. Main Trend Entry & Exit Logic (8×200 and 8×20) Built-in crossover logic detects: Main Entry: SMA 8 crossing above/below EMA 200 Main Exit: SMA 8 and SMA 20 cross (with an option to choose which SMA is treated as the “fast” leg) A “first exit only” option allows the script to ignore additional exit signals until a new trend regime begins. 3. Pullback Module (20 SMA Interaction) Pullback entries and exits occur when price crosses the 20 SMA during existing trend conditions. This includes: Pullback entries through the 20 SMA Pullback exits back across the 20 SMA Labels and candle colors are available for all pullback events. 4. Optional HMA Cross Module A separate module allows traders to use two Hull Moving Averages (HMA) with customizable: Lengths Independent timeframes Line colors Cross-based entries and exits This module has its own events, labels, and optional candle coloring. 5. Advanced Candle Coloring System Candle coloring is layered in priority order, based on: Main trend entries Main exits HMA entries HMA exits Pullback entries Pullback exits Trend-only candles (based on SMA 8 relative to EMA 200) Users may also independently color wicks and borders. 6. Configurable Alerts (Fully Decoupled from Visuals) Alerts are available for all major events, including: Main Entries (8×200) Main Exits (8×20) Pullback Entries and Exits HMA Entries and Exits Bull or Bear Trend candles Any colored candle event Alerts can fire on bar close only or intrabar, depending on user preference. 📌 Use Cases SuperMA helps traders visualize: Trend direction using SMA/EMA structure Momentum shifts through HMA crosses Pullback zones around the 20 SMA Early regime transitions based on the 8×200 relationship Candle-level context through color-coded bars The indicator works across all markets and timeframes. ⚠️ Note This tool is for visual and analytical assistance only. It does not guarantee future performance and should be combined with additional analysis and risk management.Chỉ báocủa paigepllc51
paigep.llc - SuperMA SuperMA is a multi-layered moving-average and candle-coloring system that combines SMA, EMA, and optional HMA logic to help traders visualize trend shifts, pullbacks, and momentum changes in a clean, structured way. The script includes multiple modules: trend-based moving averages, pullback signals, exit logic, and an optional HMA cross engine. 📌 Core Features 1. Full SMA + EMA Framework The indicator plots multiple moving averages (8, 9, 13, 20, 50, 200) using both SMA and EMA calculations. Each line automatically colors bullish or bearish based on its relationship to the 200-period baseline. Users can toggle SMAs and EMAs independently for clearer chart control. 2. Main Trend Entry & Exit Logic (8×200 and 8×20) Built-in crossover logic detects: Main Entry: SMA 8 crossing above/below EMA 200 Main Exit: SMA 8 and SMA 20 cross (with an option to choose which SMA is treated as the “fast” leg) A “first exit only” option allows the script to ignore additional exit signals until a new trend regime begins. 3. Pullback Module (20 SMA Interaction) Pullback entries and exits occur when price crosses the 20 SMA during existing trend conditions. This includes: Pullback entries through the 20 SMA Pullback exits back across the 20 SMA Labels and candle colors are available for all pullback events. 4. Optional HMA Cross Module A separate module allows traders to use two Hull Moving Averages (HMA) with customizable: Lengths Independent timeframes Line colors Cross-based entries and exits This module has its own events, labels, and optional candle coloring. 5. Advanced Candle Coloring System Candle coloring is layered in priority order, based on: Main trend entries Main exits HMA entries HMA exits Pullback entries Pullback exits Trend-only candles (based on SMA 8 relative to EMA 200) Users may also independently color wicks and borders. 6. Configurable Alerts (Fully Decoupled from Visuals) Alerts are available for all major events, including: Main Entries (8×200) Main Exits (8×20) Pullback Entries and Exits HMA Entries and Exits Bull or Bear Trend candles Any colored candle event Alerts can fire on bar close only or intrabar, depending on user preference. Use Cases SuperMA helps traders visualize: Trend direction using SMA/EMA structure Momentum shifts through HMA crosses Pullback zones around the 20 SMA Early regime transitions based on the 8×200 relationship Candle-level context through color-coded bars The indicator works across all markets and timeframes. ⚠️ Note This tool is for visual and analytical assistance only. It does not guarantee future performance and should be combined with additional analysis and risk management.Chỉ báocủa paigepllc1128
Multi MAThis TradingView indicator displays four customizable moving averages on your price chart: two Exponential Moving Averages (EMAs) and two Simple Moving Averages (SMAs). The default settings show a 10-period EMA (aqua), 21-period EMA (orange), 50-period SMA (green), and 200-period SMA (red), which are commonly used timeframes for trend analysis. Each moving average can be individually toggled on or off, and their lengths and colors are fully adjustable through the indicator settings. The EMAs react more quickly to price changes while the SMAs provide smoother, more gradual trend indicators, making this useful for identifying support/resistance levels and trend direction. Traders often watch for crossovers between these moving averages as potential entry or exit signals, with the 50/200 SMA cross being particularly significant as the "golden cross" or "death cross."Chỉ báocủa OneMorningStar15
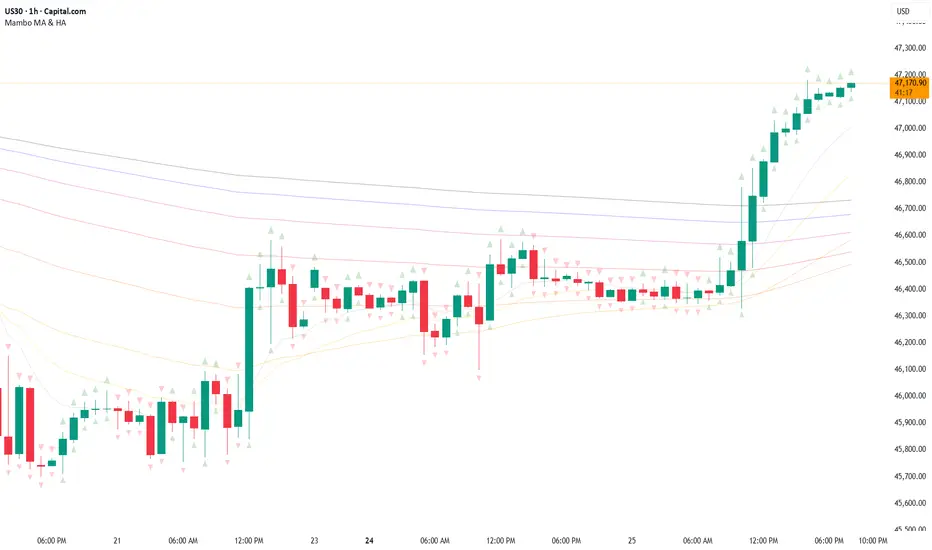
Mambo MA & HAMambo MA & HA is a combined trend-view indicator that overlays Heikin Ashi direction markers and up to eight customizable moving averages on any chart. The goal is to give a clear, uncluttered visual summary of short-term and long-term trend direction using both regular chart data and Heikin Ashi structure. This indicator displays: Heikin Ashi (HA) directional markers on the chart timeframe Optional Heikin Ashi markers from a second, higher timeframe Up to eight different moving averages (SMA, EMA, SMMA/RMA, WMA, VWMA) Adjustable colors and transparency for visual layering Offset controls for HA markers to prevent overlap with price candles It is designed for visual clarity without altering the underlying price candles. Heikin Ashi Direction Markers (Chart Timeframe) The indicator generates HA OHLC values internally and compares the HA open and close: Green (bullish) HA candle → triangle-up marker plotted above the bar Red (bearish) HA candle → triangle-down marker plotted above the bar The triangles use soft pastel colors for minimal obstruction: Up marker: light green (rgb 204, 232, 204) Down marker: light red (rgb 255, 204, 204) The “HA Offset (chart TF ticks)” input lets users shift the triangle vertically in price terms to avoid overlapping the real candles or MAs. Heikin Ashi Markers from a Second Timeframe An optional second timeframe (default: 60m) shows additional HA direction: Green HA (higher timeframe) → tiny triangle-up below the bar Red HA (higher timeframe) → tiny triangle-down below the bar This allows a trader to see higher-timeframe HA structure without switching charts. The offset for the second timeframe is independent (“HA Offset (extra TF ticks)”). Custom Moving Averages (Up to Eight) The indicator includes eight individually configurable MAs, each with: On/off visibility toggle MA type SMA EMA SMMA / RMA WMA VWMA Source Length Color (with preset 70% transparency for visual stacking) The default MA lengths are: 10, 20, 50, 100, 150, 200, 250, 300. All MA colors are slightly transparent by design to avoid obscuring price bars and HA markers. Purpose of the Indicator This tool provides a simple combined view of: Immediate trend direction (chart-TF HA markers) Higher-timeframe HA trend bias (extra-TF markers) Overall moving-average structure from short to very long periods It is particularly useful for: Monitoring trend continuation vs. reversal Confirming entries with multi-TF Heikin Ashi direction Identifying pullbacks relative to layered moving averages Viewing trend context without switching timeframes There are no signals, alerts, or strategy components. It is strictly a visual trend-context tool. Key Features Summary Two-timeframe Heikin Ashi direction Separate offsets for HA markers Eight fully configurable MAs Clean color scheme with low opacity Non-intrusive overlays Compatible with all markets and chart typesChỉ báocủa alejandroscotti5
3 EMA Crossover (Text Color Customizable) - Fixed3 Ema crossover 9/15/21 it will generate buy and sell signal on crossover.Chỉ báocủa reyuu1nu25
MACD Divergence auto displayed on chart, with alertsMACD Pivot Divergence Detector This tool identifies MACD histogram divergences based on confirmed pivot highs and lows. Instead of comparing swing points on the MACD line, this script focuses specifically on the histogram, which measures momentum shifts between MACD and Signal. How it works The script detects confirmed pivots using a two-bar swing structure. When price breaks above a previous pivot high, the script compares the MACD histogram value at that pivot to the current histogram value: • If price makes a higher high while the histogram makes a lower high, a potential bearish divergence is marked. The reverse logic is applied for bullish divergence when price breaks below a pivot low. What makes this script unique It uses pivot-confirmed histogram values, not lookback-based divergence. It evaluates divergence only at actual highs/lows, reducing false positives. It marks divergence directly on the candles for visual clarity. Alert conditions are included for automated detection. How to use Bullish signals may highlight potential momentum loss in downtrends; bearish signals may highlight momentum loss near highs. Divergence does not guarantee reversal and should be combined with broader context, structure, or trend analysis.Chỉ báocủa affxsup9
Simple Moving Averages (5, 10, 20, 60, 120, 200SMA for different time frames. Covers 5, 10, 20, 60, 120, 200 sma unitsChỉ báocủa letsgiritCập nhật 13
200SMA Distance OscillatorThe oscillator measures the percentage deviation of closing price x from SMA200. The idea behind the oscillator was preceded by an analysis of how often MAs in the index hold/bounce or are broken through. Basically, the idea was about index analysis, i.e., the macro picture of a market. Who wants to buy individual stocks when the overall market is plummeting ;-) Or in other words: How long are you long in a market? When is it time to take profits? After the analysis of the stability of SMAs in the index was rather modest (ratio of just under 6:4 for bounce to breakout – overall in 20, 50, 100, and 200 frames from 2020 to 2025), it was noticeable that the percentage over- or underperformance was scalable, especially in indices. And since indices generally move upwards, there were fixed limits for over- and underestimations – especially in the longer term (SMA200) – unlike with individual stocks. It is therefore more a question of macro trends and less of short-term movements, e.g., in day trading. It was now interesting to see at what percentage range counter-movements were likely – particularly in the positive range for profit-taking, but of course also in the negative range for entry into sold-off markets. If, for example, closing prices around +25% above SMA200 were reached in the NDX, the probability is very high that the market has overreacted and an interim correction will follow – so the theory goes. On the other hand, continuous levels of +5 to +10% are a product of healthy positive development in a bull market and do not necessarily require action. The oscillator was specifically designed for the NDX, but can also be used for the SPX and others. The style was based on the RSI, so that the color level rises from 10% to 20% (overbought/oversold principle). Based on manually examined movements, the criteria were set as follows: +/-10% = flow / no color background > +/-10% = border areas / color background The center line represents the 252 average of the percentage deviations and could also be used as a trigger, provided it has been historically examined and is valid. The oscillator is very interesting because it behaves completely differently from one financial instrument to another and, as a result, also in the timeframes (4h, D, W). It would probably make sense to change the flow and border levels in the code when using it outside of indices. The fact is that the oscillator must be “adjusted” to each instrument in order to achieve its goal of providing the best possible prediction. “Adjusting” refers to the analysis of the levels at which an instrument/asset usually reacts. As with all indicators and oscillators, it is advisable to take other indicators and, in particular, macro news into account when analyzing this development. If I find any substantial correlations with other indicators, I will be happy to provide an update. The idea came from me, the code from Grok. The code is not 100% perfect, but the data (percentage deviation, color background) is correct according to initial analysis. In the settings, you can make the lines of the plots invisible. This makes the oscillator clearer. You can also adjust the settings for the average line. Chỉ báocủa MajorTom11119
4-Line RibbonRibbon for 20, 50, 100, 200 EMA/ SMA. 2 colour areas for bullish or bearish. 3 shade gradient between the different MA's.Chỉ báocủa moonstronaught9
Vortex Pro with Moving average [point algo]Vortex Pro with MA Dropdown is an enhanced version of the classic Vortex Indicator (VI), designed to help visualize directional strength by comparing positive and negative trend movement. This version includes a smoothed “Vortex Pro” line, adjustable moving-average filtering, and dynamic zone coloring for improved readability. How It Works: The script calculates VI+ and VI− using directional movement and true range. “Vortex Pro” is derived from the difference between VI+ and VI−, scaled for clarity. A customizable moving average (EMA, SMA, HMA, WMA) is applied to help smooth volatility and highlight shifts in momentum. Features : • Vortex Pro Line A scaled trend-strength line showing when positive movement is dominating or weakening. • MA Type Dropdown Choose between EMA, SMA, HMA, or WMA to smooth the Vortex Pro line. • Zero-Line Structure A plotted zero line is used to compare positive vs. negative strength visually. • Dynamic Fill Zones Green shading when the Vortex Pro line is above zero, red when below. Usage: This tool is designed for visual analysis of trend direction and momentum strength. It does not generate buy/sell signals and should be used as part of a broader analysis approach. Suitable for all timeframes and markets.Chỉ báocủa pointalgoCập nhật 96
SMC Lite + PVSRA + MA Combo HELL 1great trading tool what you see is what you get supply and resistance pvsra candles Chỉ báocủa gman4210
SMA 50 DerivativeThis approach uses calculus concepts: First Derivative (slope): Rate of change of the SMA → ta.change(sma50) Second Derivative (acceleration): Rate of change of the slope → ta.change(smaSlope) 1. First Derivative (smaSlope) Measures: The instantaneous rate of change between the current bar and previous bar Formula: sma50 - sma50 Interpretation: > 0 = SMA is rising (uptrend) < 0 = SMA is falling (downtrend) = 0 = SMA is flat 2. Second Derivative (smaAcceleration) Measures: How the slope itself is changing Formula: smaSlope - smaSlope = (sma50 - sma50 ) - (sma50 - sma50 ) Interpretation: > 0 = Slope is increasing (trend is accelerating) < 0 = Slope is decreasing (trend is decelerating) = 0 = Slope is constant **For scalping, very short-term signals**Chỉ báocủa najitradCập nhật 30
Daily MA — Higher-Timeframe Daily Moving Average OverlayThis indicator plots a clean, higher-timeframe daily moving average directly on any chart, so you can always see where price sits relative to the daily trend — even while trading on lower timeframes (1m, 5m, etc.). It’s designed to be: Simple – a single, configurable daily MA line Consistent – always anchored to the 1D timeframe Flexible – choose EMA or SMA and customize line width/color ⸻ What This Indicator Does Pulls the 1-Day (1D) moving average of the current symbol, regardless of your chart timeframe. Lets you choose between EMA (Exponential Moving Average) or SMA (Simple Moving Average). Plots that daily MA as a smooth overlay on your current chart. Keeps the line visually clean and continuous, making it easy to see daily trend and dynamic support/resistance. This is not a signals/strategy script. It doesn’t generate buy/sell arrows or backtest logic. It’s a context tool for visualizing the daily trend while you execute your own strategy. ⸻ Why a Daily MA Overlay Is Useful Traders commonly use a daily moving average to: Anchor intraday trades to the higher-timeframe trend Longs when price is holding above the Daily MA Shorts or caution when price is rejecting from the Daily MA Identify dynamic support/resistance Price often reacts around well-watched daily MAs (e.g., 50, 100, 200) Filter setups Only take long setups when price is above the daily trend line Avoid counter-trend trades when price is extended far from the Daily MA Because this script forces the MA to always be computed on 1D, you don’t have to switch back and forth between intraday and daily charts to keep track of the bigger picture. ⸻ Inputs & Settings MA Length Default: 200 Any positive integer (min 1) Common examples: 50, 100, 200 for trend structure MA Type EMA – reacts faster to recent price (default) SMA – smoother, slower, more “classic” feel Line Width Default: 2 Range: 1 to 10 Increase if you want the Daily MA to stand out clearly against other indicators Color Default: Purple tone Fully customizable – pick any color that works with your chart theme ⸻ How to Use It in Your Workflow Intraday traders (scalpers/day-traders): Apply the indicator to your 1m/5m/15m charts. Use the Daily MA as a trend filter : Only look for long scalps when price is above the Daily MA. Be more cautious with longs or consider shorts when price is below it. Swing traders : Use it on 1H/4H charts to see where price sits relative to a longer-term daily trend. Watch for: Pullbacks to the Daily MA in an uptrend as potential demand zones. Rejections at the Daily MA in a downtrend as potential supply zones. Risk management & context : Avoid chasing extended moves far from the Daily MA. Mark confluence with other tools (support/resistance, volume profile, etc.) around the Daily MA. ⸻ Notes & Limitations The moving average itself is calculated from daily candles , then displayed on your current timeframe. This is a visual aid only . It does not guarantee future performance or provide financial advice. Always combine this indicator with your own analysis, risk management, and trading plan. ⸻ Disclaimer : This script is provided for educational and informational purposes only. It is not financial advice and does not constitute a recommendation to buy or sell any financial instrument. Always do your own research and trade at your own risk.Chỉ báocủa zazenioCập nhật 21
PSAR with ATR Trailing Stop + SMA Filter📈 Strategy Overview: PSAR + 6×ATR Trailing Stop with SMA Filter This strategy is built around the principle of “Cut the losers, let the winners run” — a disciplined, trend-following approach that combines the Parabolic SAR indicator with dynamic risk management and a Simple Moving Average (SMA) trend filter. 🔍 Strategy Logic Trend Filter Trades are only taken in the direction of the prevailing trend, defined by a user-selected SMA (default: 100). ✅ Long trades only when price is above the SMA ✅ Short trades only when price is below the SMA Entry Signal: A trade is triggered when the Parabolic SAR flips to the opposite side of the price bars, signaling a potential trend reversal. Stop Loss: The stop loss is dynamically set at 6×ATR from the entry price. This adapts to market volatility and is recalculated every bar — effectively acting as a trailing stop. Exit Logic: There is no fixed take profit. The trade remains open until the trailing stop is hit — allowing winners to run and losers to be cut quickly. Risk Management: Each trade risks 0.5% of total equity, ensuring consistent position sizing and capital preservation. 📊 Visual Elements PSAR dots mark trend direction changes SMA line shows the broader trend filter Trailing stop crosses (with 50% opacity) indicate the current stop level without cluttering the chart ⚙️ Customizable Inputs PSAR parameters: Start, Increment, Maximum ATR length and multiplier SMA length Risk percentage per trade This strategy is ideal for traders who want to stay aligned with the trend, automate disciplined exits, and avoid emotional decision-making. Clean, simple, and powerful. Wishing you calm and successful trades!Chiến lượccủa kostastrovas48
Close Below MAClose Below MA (SMA or EMA) This indicator helps traders quickly identify when a candle closes below a moving average — a classic signal of potential bearish momentum or a shift in trend. You can choose between Simple Moving Average (SMA) or Exponential Moving Average (EMA) from a convenient dropdown menu, and customize the MA length to fit your strategy. When a candle closes below the selected MA, a small black arrow appears above the bar, and an alert can be triggered for instant notifications. Features: Choose between SMA or EMA. Adjustable MA length. Visual signal (arrow) when the close is below the selected MA. Built-in alert support Usage Ideas: Spot early signs of a bearish reversal. Use alerts for automated trade monitoring. Chỉ báocủa VCPxTrader23
dO / wO / mO + MA 50/200 + PrevDay H/L Description This indicator plots key reference levels used by professional traders: Daily Open (dO) Weekly Open (wO) Monthly Open (mO) Previous Day High (pdH) and Previous Day Low (pdL) Moving Averages: 50 & 200 SMA Each level is drawn as a clean dotted white line with a fixed label directly on the price chart. All levels can be individually toggled on or off via checkboxes in the settings panel. The pdH/pdL lines start exactly from the candles that created them, providing clear structure for breakout, retracement, and liquidity analysis. The 50/200 SMA are included for long-term trend context. This tool is designed for traders who rely on multi-timeframe structure and precision levels for both intraday and swing strategies. Features Toggle visibility for dO, wO, mO, pdH, and pdL Accurate placement of previous day levels Lightweight and responsive Clean minimal visual design Supports any symbol and timeframe Usage Notes Perfect for confluence-based trading: Combine pdH/pdL with session opens to identify key liquidity zones Use SMA 50/200 for directional bias Works on crypto, forex, indices, and equitiesChỉ báocủa MartenBG18
Goldencross & Deathcross Highlights (50/200 SMA) - Fixed dailyThis indicator visualizes major long-term trend shifts in the market by tracking the daily 50-day and 200-day Simple Moving Averages (SMAs) — regardless of your current chart timeframe. 🟩 A green flash (Golden Cross) appears when the 50-day SMA crosses above the 200-day SMA — signaling potential long-term bullish momentum. 🟥 A red flash (Death Cross) appears when the 50-day SMA crosses below the 200-day SMA — suggesting potential long-term bearish pressure. Unlike typical SMA overlays, this script: • Pulls daily data directly (fixed to daily timeframe) • Works cleanly on any chart timeframe (5m, 1h, 4h, etc.) • Avoids clutter by hiding moving average lines • Shows only short, subtle flashes and one clean marker per event Chỉ báocủa KOPlacidusax29