7EMA_5MA with Next Openbased on storwize's EMA/SMA script. Added a forecasting for the where the EMAs/SMAs will be in the next bar assuming a close where it currently is.Chỉ báocủa Cavedrew70
OnTheMoveWith this plot one is able to compare the different % change in the given time frame. It calculates the sma of a given period (defval = 7) for the close/open. Strategy would be to choose (trade) from one to other asset in order to get higher rates when pumping or lower when dumping. The Symbol & exchange has to be specified. defSymbols = BTC, ETH and LINK defExchange = BINANCE Chỉ báocủa altovv18x17
Pi Cycle Bitcoin Top IndicatorThe script implements the Pi Cycle Top indicator This indicator identifies tops in the bitcoin market cycle. Historically, the Pi Cycle Top indicator has called out tops in the price of bitcoin within three days. The script is very easy to use and it is possible to change the following parameters: the time interval (default value is day); the days of long moving average (default value is 365) the days of short moving average (default value is 111) show the moving average plots show the Pi Cycle Top label highlighting the cross-point Chỉ báocủa NinorigoCập nhật 2222501
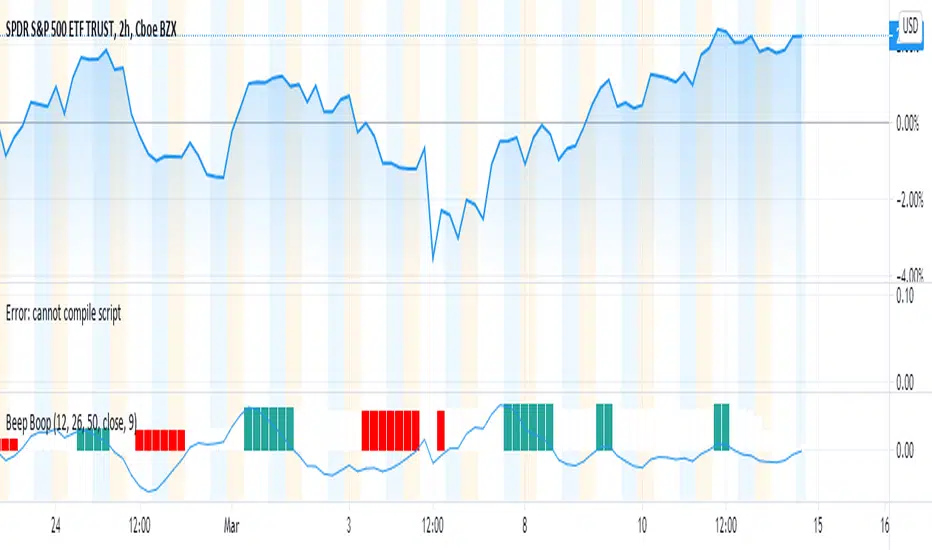
Beep Boop(Improved) Beep Boop Indicator for Trending Markets originally written by Trading Rush. It is originally based on the MACD 12-26 and the 50 bar EMA. The macd hist is color coded with green as buy and sell as red. I added an option to use a couple of lower lag ema's (See line 13 - ema_signal).Chỉ báocủa capamCập nhật 3030758
Crypto EMA+MA+MACS by hobbeLeThis is an indicator that includes several EMAs and MAs (Used in Cryptotrading). In addition, the Golden and Death Cross are also displayed. Used MAs MA 7 - Orange Line MA 21 - Yellow Line MA 25 - Grey Line MA 99 - Blue Line MA 200 - Green Line Used EMAs EMA 200 - Grey Dotted Line EMA 222 - Pink Dotted Line Golden Cross Crossover MA25 + MA200 Death Cross Crossunder MA25 + MA200 What is a Moving Average (MA) ? A moving average (MA) is a widely used indicator in technical analysis that helps smooth out price action by filtering out the “noise” from random short-term price fluctuations. Moving average is a trend-following, or lagging, indicator because it is based on past prices. The most common applications of moving averages are: to identify the trend direction to determine support and resistance levels The two basic and commonly used moving averages are the simple moving average ( SMA ), which is the arithmetic average of a security over a defined number of time periods, and the exponential moving average ( EMA ), which gives greater weight to more recent prices. What is a Golden Cross? The golden cross is a candlestick pattern that is a bullish signal in which a relatively short-term moving average crosses above a long-term moving average. The golden cross is a bullish breakout pattern formed from a crossover involving a security's short-term moving average (such as the 15-day moving average) breaking above its long-term moving average (such as the 50-day moving average) or resistance level. As long-term indicators carry more weight, the golden cross indicates a bull market on the horizon and is reinforced by high trading volumes. What Is a Death Cross? The death cross is a technical chart pattern indicating the potential for a major selloff. The death cross appears on a chart when a stock’s short-term moving average crosses below its long-term moving average. Source; Investopedia Chỉ báocủa hobbeLe33114
Candle Body SizePlot bar size compare to SMA 50 bars back 1. Big Bar Size can be used as Support resistent level. 2. Working fine for futures marketChỉ báocủa syamay66291
BTC and ETH Long strategy - version 2I wrote my first article in May 2020. See below BTC and ETH Long strategy - version1 After 6 months, it is now time to check the result of my script for the last 6 months. XBTUSD (4H): 14/05/2020 --> 22/11/2020 = +78% in 4 trades ETHXBT (4H): 14/05/2020 --> 22/11/2020 = +21% in 9 trades ETHUSD (4H): 14/05/2020 --> 22/11/2020 = +90% in 6 trades Using the signals from this strategy to trade manually has shown that this was a bit frustrating because of the low rate of winning trades. If you have to enter 100 trades and see 75% of them failing and 25% winning, this is frustrating. For sure the strategy makes good money but it is difficult to hold this mentality. So, I have reviewed and modified it to get a higher winning rate. After few days of work, tests and validation, I managed to get a wining rate close to 60%. The key element was also to decrease the number of trades by using a higher time frame. (4H candles instead of 2H candles). - Entry in position is based on MACD, EMA (20), SMA (100), SMA (200) moving up AND EMA (20) > SMA (100) AND SMA (100) > SMA (200) - Exit the position if: Stoploss is reached OR EMA (20) crossUnder SMA (100) The goal of this new script is to be able to follow the signals manually and only make few trades per years. I have also validated it against some other altcoins where some are giving very good results. Here are some results for 2020 (from 01/01/2020 until now (22/11/2020). Those results are the one I get when using 4H candles. ETH/USD: +144% in 8 trades. BTC/USD: +120% in 7 trades. ETH/BTC: +33% in 9 trades. ICX/USD: +123% in 10 trades. LINK/USD: +155% in 11 trades. MLN/USD: +388% in 8 trades. ADA/USD: +180% in 7 trades. LINK/BTC: +97% in 10 trades. The best is that above results are without considering compound effect. If you re-invest all gains done in each new trade, this will give you the below results :) ETH/USD: +189% in 8 trades. BTC/USD: +260% in 7 trades. ETH/BTC: +29% in 9 trades. ICX/USD: +112% in 10 trades. LINK/USD: +222% in 11 trades. MLN/USD: +793% in 8 trades. ADA/USD: +319% in 7 trades. LINK/BTC: +103% in 10 trades. As you can see, the results are good and the number of trades for 11 months is not big, which allows the trader to place orders manually. But still, I'm lazy :), so, I have also coded this strategy in HaasScript language which allows you to automate this strategy using the HaasOnline software specialized in automated crypto trading. I hope that this strategy will give you ideas or will be the starting point for your own strategy. Let me know if you need more details. Chiến lượccủa philipina1010572
MA+ADX+DMICOINBASE:BTCUSD BINANCE:BTCUSDT Use long and short moving average to look for a potential price in/out. (default as 14 and 7, bases on the history experience) ADX and DMI to prevent the small volatility and tangling MA. Test it in 4HR, "BINANCE:BTCUSDT" From 12/1/2017- 11/1/2020 (Mixed Bull/Bear market) Overall Profit: 560.89% From 1/1/2018 - 1/1/2019 (Bear market) Overall Profit: -2.19% From 4/1/2020 - 11/1/2020 (Bull Market) Overall Profit: 274.74% Any suggestion is welcome to discuss. Chỉ báocủa codachang07264482
Array SMACalcuating SMA on an Array In this script i show you how to calculate SMA on an array. Several values are plotted just for illustration. Steps to follow: - make sure you have an array with values (source array) - create a blank array (pref. with the same size) - call the function array_sma This function fills the empty array with the SMA values of the source array. Chỉ báocủa Wilson-IVCập nhật 121219
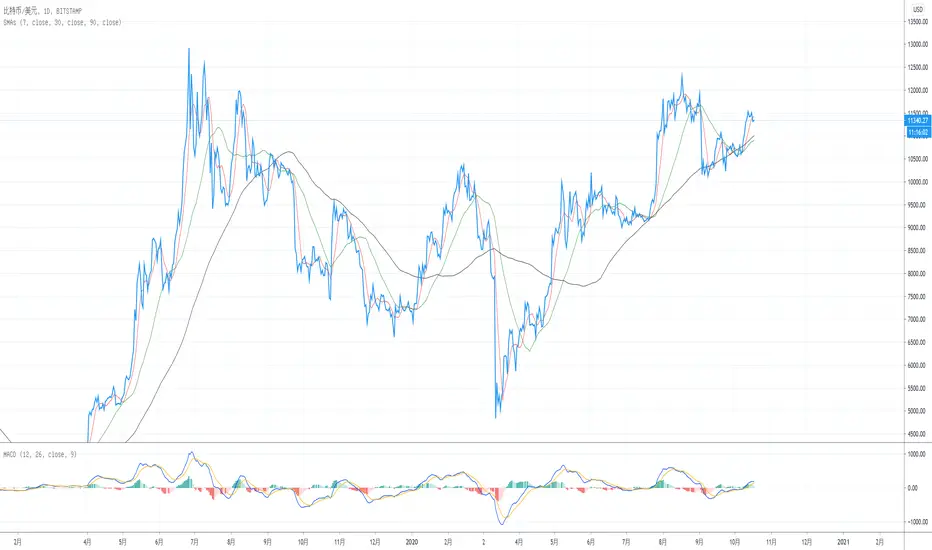
Easy Loot Golden CrossGolden/Death Cross Moving Average Indicator 30, 100 & 200 period Simple Moving Average (SMA). 30 = Yellow 100 = Green 200 = Black Black crosses mark the 'golden crosses' as well as the 'death crosses'. These black crosses appear when the 30 crosses the 100 & when the 100 crosses the 200. These black crosses don't tell you when to buy/sell, but simply indicate interest in the market. This code is open-source so feel free to add this indicator to your chart and play around with the different moving average timeframes & color schemes. Golden Cross The golden cross occurs when a short-term moving average crosses over a major long-term moving average to the upside and is interpreted by analysts and traders as signaling a definitive upward turn in a market. Basically, the short-term average trends up faster than the long-term average, until they cross. There are three stages to a golden cross: A downtrend that eventually ends as selling is depleted A second stage where the shorter moving average crosses up through the longer moving average Finally, the continuing uptrend, hopefully leading to higher prices Death Cross Conversely, a similar downside moving average crossover constitutes the death cross and is understood to signal a decisive downturn in a market. The death cross occurs when the short term average trends down and crosses the long-term average, basically going in the opposite direction of the golden cross. The death cross preceded the economic downturns in 1929, 1938, 1974, and 2008.Chỉ báocủa kyer66126
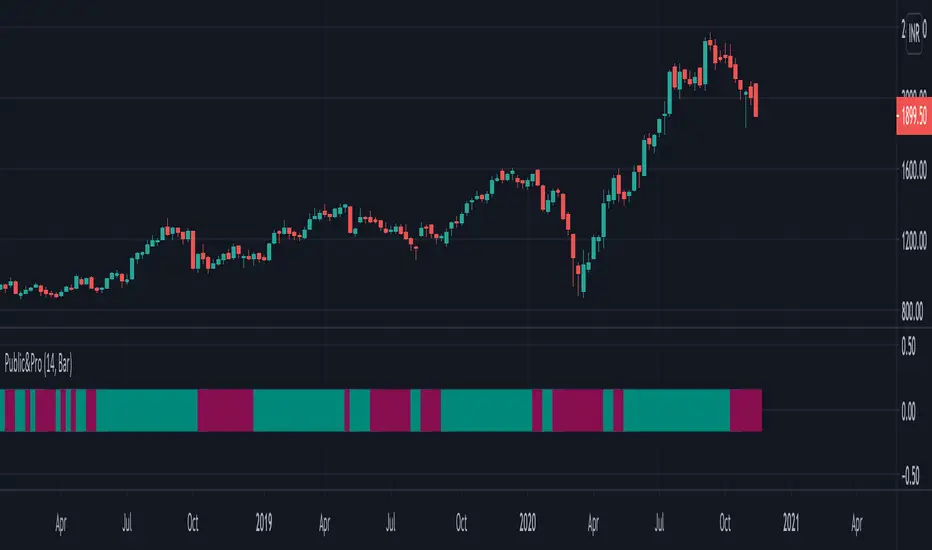
Public & Pro ActionBased on Larry Williams Pro-Go logic for public and pro actions. This indicator works on all timeframes. The public action is previous close to today's open. The pro action is today's close to today's open. The series is smoothened with a simple moving average. It works best after the candle is formed.Chỉ báocủa bharatTraderCập nhật 2121 1.1 K
Bollinger Band+ Multi EMA, SMAHello Everyone. I make Bollinger band , 3 ema and 3 sma combined. I think this indicator can use all timeframe. -------------------------------------------------------------- Indicator will show you 1. Trend follow 2. Pullback catch 2. Market bounce. 1. Trend Follow - Trend Follow for I used 3 terms. They are short, Mid and Long Trend. 2. Pullback Catch - EMA for Save, take care, alert Zones. - Mid Term Trend can be catch also. 3. Market Bounce - Bollinger Band will show you market re-bounce point. Final Notes Indicator will show Trend, Pullback, Market bounce and some support and resistant level. Chỉ báocủa pyaephyo931212947
Fib Cross Moving AveragesThe white line is the main 200-candle MA. The fibonacci ratio MAs are relative to that 200-day MA. Some lines change color based on the trend shown by this indicator. So 61.8% for example, the orange/red line golden ratio MA is a 124 candle MA (~68% of 200). There is also a weighted 124 candle MA that works along-side the 100 candle MA.Chỉ báocủa lysergik73
Pisani BandsThis indicator is based on Historical Volatility. It's plot the simple moving average with a upper and a lower band. The bands are calculated like this: UpperBand = 20 Simple moving average + 20% * Historical volatility LowerBand = 20 Simple moving average - 20% * Historical volatility But, you can change the paramters. I use the 200SMA with 100% of Historical Volatility either. How to use: If the price are negociating out of the bands, it's dangerous to trade this stock. Hope you like it.Chỉ báocủa HighVision33174
[Strategy] Simple Golden CrossSimple Golden Cross Strategy. Works best on a daily chart on "Blue Chip" cryptos such as BTC, ETH, and LTC. Entry Signal: -50 day moving average crosses over the 100 day moving average. Exit Signal: -50 day moving average crosses under the 100 day moving average. -Daily candle closes under the 100 day moving average (support). -100 day moving average crosses under the 200 day moving average.Chiến lượccủa CJDeegan79
Improved On balance volume with BB channel and double MAThis is an improved version of the on balance volume indicator. I made it inside a bollinger band channel, so we can define better the zones. At the same time I applied 2 moving averages on OBV, to get a better idea of the trend and at same time that change direction of the trend. Green - > uptrend - > we look for buy positions Red - > downtrend -> we look for sell positions. At the same time we have to be aware of crosses on bollinger bands, which can indicate a change in the trend .Chỉ báocủa SoftKill21168
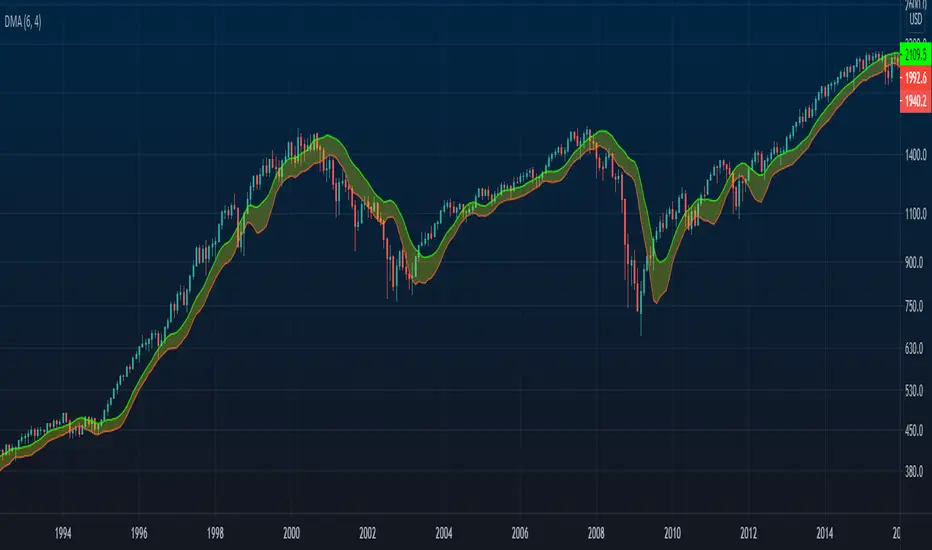
Displaced Moving Average Channel (DMA)What is This? The Displaced Moving Average Channel (DMA) indicator is a combination of two moving averages calculated on the high and low of a set time period back which are displaced forward or backward with the center highlighted as a central channel. What Information Can I Get Out of It? This indicator can be used as a support or resistance as some moving averages are typically used as well as a tiny measure of recent volatility by looking at the spread between the top and bottom moving averages. Where Did This Idea Come From? I did not come up with the concept of this indicator since I was inspired to use this as a setup/trigger indicator in a potential trading strategy as seen in this whitepaper . Chỉ báocủa jamiedubauskasCập nhật 11272
Golden & Death CrossThis indicator allows you to see Golden Cross and Death Cross. Each Sma line can be hidden. It is for educational purposes only. Enjoy it. Best Regards, Bilgin , Kaptanin Seyir Defteri Chỉ báocủa bilgintanyol112
Higher High / Lower Low StrategyThis is a very simple trend following strategy for Day Trading. The premise is to follow the Moving Average for the trend direction and buy/sell the dips and blips in the trend. 1. In an uptrend, when the candle action offers a "dip", or a lower high, the strategy will then buy on the close of the candle that breaks the high of the previous candle. 2. In a downtrend, when the candle action offers a"blip", or a higher low, the strategy will then sell on the close of the candle that breaks the low of the previous candle. 3. The strategy will go Long only or Short only, not both. It must be manually reversed in the settings when a new trend is established. 4. The start month and year allow you to backtest from then until now. It's not one month at a time. 5. The strategy uses a reversal of the Stochastic %K variable as the exist. The setting for Period K controls the exit for backtesting purposes. 6. The strategy uses a moving average to determine the trend. The setting for the Period MA controls the SMA. 7. The strategy has the option of filtering the number of trades based on the direction of the MACD and/or the Signal line. This can either reduce or increase the probability, and is highly dependent on the price action of the instrument. WARNING: I am not a licensed financial advisor. This script is intended for entertainment purposes only. I highly recommend you manually enter and exit positions per your own Trading Rules, and do not blindly follow any software or recommendation. Use of this script is elective and at your own discretion, and risk. If you like this script, please give it a Thumb's Up, and leave a comment. If you would like any custom scripts developed, contact me to discuss it. All of my work here is open and available, free of charge. It can be copied and edited to suit your needs.Chiến lượccủa FXEngineering11143
Ratio Between Two SymbolsThis scripts displays the ratio of any two symbols. The ratio is shown on a second chart. A multiplier may be added to the ratio, and moving average is calculated. Chỉ báocủa MalsenInvest2121 1.6 K
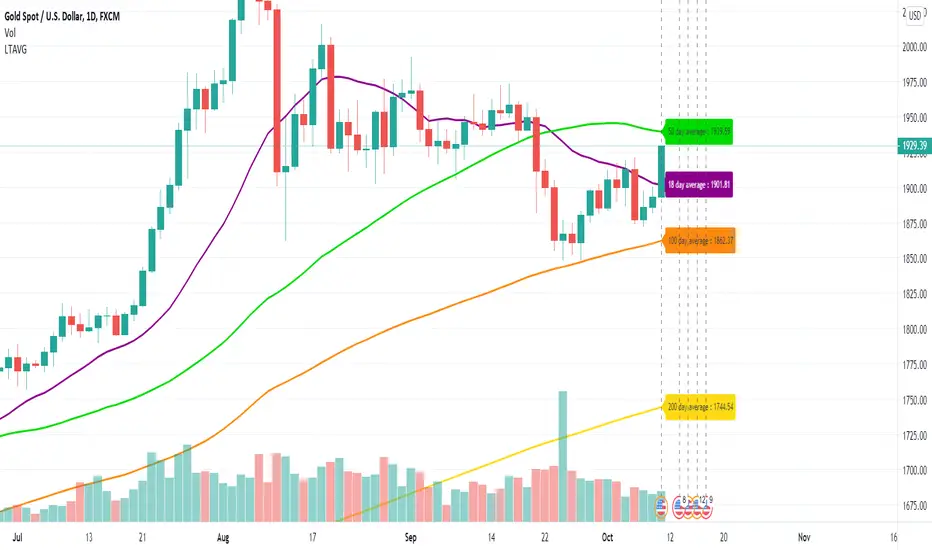
Long Term Moving AverageThis scripts plots the long term moving average calculated daily for 4 sets. The default averages are: 18 day 50 day 100 day 200 day The settings can be used to flexibly change this and to hide / show labelsChỉ báocủa MalsenInvest1195
Aligned Moving Average IndexMoving averages are considered as aligned when either all faster moving averages are placed above their next slower moving averages or all faster moving averages are placed below their next slower moving averages. In this script, we are considering moving averages of 5, 10, 20, 30, 50, 100 and 200. User can select different moving average types from input : sma, ema, hma, rma, vwma, wma. Moving average is considered as positively aligned when close > ma5 > ma10 > ma20 > ma30 > ma50 > ma100 > ma200 Moving average is considered as negatively aligned when close < ma5 < ma10 < ma20 < ma30 < ma50 < ma100 < ma200 Whenever there is positively aligned moving average, alignment value is considered as +1 and whenever there is negatively aligned moving average, alignment value is considered as -1. Aligned moving average index is sum of n periods of alignment value. We can optionally apply another moving average on this index to see the overall direction. Chỉ báocủa TrendoscopeCập nhật 33138