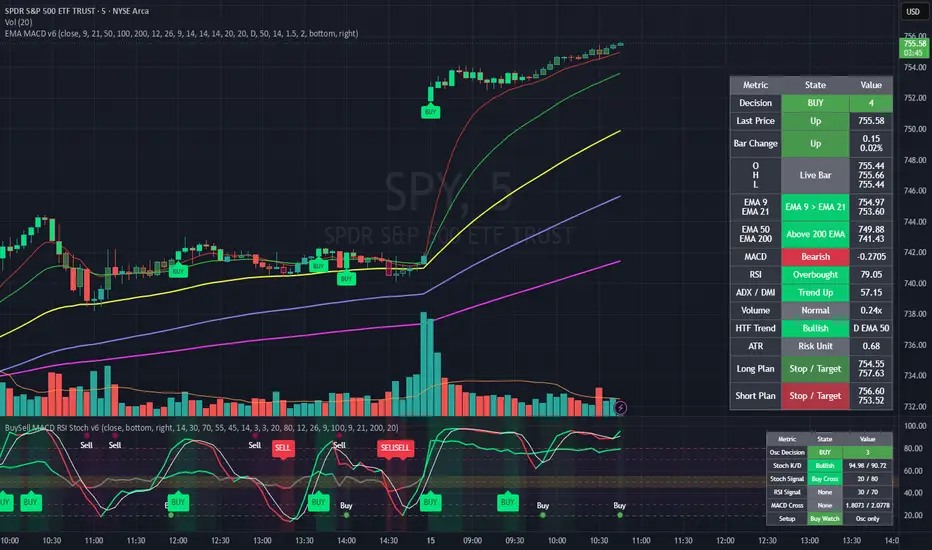
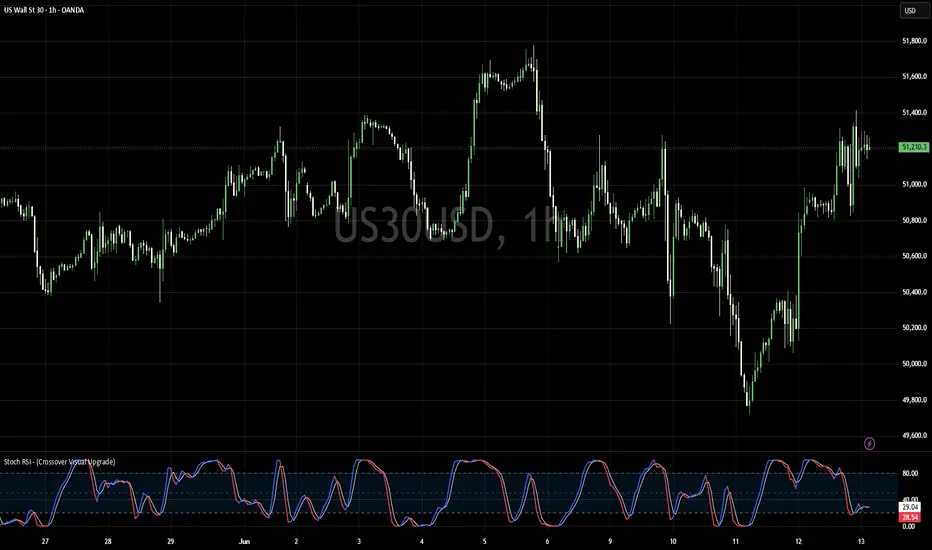
Intraday Pullback Sniper (BB, Stoch RSI, Liquidity, HTF)An intraday entry-timing indicator.
It looks for pullbacks into a Bollinger band in the direction of the higher-timeframe bias — buying dips in an up regime, selling rallies in a down one — and marks the candle where the pullback has run far enough and the lower-timeframe structure has turned back.
It marks conditions. It does not place stops, targets or position sizes, and it does not tell you to buy. That decision stays with you.
TWO DOTS, AND THE DIFFERENCE BETWEEN THEM IS THE WHOLE IDEA
A small dot means a setup is armed. Four conditions on the same candle: the wick touched a band, the candle closed back inside and in the half that faces that band, the Stoch RSI was at its extreme within the last few candles, and the bias allows that direction. Read it as "price bounced off the band, I am watching."
A large dot means every enabled condition is met. On top of a setup still running from an earlier candle it needs the structure of the entry timeframe to have confirmed the turn, a second band touch with a rejection on this very candle, the bias, the liquidity sweep if you require one, an open session, and the cooldown after the last signal to have passed. Read it as "price did it a second time, and the structure turned in between."
The decisive part is the time gap. The band has to be touched twice, and the structure has to confirm between the two. A large dot can therefore never appear on the same candle as its own small dot — the following one at the earliest. A new small dot on a signal candle is normal: that candle meets the setup conditions as well, so it arms the next setup while the current one fires.
WHAT IT DRAWS
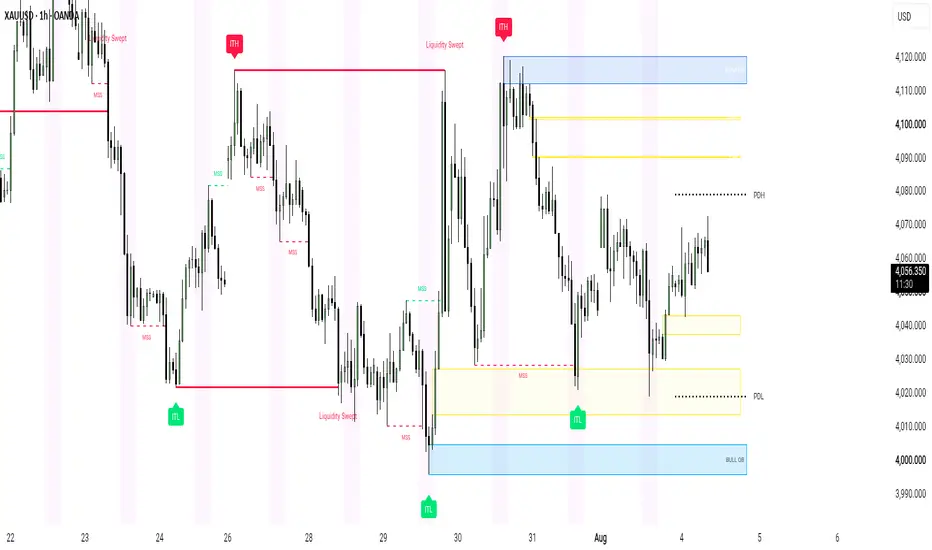
On the price chart: Bollinger Bands, the bias EMA, setup and signal dots with the price they occurred at, swing labels (HH / HL / LH / LL), market structure (BOS / CHOCH / MSB) for several timeframes, liquidity levels named by side and rank, and session boxes sized to the high and low each session made.
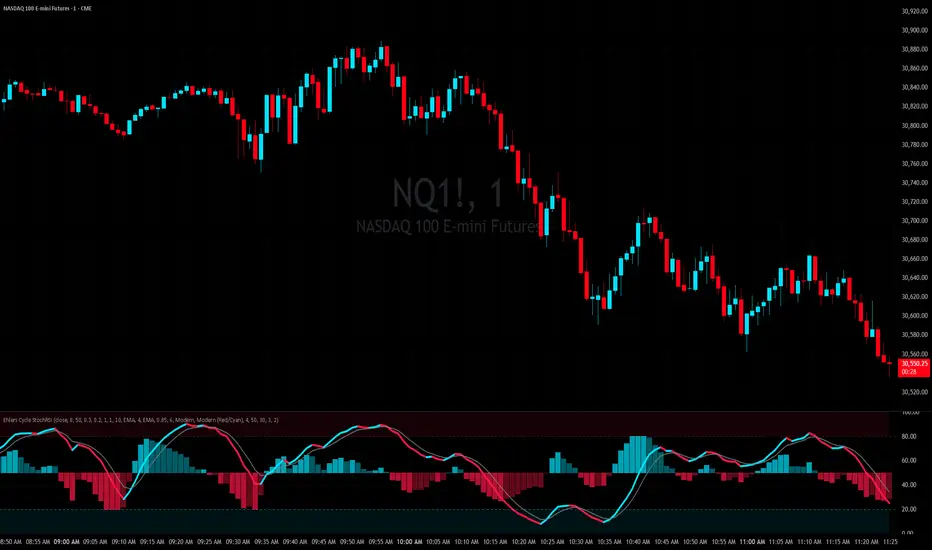
In its own pane: the Stoch RSI the logic actually runs on, its levels, dots at the extremes, the bias as a background tint, and a strip along the bottom that runs for as long as a setup is still waiting for its signal.
HOW SWINGS ARE FOUND
Everything structural — swing labels, market structure and liquidity — comes from one single engine using the classical definition of a turning point. A swing high is the highest candle of a window with the same number of candles on its left and on its right, so it is a local extreme in the literal sense. It is confirmed and never repainted, at the cost of a delay equal to that window.
Highs and lows strictly alternate. A second point of the same kind before the opposite one does not open a new leg; it replaces the current one if it is more extreme, otherwise it is discarded. Two degrees are calculated: a short one with a lookback of 2, the classic fractal, and a longer one for the larger move.
Structure breaks are judged on the close, never on wicks. A break with the prevailing direction is a BOS, one against it a CHOCH; both are MSB events.
Liquidity levels are swing points price has not closed beyond. Once a candle of that timeframe closes through a level, the orders resting there have been filled and the level is dropped. A wick through it with a close back on the old side is a sweep, not a break, so the level survives and is marked as swept.
HOW TO USE IT
Put the chart on the setup timeframe, 5 minutes by default. The entry timeframe must be lower than the chart; its candles are read from inside each chart candle. All higher-timeframe data comes from closed candles only, and signals are evaluated at the close of a chart candle, never intrabar.
The 5-minute default describes the preset, not a limit. Every timeframe is adjustable — a 15m chart with a 1H bias and 5m entry structure works the same way. The status table tells you if the chart and the setup timeframe do not match.
For alerts, pick "Any alert() function call" with the trigger "Once Per Bar Close". One alert then covers both directions, and the message carries symbol, direction, price, bias, setup direction, structure state, sweep and session. Separate SNIPER LONG and SNIPER SHORT conditions exist as well.
Every setting has a tooltip. Group 0 holds a glossary of the labels and a short guide to the alerts.
ON THE DEFAULTS
The defaults are deliberately on the safe side and the strict bias is on. If you get too few signals, switch conditions off one at a time and watch what changes — that is far more instructive than loosening several at once. The liquidity sweep is the one filter that is off by default; switch it on for the stricter variant.
LIMITATIONS, HONESTLY
Lower-timeframe data on TradingView is limited to a few months of intrabar history depending on your plan. Further back the entry structure and the signals that depend on it are missing, while everything else keeps drawing normally.
A swing is only confirmed after its window has passed, so the most recent candles cannot carry a label yet. That delay is the price of never repainting, and it is not a bug.
The indicator needs no volume, so it works on CFDs, forex and futures alike. It assumes continuous trading without large gaps — on instruments that gap overnight a band touch can come from the opening gap rather than from a rejection, and the logic is of little use there.
Suited to liquid, continuously traded instruments: index CFDs, major crypto, major forex pairs, liquid futures. On crypto the sessions carry no meaning; either switch all three off or trade the overlapping hours deliberately.
This is a tool for your own analysis, not financial advice. Past behaviour of any setup says nothing about future results.
Chỉ báo