AlgoZ Pro Price ActionAlgoZ Pro Price Action is a clean price action based forex indicator built to help traders identify potential Buy, Sell, and Exit areas using a combination of market structure, trend filtering, volatility logic, and dynamic trade management.
This indicator is designed around the idea that not every trade needs to have a high win rate to be useful. Instead of only looking for quick scalp targets, AlgoZ Pro Price Action is built to manage trades with a runner-style approach. The goal is to cut weak trades faster, protect trades that start moving in the right direction, and allow stronger moves to continue when momentum is present.
The default settings are best suited for 1-minute EUR/USD forex trading. Other forex pairs and timeframes may work differently and should be tested before use.
The indicator uses market structure breaks to identify possible directional shifts. When price breaks key internal support or resistance levels, the script checks multiple filters before plotting a signal. These filters are designed to reduce low-quality signals during chop, weak momentum, or overextended conditions.
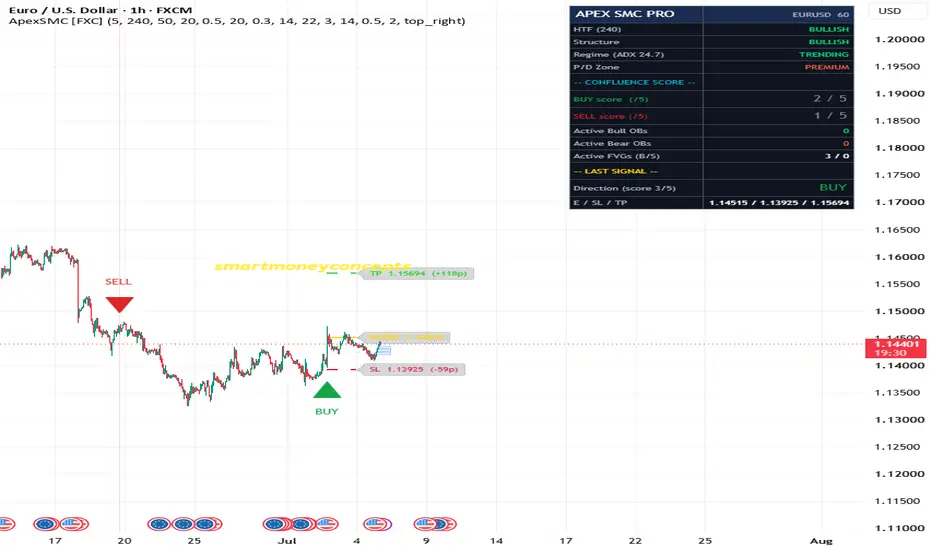
AlgoZ Pro Price Action includes Buy, Sell, and Exit labels directly on the chart. Buy signals are shown in teal, Sell signals are shown in pink, and Exit signals are shown in a neutral color. The bars can also be colored based on the active signal direction so it is easier to visually track the current market bias.
One of the main parts of this indicator is the trend lock system. The trend lock helps prevent the indicator from flipping back and forth too quickly during noisy market conditions. It uses EMA trend structure, slope behavior, and confirmation bars to decide whether the market is currently favoring Buy-side or Sell-side continuation. Countertrend signals must be stronger before they are allowed through, which helps reduce random reversal signals during an active move.
The indicator also includes automatic forex pair adjustment. It detects whether the chart is a JPY pair or a non-JPY forex pair and automatically adjusts pip size calculations. This helps prevent issues where a stop or exit calculation is too tight or too wide because of the symbol’s price format. The script also includes auto volatility tuning, which uses ATR-based logic to scale stop size, runner triggers, trailing stop distance, dead-trade protection, and cooldown behavior based on the current pair’s movement.
Trade management is handled through a dynamic exit engine. Instead of using only fixed take profit levels, the indicator uses runner logic. Once a trade moves far enough in profit, the trade can enter runner mode. From there, the script can move the stop, protect profit, and trail the trade if the move continues. This allows stronger trades to breathe while still giving the indicator a way to exit when momentum fades.
AlgoZ Pro Price Action also includes dead-trade protection. If a trade has been open for a certain number of bars and has failed to make meaningful progress, the script can plot an Exit signal. This is designed to help remove weak trades that are not moving enough to justify staying in them.
The indicator includes several optional filters and controls, including EMA trend filtering, ADX strength filtering, chop filtering, candle body quality filtering, minimum EMA separation, price distance from the slow EMA, overextension protection, post-exit cooldown, and emergency protection logic.
Main features include:
• Buy, Sell, and Exit labels
• Teal and pink AlgoZ Pro visual theme
• Price action and market structure based signals
• Internal support and resistance break logic
• Optional BOS / CHoCH structure markings
• EMA trend filtering
• ADX trend strength filter
• Chop and range filter
• Candle quality filter
• Trend lock system
• Countertrend signal protection
• Auto pip size detection
• Auto adjustment for JPY and non-JPY forex pairs
• ATR-based auto pair tuning
• Dynamic stop logic
• Runner-style trade management
• Breakeven / profit lock logic
• Trailing stop logic for stronger moves
• Dead-trade exit protection
• Optional bar coloring
• Optional entry and stop lines
• Optional status table
Recommended default use:
1-minute EUR/USD forex chart.
Other forex pairs and timeframes may require adjustment depending on spread, volatility, session, and market conditions.
Chỉ báo