SmartFlow Kill ZoneSmartFlow Kill Zone highlights the three major trading sessions (Tokyo, London, New York) and their corresponding ICT Kill Zones directly on your chart. Designed for intraday traders who use session-based and Smart Money Concepts (SMC) strategies, this indicator gives you instant visual clarity on when high-probability trading windows are active.
█ WHAT IT DOES
This indicator identifies and displays the three global forex sessions and three ICT Kill Zones using distinct background colors. It also tracks the High and Low of each session in real time and draws horizontal reference lines that update as the session progresses.
A built-in dashboard provides a quick overview of which sessions and Kill Zones are currently active, along with each session's range in pips.
█ HOW IT WORKS
Session and Kill Zone detection is based on time-of-day logic using the user-selected timezone (default: America/New_York):
Sessions:
- Tokyo: 19:00 – 04:00 ET
- London: 03:00 – 12:00 ET
- New York: 08:00 – 17:00 ET
Kill Zones (ICT):
- London Kill Zone: 02:00 – 05:00 ET
- New York Kill Zone: 07:00 – 10:00 ET
- Asian Kill Zone: 20:00 – 00:00 ET (off by default)
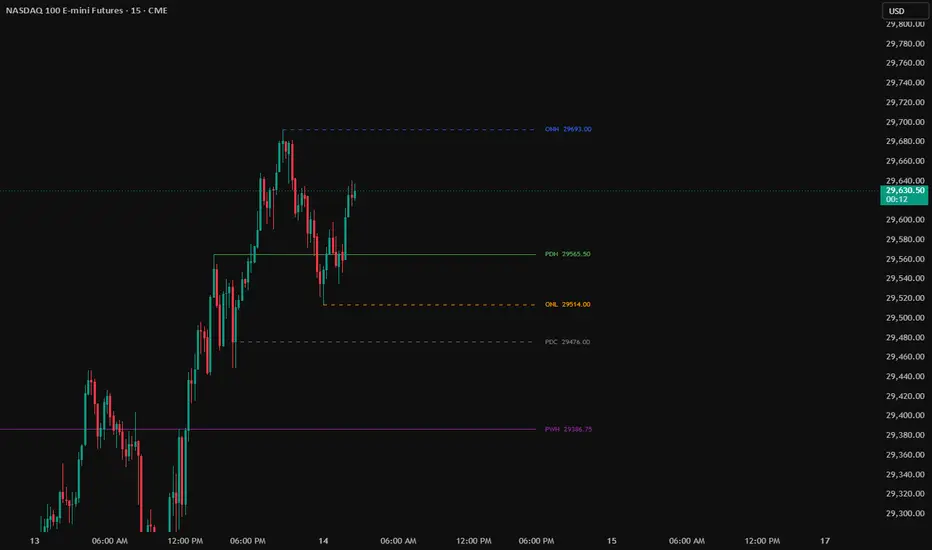
Session High/Low lines are drawn from the session's opening bar and updated on every new bar during the session. When a session closes, lines optionally extend to the right until the next session of the same type begins. Previous sessions' High/Low lines are preserved across multiple days (configurable via "Days to Display").
The dashboard table uses the last bar's data to show open/closed status, the session's current range, and whether any Kill Zone is active.
█ HOW TO USE
- Apply the indicator to any intraday chart (1m to 1h recommended).
- Use the background shading to quickly identify which session you are trading in.
- The brighter Kill Zone overlay tells you when the highest-probability reversal windows are active — this is where ICT traders look for optimal trade entries.
- Session High/Low lines act as key reference levels. Price often reacts at these levels as they represent session-based liquidity.
- The dashboard gives you a heads-up display so you never miss a Kill Zone activation.
█ FEATURES
- Three session backgrounds with independent on/off toggles
- Three ICT Kill Zone backgrounds with independent on/off toggles
- Real-time Session High/Low tracking with configurable line style and width
- High/Low labels that update live during the session
- "Extend Lines Right" option for lines to project forward until the next session
- Multi-day history (up to 30 days of past session H/L lines)
- Dashboard with session status, range (pips), and Kill Zone status
- Dashboard position and size are fully customizable
- 9 alert conditions (session open/close and Kill Zone activation)
- Full timezone support (10 major timezones)
- Works on any symbol and any intraday timeframe
█ SETTINGS
Sessions — Toggle visibility for Tokyo, London, and New York sessions.
Kill Zones — Toggle each ICT Kill Zone independently. Asian KZ is off by default.
Colors — Customize background colors for each session and Kill Zone.
Session High/Low — Toggle H/L lines and labels, set line width, style, and right extension.
Dashboard — Toggle, reposition, and resize the info panel.
Timezone — Select the timezone used for session calculations.
History — Set how many days of past session H/L lines to display (1–30).
█ NOTES
- This indicator does not generate buy or sell signals. It provides session structure and timing context to support your own trading strategy and decision-making.
- Kill Zone times are based on the ICT (Inner Circle Trader) framework. Different educators may define slightly different windows.
- For best results, use on timeframes of 1 hour or lower where session boundaries are clearly visible.
Chỉ báo