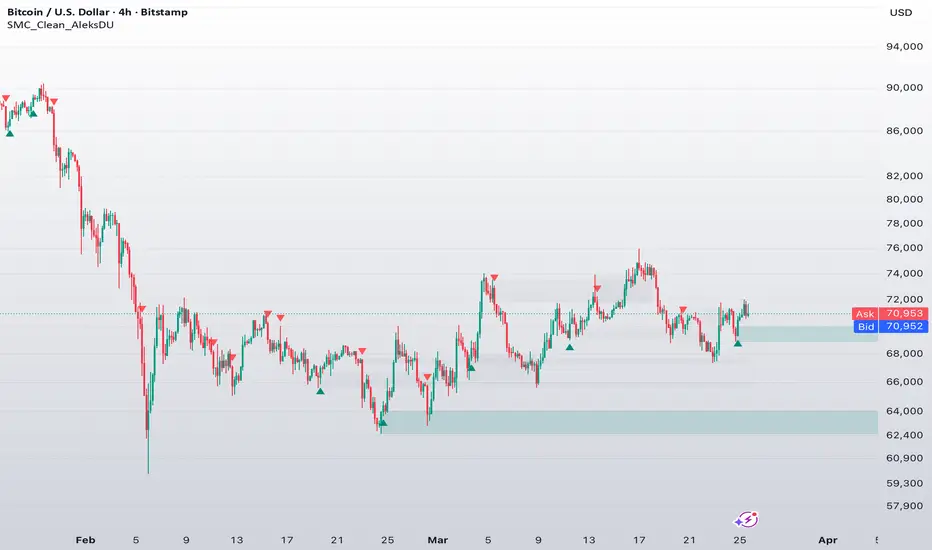
[ A L P H A X ] Order Blocks Institutional Supply & Demand ZoneAlphaX Order Blocks – Institutional Supply & Demand Zone Intelligence, Strength Scoring & Flip Detection
AlphaX Order Blocks is a professional-grade supply and demand zone detection system built on a proprietary multi-factor zone strength scoring engine. It identifies institutional order block zones where smart money has left footprints, tracks zone freshness through multi-touch degradation, detects flip zones when broken levels reverse polarity, and delivers confidence-scored entry signals at the highest-probability reaction points. Designed for traders who want to see where the institutions are positioned on instruments like XAUUSD, indices, forex majors, and crypto.
━━━━━━━━━━━━━━━━━━━━━━━━━━━━━━━━━━━━━━━━
🔬 The Order Block Engine — How It Works
At the core of AlphaX Order Blocks is an institutional zone detection algorithm that identifies price levels where aggressive buying or selling originated. Unlike simple support and resistance lines, these zones represent areas where large orders were placed — and where unfilled orders may still be waiting.
The detection process follows three steps:
Step 1 — Impulse Move Detection
The engine scans for consecutive same-direction candles (configurable from 2 to 5) that confirm a strong directional impulse
At least one candle in the sequence must have above-average volume (measured against a configurable Volume SMA)
This combination of directional conviction plus volume commitment identifies moves driven by institutional participation, not retail noise
Step 2 — Origin Candle Identification
Once an impulse is detected, the engine looks back up to 6 bars (configurable) for the origin candle — the opposite-color candle where the move started
For supply zones, this is the last bullish candle before the bearish impulse — the level where sellers overwhelmed buyers
For demand zones, this is the last bearish candle before the bullish impulse — the level where buyers overwhelmed sellers
The origin candle's high and low define the zone boundaries, expanded by an ATR-based padding for robustness
Step 3 — Volume Delta Calculation
During the origin-to-impulse sequence, the engine calculates the net volume delta — total buying volume minus total selling volume
This delta is displayed on each zone and used in the strength scoring system
A large negative delta on a supply zone confirms strong selling pressure at that level
A large positive delta on a demand zone confirms strong buying pressure at that level
Fresh zones appear with bold borders and bright colors. As they get tested, they visually degrade — giving you an instant read on zone quality without checking any numbers.
━━━━━━━━━━━━━━━━━━━━━━━━━━━━━━━━━━━━━━━━
📊 Six Core Features
AlphaX Order Blocks combines six independent analysis layers into a single cohesive system:
1 ─ Supply Zones (Red Boxes)
Supply zones mark price levels where institutional selling originated. Each zone box displays:
Tier Rating — S, A, B, or C based on the 6-factor strength score
Touch Count — How many times price has tested this zone (×0, ×1, ×2, etc.)
Volume Delta — Net selling pressure at the zone origin
Strength Percentage — The composite score from 0 to 100
Visual styling degrades automatically as zones weaken:
Fresh (0 touches) — Bold solid border, bright color, full opacity
Tested (1 touch) — Solid border, slightly reduced opacity
Multi-tested (2+ touches) — Dashed border, reduced opacity
Weak (max touches reached) — Dotted border, heavily faded — zone is nearly exhausted
━━━━━━━━━━━━━━━━━━━━━━━━━━━━━━━━━━━━━━━━
2 ─ Demand Zones (Green Boxes)
Demand zones following the same tier/touch/delta/strength display format
Demand zones mark price levels where institutional buying originated. They follow the identical visual degradation system as supply zones but in the green color family.
Green Bold Box — Fresh, untested demand zone with highest reaction probability
Green Dashed Box — Tested zone, still valid but weakening
Green Dotted Box — Heavily tested zone, likely to break on next visit
━━━━━━━━━━━━━━━━━━━━━━━━━━━━━━━━━━━━━━━━
3 ─ Flip Zone Detection (Purple Boxes)
One of the most powerful concepts in institutional trading is polarity reversal — when a broken support level becomes resistance, or a broken resistance level becomes support. AlphaX Order Blocks automates this:
When price closes above a supply zone, the zone is deleted and a new demand zone is created at the same level with a purple color
When price closes below a demand zone, the zone is deleted and a new supply zone is created at the same level with a purple color
Flip zones receive a +10 point bonus in the strength scoring system because institutional traders frequently use broken levels as new entry points
This feature can be toggled on/off independently
━━━━━━━━━━━━━━━━━━━━━━━━━━━━━━━━━━━━━━━━
4 ─ Confidence-Scored Entry Signals (▲ / ▼)
Entry signal labels with S/A/B tier classification and strength percentage
When price enters a high-quality zone and produces a confirmation candle, the signal engine fires a scored entry:
▲ Green Label (Demand Signal) — Dark text on green background. Price entered a demand zone and closed with a bullish candle.
▼ Red Label (Supply Signal) — White text on red background. Price entered a supply zone and closed with a bearish candle.
Signals only fire when the zone's strength score meets your configured minimum threshold (default 40%). This prevents signals at weak, over-tested zones.
Each signal is classified into tiers:
S-Tier (75%+) — Highest probability. Fresh zone, high volume, strong departure, EMA confluence.
A-Tier (55–74%) — High probability. Most factors aligned.
B-Tier (40–54%) — Moderate probability. Basic conditions met.
━━━━━━━━━━━━━━━━━━━━━━━━━━━━━━━━━━━━━━━━
5 ─ Risk/Reward Projection
Dotted projection lines from entry to nearest opposite zone with R:R ratio displayed
When an entry signal fires, the system automatically projects a take-profit target to the nearest opposite zone :
Demand signal → Target projects to the nearest supply zone above
Supply signal → Target projects to the nearest demand zone below
The R:R ratio is calculated and displayed (e.g., "TP 2.3R")
This gives you an instant read on whether the trade offers sufficient reward relative to risk
━━━━━━━━━━━━━━━━━━━━━━━━━━━━━━━━━━━━━━━━
6 ─ Proximity Warnings
Orange warning label appearing when price approaches a zone — time to prepare
The proximity engine continuously monitors the distance between current price and all active zones. When price comes within the configurable ATR distance of a zone:
An orange ⚠ warning label appears showing the zone type and distance percentage
This gives you advance notice to prepare for a potential reaction — set alerts, tighten stops, or prepare entries
Works for both supply zones above and demand zones below
━━━━━━━━━━━━━━━━━━━━━━━━━━━━━━━━━━━━━━━━
🧠 6-Factor Zone Strength Scoring
Every zone is continuously scored from 0 to 100 based on six independent factors. This score determines the tier rating, visual styling, and signal eligibility.
Freshness — Untested Zones Score Highest (up to 25 points)
0 touches = 25 points — Fresh zone, never tested, highest probability
1 touch = 18 points — Tested once, still strong
2 touches = 10 points — Multi-tested, weakening
3 touches = 4 points — Nearly exhausted
4+ touches = 0 points — Weak zone, likely to break
Volume at Origin (up to 20 points)
Compares the volume at the origin candle to the volume SMA
Volume ratio > 3.0× = 20 points (institutional-grade volume)
Volume ratio > 2.0× = 16 points
Volume ratio > 1.5× = 12 points
Volume ratio > 1.0× = 7 points (above average)
Departure Velocity (up to 20 points)
Measures how aggressively price left the zone (in ATR units)
Fast departures indicate strong institutional commitment — they want to get filled and move price away quickly
Velocity > 3 ATR = 20 points
Velocity > 2 ATR = 15 points
Velocity > 1 ATR = 10 points
Zone Age (up to 15 points)
Younger zones score higher — they are more relevant to current market conditions
Under 20 bars old = 15 points
Under 50 bars old = 12 points
Under 100 bars old = 8 points
Under 200 bars old = 4 points
Over 200 bars old = 1 point
EMA Confluence (up to 10 points)
Demand zones score higher when price is below the 200 EMA (buying into weakness)
Supply zones score higher when price is above the 200 EMA (selling into strength)
This adds structural trend context to zone quality
Flip Zone Bonus (up to 10 points)
Zones created from polarity reversal receive a flat 10-point bonus
Broken support becoming resistance (or vice versa) is one of the most reliable patterns in institutional trading
━━━━━━━━━━━━━━━━━━━━━━━━━━━━━━━━━━━━━━━━
📐 Dashboard Intelligence
A comprehensive AlphaX-branded dashboard provides real-time zone analytics organized into four sections:
Zone Inventory
Active supply and demand zone counts
Breakdown by status: F (Fresh), T (Tested), W (Weak)
Total flip zone count
Market Bias
Strength-weighted zone bias — shows whether demand or supply zones dominate the current price area
EMA trend direction (Strong Bull / Bull / Bear / Strong Bear / Cross)
RSI with zone classification (OB / OS / HIGH / LOW / MID)
Nearest Zones
Nearest supply zone above current price — with price level, strength score, and distance percentage
Nearest demand zone below current price — with price level, strength score, and distance percentage
Position indicator — shows whether price is closer to supply or demand
Signal Status
Last signal type and how many bars ago it fired
Current volume status relative to the SMA (Spike / High / Normal / Dry)
━━━━━━━━━━━━━━━━━━━━━━━━━━━━━━━━━━━━━━━━
🚀 How to Trade with AlphaX Order Blocks — Step by Step
Step 1 — Identify the Zone Landscape
Look at the chart for active supply (red) and demand (green) zones
Check the Dashboard: Which zones are fresh (F)? Which are tested (T)?
Note any purple flip zones — these are high-probability levels
Step 2 — Wait for Price to Approach a Zone
When the ⚠ proximity warning appears, prepare for a potential reaction
Check the zone's tier rating — S and A tier zones have the highest reaction probability
Ignore C-tier zones unless other confluence is present
Complete trade flow: Zone detection → Proximity warning → Price enters zone → Entry signal → Risk/Reward projection
Step 3 — Enter on Confirmed Signal
Wait for a scored entry label (▲ or ▼) to appear
Confirm the tier — S-Tier and A-Tier signals have the highest probability
Place your stop loss beyond the opposite side of the zone
Step 4 — Set Target Using R:R Projection
The system automatically projects a dotted line to the nearest opposite zone
The R:R ratio is displayed — only take trades offering at least 1.5R or better
Use the projected target as your primary take-profit level
Step 5 — Monitor Zone Degradation
If you are in a trade and the target zone changes from solid to dashed border, it may break — consider tightening your take-profit
If your entry zone starts getting tested from the wrong side, the thesis may be failing — consider a stop adjustment
Step 6 — Understand Zone Breaks
When a zone breaks (candle closes through it), the zone is automatically deleted
If flip detection is enabled, a new opposite zone appears at the same level
Zone breaks often indicate a change in institutional bias — respect them
━━━━━━━━━━━━━━━━━━━━━━━━━━━━━━━━━━━━━━━━
⚠ When NOT to Trade — Zone Quality Filters
Not all zones are created equal. AlphaX Order Blocks gives you clear visual and numerical cues to avoid low-quality setups:
Avoid these conditions:
C-Tier zones only — If no S, A, or B tier zones are near price, the area lacks institutional interest
All zones heavily tested — If every zone shows ×3 or ×4 touches with dashed/dotted borders, the levels are exhausted
Dashboard shows "BALANCED" bias — When supply and demand strength are equal, there is no clear institutional edge
Volume shows "DRY" — Low volume environments produce unreliable zone reactions
Multiple flip zones clustered — Heavy flip activity indicates a choppy, indecisive market where zones break frequently
What to do:
Wait for new fresh zones to form with strong volume
Look for zones where the departure velocity was high (the market left aggressively)
Switch to a higher timeframe to find larger, more significant zones
Only trade zones that align with the EMA trend direction
━━━━━━━━━━━━━━━━━━━━━━━━━━━━━━━━━━━━━━━━
⚡ Key Features
🔬 Institutional zone detection using consecutive impulse candles + volume confirmation
🏗 6-factor zone strength scoring (freshness, volume, velocity, age, EMA, flip)
🏷 S/A/B/C tier zone classification with readable labels and strength percentages
👆 Multi-touch tracking with automatic visual degradation (solid → dashed → dotted → faded)
🔄 Automatic flip zone detection — broken supply becomes demand and vice versa (purple zones)
▲▼ Confidence-scored entry signals at high-quality zone reactions
📐 Risk/Reward auto-projection to nearest opposite zone with R:R ratio
⚠ Proximity warnings when price approaches active zones
📊 EMA confluence scoring — zones aligned with trend structure score higher
📈 Comprehensive AlphaX-branded dashboard — zone inventory, market bias, nearest zones, signal status
🎨 Cohesive triple-tone color theme — Green for demand, Red for supply, Purple for flip zones
🔔 15+ alert conditions — zone detection, touches, signals by tier, and combined
⚙ Fully configurable — detection sensitivity, zone behavior, scoring weights, and all visuals
━━━━━━━━━━━━━━━━━━━━━━━━━━━━━━━━━━━━━━━━
⚙ Settings Reference
Zone Detection
Consecutive Candles Required — Number of same-direction candles for impulse detection (default: 3)
Origin Candle Lookback — How far back to search for the origin candle (default: 6)
Volume Threshold Multiplier — Volume must exceed SMA × this value (default: 1.0)
Volume SMA Length — Baseline period for volume comparison (default: 50)
Zone Height (ATR Multiple) — Controls the vertical thickness of zone boxes (default: 1.5)
Max Active Zones Per Side — Cap on simultaneous supply and demand zones (default: 8)
Zone Cooldown — Minimum bars between new zones of the same type (default: 10)
Zone Behavior
Max Touches Before Weak — After this many tests, zone is visually degraded (default: 4)
Require Close to Break Zone — Prevents wick-through fake breaks (default: enabled)
Detect Flip Zones — Enable/disable polarity reversal detection (default: enabled)
Confluence
Fast EMA Period — Short-term trend reference (default: 21)
Slow EMA Period — Long-term structural reference (default: 200)
Show EMAs — Toggle EMA plot visibility
Use EMA Confluence in Scoring — Add/remove EMA from strength calculation
Signals
Show Entry Signals — Toggle entry labels
Min Zone Strength for Signal — Minimum score required (default: 40%)
Signal Cooldown — Minimum bars between signals (default: 5)
Show Proximity Warnings — Toggle approach alerts
Proximity Distance — How close price must be to trigger warning (default: 1.5 ATR)
Risk/Reward
Show Risk/Reward Projection — Toggle the dotted target line and R:R label
Dashboard
Show Dashboard — Toggle the information panel
Position — Top Left, Top Right, Bottom Left, Bottom Right
Dashboard Text Size — Tiny, Small, Normal
Colors
Bull / Demand Primary / Bright / Dim — Green family for demand zones
Bear / Supply Primary / Bright / Dim — Red family for supply zones
Flip Zone — Purple for polarity-reversed zones
Proximity Warning — Orange for approach alerts
Neutral / Neutral Light — Gray for structural elements
━━━━━━━━━━━━━━━━━━━━━━━━━━━━━━━━━━━━━━━━
🔔 Alert Conditions
New Supply Zone Detected — Fires when a fresh supply zone is created
New Demand Zone Detected — Fires when a fresh demand zone is created
Supply Zone Touched — Fires when price enters a supply zone
Demand Zone Touched — Fires when price enters a demand zone
S/A/B-Tier Demand Signal — Confidence-based demand entry alerts
S/A/B-Tier Supply Signal — Confidence-based supply entry alerts
Any Demand / Supply / Zone Signal — Combined alert conditions
All alert messages include {{ticker}} and {{interval}} placeholders for clean webhook integration.
━━━━━━━━━━━━━━━━━━━━━━━━━━━━━━━━━━━━━━━━
🎯 Default Settings — Optimized For
The default configuration is tuned for XAUUSD (Gold), major forex pairs, and indices on the 5-minute to 1-hour timeframes :
3 consecutive candles strikes the balance between sensitivity and reliability
Volume multiplier at 1.0× captures most institutional moves without over-filtering
Zone cooldown at 10 bars prevents cluster creation in volatile periods
Max 4 touches before weak aligns with institutional order absorption theory
EMA confluence enabled for trend-aligned zone scoring
For other instruments or timeframes, adjust:
Higher timeframes (4H, Daily) — Increase Origin Lookback to 8–10, increase Zone Height to 2.0+ ATR
Scalping (1m, 5m) — Reduce Consecutive Candles to 2, reduce Cooldown to 5–7 bars
Crypto — Increase Zone Height to 2.0–3.0 ATR (higher volatility), increase Volume Multiplier to 1.5×
Forex majors — Use defaults, optionally reduce Volume Multiplier to 0.8× for pairs with lower tick volume
Cleaner zones — Increase Consecutive Candles to 4–5, increase Volume Multiplier to 1.5×
More zones — Decrease Consecutive Candles to 2, decrease Volume Multiplier to 0.7×, increase Max Zones
━━━━━━━━━━━━━━━━━━━━━━━━━━━━━━━━━━━━━━━━
👥 Who This Is For
🏛 Institutional/Smart Money Traders — Designed to identify where large orders originated and where unfilled orders may remain
📐 Supply & Demand Traders — Automated zone detection with strength scoring replaces manual drawing
🥇 Gold & Forex Traders — Tuned for assets with clear institutional participation patterns
🧠 Systematic Traders — The 6-factor scoring system provides a quantitative framework for zone quality assessment
📊 Breakout Traders — Flip zone detection automatically identifies broken levels as new opportunity zones
📈 Traders who value clean charts — No clutter. Zones auto-degrade and auto-remove. Only relevant levels remain.
⚠ Traders who struggle with zone selection — The tier system physically tells you which zones are worth trading and which to ignore
━━━━━━━━━━━━━━━━━━━━━━━━━━━━━━━━━━━━━━━━
📝 Notes
All zone detections are confirmed on bar close — zones do not repaint or move after creation
Zone break confirmation uses candle close by default (not wicks) to prevent fake-outs — this can be toggled off for aggressive trading
Flip zones inherit a reduced departure velocity (70% of original) to account for diminished institutional interest at reversed levels
Volume delta uses candle direction (close vs open) as a proxy for buy/sell pressure — this is an approximation, not true order flow
Dashboard updates on the last bar only for performance optimization
Maximum 500 boxes, 500 labels, and 500 lines are used — on very low timeframes with extended history, oldest drawings may be automatically removed by TradingView's rendering limits
Overlapping zone prevention runs at creation time — if a new zone would overlap an existing one of the same type, it is not created
━━━━━━━━━━━━━━━━━━━━━━━━━━━━━━━━━━━━━━━━
⚠ Disclaimer
This indicator is a technical analysis and visualization tool intended for educational and informational purposes only. It does not constitute financial advice or a recommendation to buy or sell any financial instrument. All signals and zone detections are generated from historical and real-time price data using mathematical calculations — their accuracy or profitability is not guaranteed. Supply and demand zones represent areas of historical interest, not guaranteed future reaction points. Past zone behavior does not guarantee future price reactions. Always conduct your own analysis, use proper risk management, and consult a licensed financial advisor before making any trading decisions. The author accepts no responsibility for any losses incurred from the use of this indicator.
━━━━━━━━━━━━━━━━━━━━━━━━━━━━━━━━━━━━━━━━
Built for traders who demand clarity, confidence, and precision from their charts.
Chỉ báo