Liquidity Sweep Reversal [JOAT]═══ LIQUIDITY SWEEP REVERSAL ═══
Liquidity Sweep Reversal hunts the stop-run. Price wicks beyond a prior swing high or low to grab resting liquidity, then snaps back inside — and that reclaim is where the reversal often begins. This tool tracks those levels, validates the sweep, and frames a complete trade with stop, targets and live outcome stats. 🎯
▎ WHAT IT DOES
It maps recent swing highs and swing lows as liquidity pools, watches for a candle to pierce one and then close back on the correct side (the reclaim ), and prints a clean BUY or SELL label. Every valid signal is turned into a structured trade: an ATR-based stop beyond the swept wick and three R-multiple targets, all tracked to resolution on a self-scoring dashboard.
▎ HOW IT WORKS
• Liquidity mapping — Confirmed pivot highs and lows (lookback set by Swing Pivot Lookback ) are stored as active levels per side, capped in count and aged out after a maximum bar age so only relevant pools remain.
• Sweep + reclaim — A bullish setup needs the bar to wick below a tracked swing low, then close back above it (sell-side liquidity grabbed). A bearish setup wicks above a swing high, then closes back below it. The reclaim can complete on the sweep bar or within the Reclaim Window you allow.
• Wick-depth gate — The penetration beyond the level is measured in ATR. Too shallow (noise) or too deep beyond the Max Wick cap (a genuine breakout) is rejected, so only clean stop-hunts qualify.
• Confluence filters — Optional volume-spike confirmation, HTF trend alignment (BUY only above a higher-timeframe EMA, SELL only below), directional restriction, dual-side sweep blocking on wide bars, and a signal cooldown all thin the feed.
• Trade construction — Entry is the reclaim close. The stop sits beyond the swept wick by an ATR buffer, then is clamped between a min-risk floor and max-risk cap. That risk (1R) projects TP1 / TP2 / TP3 at your chosen R multiples.
• Outcome engine — Each trade is followed bar by bar. Same-bar stop-vs-target conflicts resolve by your chosen priority, and trades that never reach TP3 or stop are flattened at a bar timeout — every result feeds the stats.
▎ HOW TO USE IT
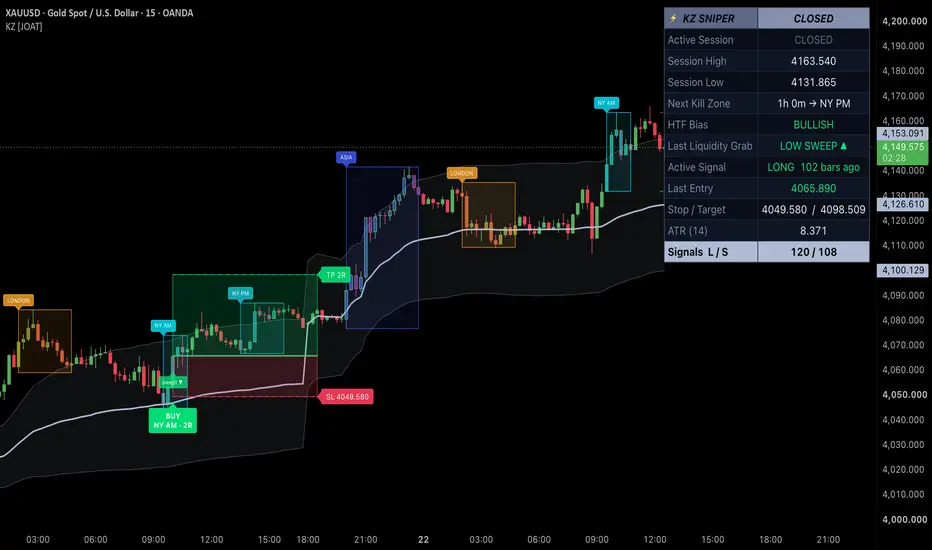
• A BUY pill under price marks a bullish reclaim; a SELL pill above price marks a bearish one. The dotted level line and SSL / BSL SWEEP tag show exactly which liquidity pool was raided.
• The green target zone spans entry to TP3; the red risk zone spans entry to stop. Lines and left-side labels print entry, SL and each TP with its R value.
• On close, a result label reports the outcome — TP3 , a protected partial TP , SL , or a TIME exit — with the realised R.
• Treat signals as a structured framework, not a black box: strongest reversals tend to appear at obvious swing extremes, with HTF alignment and a volume spike behind them.
▎ KEY SETTINGS
• Engine — pivot lookback, reclaim window, ATR length, tracked levels per side, level age, and signal direction (Both / Long / Short).
• Filters — min/max wick depth, volume-spike confirmation, HTF timeframe + EMA, dual-side blocking, and cooldown bars.
• Trade Model — stop buffer, min/max risk bounds, TP1/TP2/TP3 in R, same-bar priority, trade timeout, and drawn-trade history depth.
• Visuals — toggles for markers, sweep lines, zones, level labels, result labels, optional signal-candle tint, and a session VWAP ± σ band .
▎ DASHBOARD
A compact panel reports live state — Status (Waiting / Armed / Active), current active trade side, last sweep and its level — alongside performance: sweeps detected, signals taken, closed count, win rate , profit factor , average R , bull vs bear win%, current and max win/loss streak , and an optional TP1/TP2/TP3 vs SL/Timeout breakdown. Position and text size are configurable.
▎ ALERTS
• Bullish Sweep (BUY) and Bearish Sweep (SELL) on confirmed entries.
• TP3 Hit , Partial TP Hit (protected exit), and SL Hit on trade resolution.
▎ NOTES
• Works on all timeframes and all assets — instruments without volume simply pass the volume filter.
• Signals confirm on the reclaim close , so a printed BUY/SELL marker does not move once the bar closes.
• Every visual has a toggle — turn off zones, lines, labels or the dashboard for a minimalist chart.
• The on-chart statistics summarise historical signals only and are illustrative, not a forecast.
For research and education only. This is not financial advice. No indicator can predict the future, and past behaviour does not guarantee future results. Always manage your own risk.
Made with passion by JackOfAllTrades ⚡
Chỉ báo