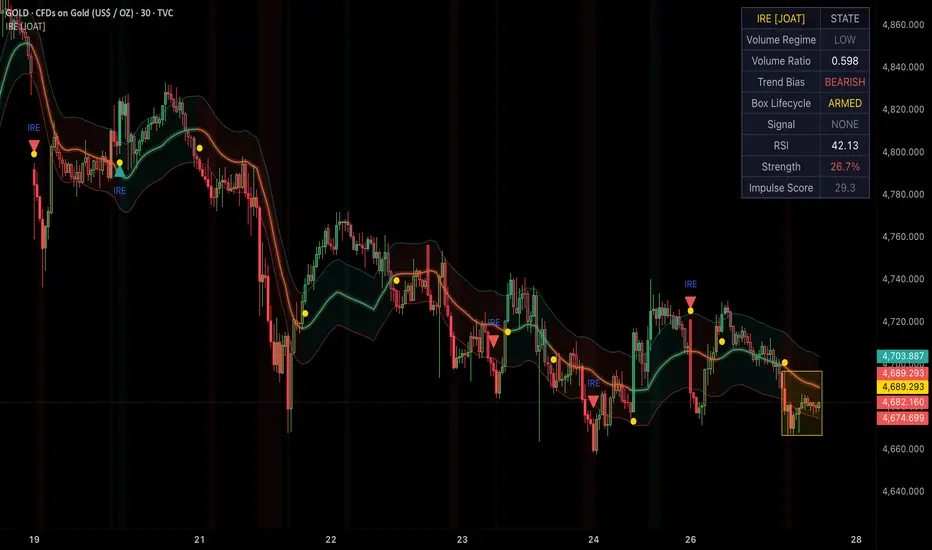
Kalman Trend Filter [JOAT]Kalman Trend Filter
Introduction
Kalman Trend Filter is an open-source trend detection indicator that applies a two-state Kalman filter to price, tracking both the filtered price level and its velocity simultaneously. Unlike exponential moving averages — which apply a fixed exponential decay to past data — the Kalman filter dynamically adjusts its responsiveness based on the ratio of process noise to measurement noise. When price is moving consistently in one direction, the filter trusts new measurements more heavily. When price is noisy, it trusts its own model more heavily.
The practical result is a trend line that responds faster than an equivalent EMA during genuine trends while remaining smoother during chop. The velocity state is the direct indicator of trend direction and strength — it is what drives signal generation and candle coloring.
Core Concepts
1. Two-State Kalman Filter
The filter tracks two quantities: price (position state) and the rate at which price is changing (velocity state). The prediction step projects both states forward using simple kinematic equations. The correction step updates them based on how much the current close deviates from prediction:
// Prediction
float xPred = xEst + vEst
float pPred = pEst + qNoise
// Kalman gain
float kGain = pPred / (pPred + rNoise)
// Correction
float xEst = xPred + kGain * (close - xPred)
float vEst = vEst + kGain * (close - xPred)
The process noise (qNoise) and measurement noise (rNoise) parameters control how much the filter trusts its own momentum model versus new price data.
2. Velocity as Trend Proxy
The velocity state is the most analytically useful output. Positive velocity means the filtered price is accelerating upward; negative means downward. The magnitude of velocity indicates trend strength. Velocity crossing zero is a higher-quality trend reversal signal than a moving average crossover because it reflects the momentum of the filtered series, not the level.
3. Gradient Candle Coloring
Candles are painted using a two-sided gradient driven by the velocity state. Strongly positive velocity produces bright cyan candles; strongly negative produces bright magenta. Near-zero velocity transitions to neutral. The gradient intensity scales with velocity magnitude rather than applying a binary color switch.
4. Velocity Oscillator
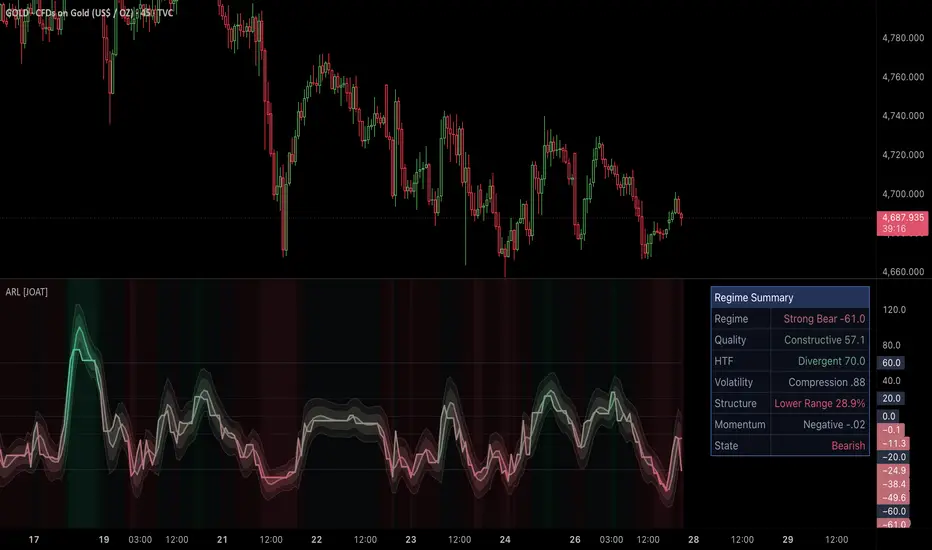
The velocity state is plotted as a separate sub-indicator below the main chart, providing a visual oscillator that crosses zero at trend reversals. Unlike momentum oscillators derived from price differences, this oscillator represents the Kalman filter's internal estimate of trend rate — it is inherently smooth without additional EMA smoothing.
Features
Two-state Kalman filter: Tracks price level and velocity simultaneously
Configurable noise parameters: Process and measurement noise control filter responsiveness
Filtered price line overlay: Smooth trend line drawn on the price chart
Velocity oscillator: Kalman velocity state as a zero-line oscillator
Velocity zero-cross signals: Bull and bear signals when velocity crosses zero
Gradient candle coloring: Cyan for upward velocity, magenta for downward, scaled by magnitude
Dashboard: Current filtered price, velocity, trend state, and noise parameters
Alerts: Velocity zero-cross and extreme velocity alerts
Input Parameters
Kalman Engine:
Process Noise (Q): How much the filter trusts its own velocity model (default: 0.01)
Measurement Noise (R): How much the filter trusts new price measurements (default: 1.0)
Initial Velocity: Starting velocity state (default: 0.0)
Display:
Show Filter Line toggle
Show Velocity Oscillator toggle
Show Candle Color toggle
How to Use This Indicator
Step 1: Read Velocity Direction
Positive velocity (oscillator above zero, cyan candles) indicates the filter is trending upward. Negative velocity (below zero, magenta candles) indicates downward trend. The magnitude tells you how strong.
Step 2: Use Velocity Zero-Cross as Trend Change Signal
When velocity crosses from negative to positive, the filter's internal momentum model has flipped bullish. This is more reliable than a price crossover because it reflects the rate of change of the filtered series.
Step 3: Tune Noise Parameters to Timeframe
On faster timeframes, increase Q slightly (0.02–0.05) to make the filter more responsive. On weekly charts, reduce Q (0.001–0.005) for a smoother, slower-adjusting filter.
Step 4: Combine with Regime Context
The Kalman filter performs best in trending regimes. Combine with Fractal Dimension Oscillator: when FDO shows a trending regime, Kalman velocity direction provides the trend bias.
Indicator Limitations
The Kalman filter assumes a linear motion model; non-linear price dynamics (sudden gaps, news events) produce temporary distortion in the filter state
Optimal Q and R values are instrument and timeframe dependent; no universal setting works everywhere
Velocity zero-crosses during low-volatility consolidation can produce frequent false signals
Originality Statement
The two-state Kalman filter implementation combined with a velocity-driven gradient candle coloring system, a dedicated velocity oscillator, and dual-input noise parameter configuration in a single publication is the original contribution here. Most published Kalman filter scripts on TradingView implement a single-state position filter with no velocity tracking and no gradient visualization.
Disclaimer
This indicator is provided for educational and informational purposes only. It is not financial advice. Kalman filter outputs are mathematical estimates based on prior observations and do not predict future price. Trading involves substantial risk of loss.
-Made with passion by jackofalltrades
Chỉ báo