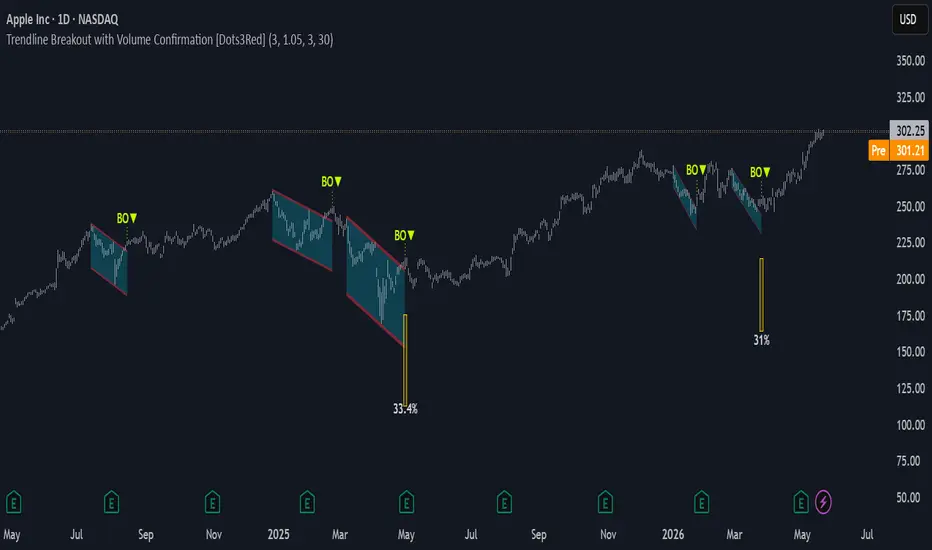
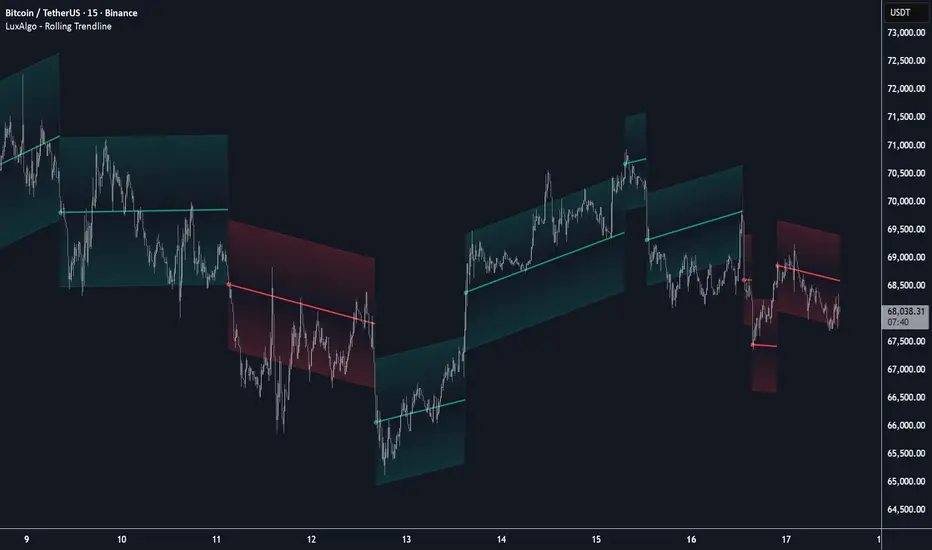
Auto Trendline Break Quality [AGPro Series]Auto Trendline Break Quality
🔹 OVERVIEW
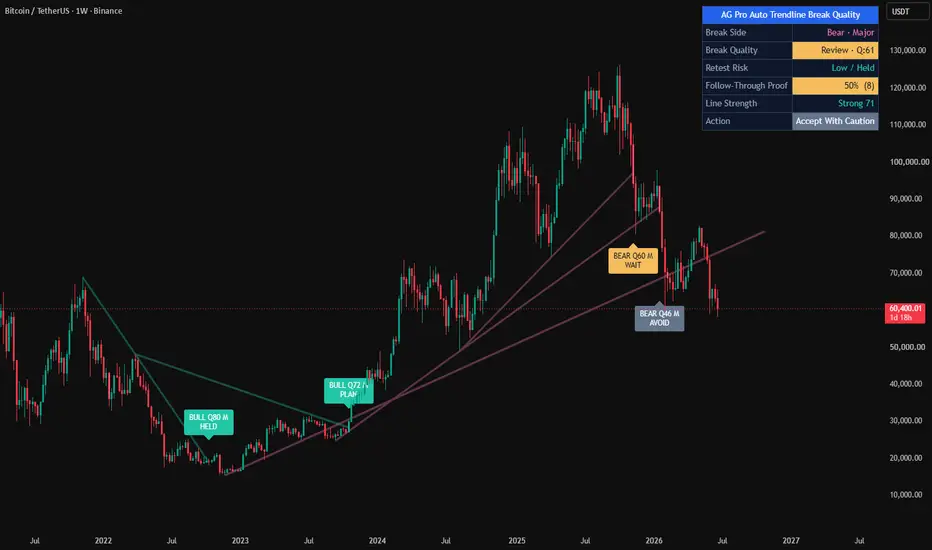
Auto Trendline Break Quality is a structural break-quality engine. It automatically detects bullish and bearish trendlines from swing pivots, monitors every break event in real time, and assigns each break a 0–100 quality score derived from four independent quantitative factors. The tool separates Major (structural) and Minor (tactical) trendlines, so the same break can be evaluated against multiple layers of market structure at once.
The script is purpose-built to answer the single most practical question a price-action trader faces at a trendline break: "Is this break real, or is it a fake-out?"
🧭 UNIQUE EDGE
Most trendline scripts either draw trendlines or flag a break. They stop there. This indicator continues where they stop — and measures the break.
Key differentiators:
• Four-factor composite quality score (Volume · Slope · Impulse · Retest) calibrated to ATR, so the scoring is consistent across assets and timeframes.
• Major/Minor trendline hierarchy. A Major structural break automatically earns a score bonus and is visually flagged with a "MAJ" tag, so structural breaks are never confused with noise breaks.
• State-based visual language. Active trendlines render in a neutral tone. On break, the trendline transitions to the break-direction color (bullish break = bull color, bearish break = bear color), so the chart communicates state without ambiguity.
• Retest logic built directly into the score. A break that is retested and holds within the defined window receives an upgrade; a failed retest downgrades the score. The chart label reflects the final, updated quality.
• Optional zone-band rendering around Major trendlines, letting the user see each structural line as a reaction zone rather than a bare line.
• Label confluence grouping to prevent chart clutter when multiple breaks occur near the same price level.
⚙️ METHODOLOGY
1) Trendline detection
Pivots are identified using standard pivot-high and pivot-low logic with two configurable lookbacks — one for Major trendlines and one for Minor. A new trendline is validated between the two most recent same-side pivots when the slope (ATR-normalized) exceeds the minimum threshold. Nearly-flat trendlines are rejected by design.
2) Break detection
A trendline is considered broken when the current candle closes on the opposite side of the projected line while the previous candle closed on the valid side. This one-bar confirmation rule avoids intra-bar flicker.
3) Quality scoring (0–100)
• Volume expansion vs 20-bar average — up to 25 points
• ATR-normalized slope steepness — up to 20 points
• Break-bar impulse measured in ATR from the line — up to 25 points
• Retest base score — 18 points, upgraded by +15 on a held retest, or reduced by 10 on a failed retest
• Major trendline bonus — +10 points
4) Retest tracking
After a break, the script watches a configurable window (default 3–8 bars) for price to return to the broken trendline within an ATR tolerance. Held retests and failed retests are tracked independently and reflected in the panel's Retest Held Rate. Retest markers are offset from the trendline in ATR units to prevent overlap with candles.
📊 SIGNALS & STATES
• Break label: "BREAK Q: · " and an optional "MAJ" tag for Major trendlines. Label color tier: High quality renders in full state color, Medium quality in neutral amber, Low quality in a muted tone.
• Retest marker: Small circular marker with "retest held" or "retest failed" text, offset from the trendline for clarity.
• Break bar border: Optional candle-border color that reflects break direction.
• Panel: Active trendlines per side, last break score and direction, overall break-direction breakdown, retest held rate, quality distribution (High/Medium/Low), total breaks tracked, and the current detection mode.
• Alerts: "High Quality Trendline Break" and "Major Trendline Break" — both standard alertcondition entries.
🎛️ KEY INPUTS
• Major / Minor Pivot Length — controls how many bars each side of a pivot must be a local extreme.
• Show Minor Trendlines — toggle tactical layer on top of structural layer.
• Max Active Trendlines per Side — caps the chart clutter.
• Volume Spike Threshold (x Avg) — ratio at which a volume expansion is considered full.
• Retest Min/Max Bars — bar range for a valid retest.
• Retest Tolerance (ATR) — how close price must come to the broken line to count as a retest.
• High / Medium Quality Thresholds — cutoffs for the three quality tiers (defaults: 70 / 50).
• Show Trendline Zone Band — renders a subtle ATR-based band around Major trendlines.
• Zone Band Width (ATR) — controls the thickness of the zone band.
• Label Confluence Grouping (ATR) — merges break labels that land within this ATR distance on nearby bars.
• Label Offset (ATR) — vertical padding so labels never embed in candles.
• Label / Panel / Help font sizes — all default to Normal.
• Panel Position and Theme — six positions, Dark/Light theme.
🧩 HOW TO USE
The indicator is a decision-support layer, not a standalone trading system.
• Treat a break with Q ≥ 70 and a "MAJ" tag as a structural event worth reviewing the higher-timeframe bias for.
• Use the retest window as a patience filter. A break with Q 55–69 that retests and holds often upgrades to a higher-quality setup after the retest.
• Failed retests are not "bad" — they are information. A failed retest on a low-quality break is a strong hint that the break was noise.
• The neutral-color active trendlines are intentional — they tell you where structure exists without biasing your read. Color appears only when structure breaks.
• Combine with your own confluence (volume profile, horizontal support/resistance, higher-timeframe trend). The script does not enter trades; it tells you how reliable a break looks at the moment it happens.
⚠️ LIMITATIONS & TRANSPARENCY
• Quality scores describe historical pattern behavior. They are not predictive probabilities.
• Trendlines are generated from pivots; the final pivot is always confirmed after the pivot-length bars have elapsed. This is standard pivot behavior and is not a repaint of historical marks — past labels remain fixed once a break bar closes.
• The script draws up to the platform's line/label limits. Older trendlines are removed when the active cap is reached.
• Parameter defaults target 4H–1D charts; lower timeframes benefit from smaller pivot lengths and tighter retest windows.
📜 RISK DISCLOSURE
This script is an analytical tool. It does not provide financial advice, investment recommendations, or a trading strategy. Past performance of any pattern, including trendline breaks, does not guarantee future results. Always perform your own analysis and apply proper risk management before making any trading decision.
Chỉ báo