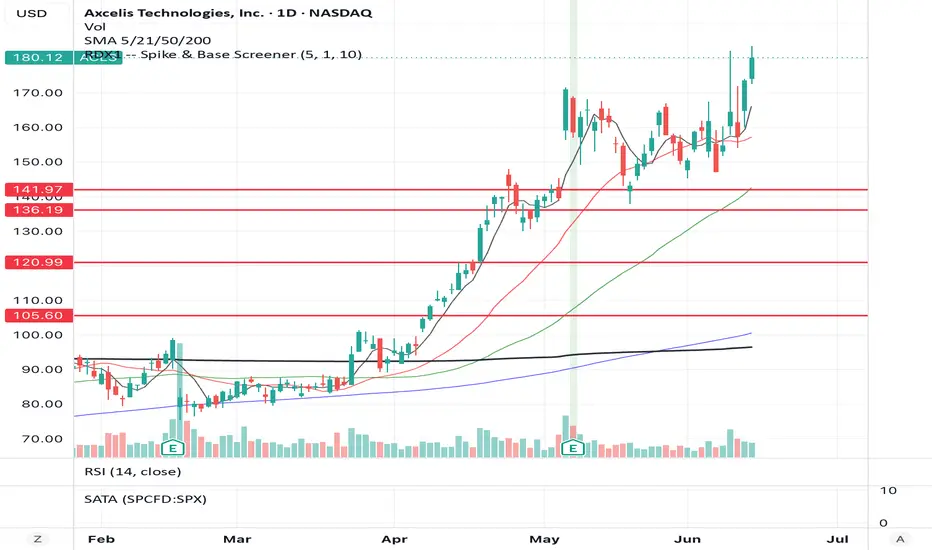
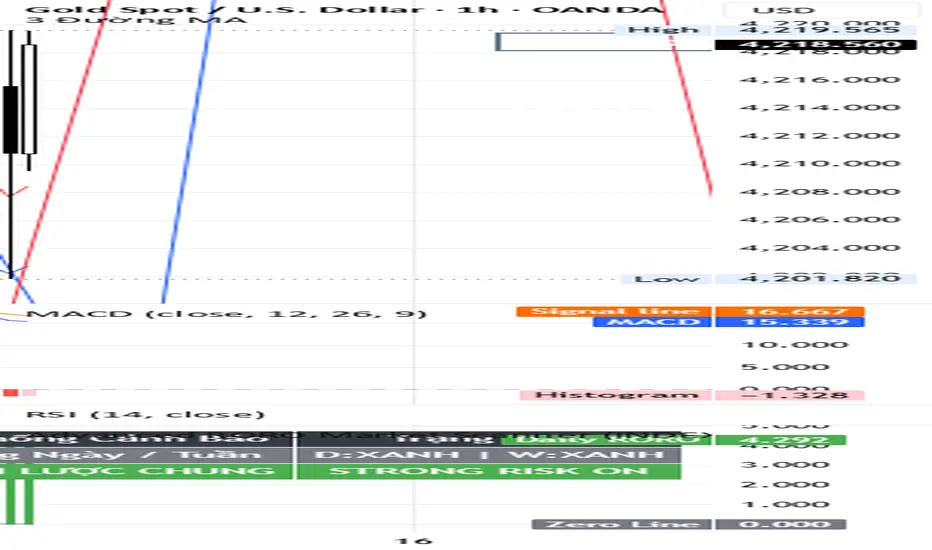
Camarilla Pivot Plays - MaazCamarilla Pivot Plays - Maaz is a institutional-grade quantitative workspace engine engineered for active intraday equity and futures traders. Designed to strip out raw market noise and address the flaws of standard layout pivot scripts, this system delivers an institutional-level view of daily support, resistance, and breakout structures based on Thor Young's classic trading playbook.
The indicator is split into two major algorithmic engines:
1. The Multi-Session Historical Alignment Engine
Unlike generic pivot indicators that pull simple daily data bars (often mixing regular and extended hours incorrectly), this script utilizes a complex multi-session memory snapshot pipeline. By calculating historical session boundaries and tracking extended-hours shifts (useEthForCams), the plots shift step-heights at the exact structural bars required to match professional configurations. It provides clean, un-cluttered stepline plots for:
CP (Central Pivot): The ultimate directional anchor boundary for the session.
R3 / S3: The dynamic range boundaries defining institutional value and traversal reversion loops.
R4 / S4: The critical breakout launchpads where institutional short squeezes or liquidations occur.
R6 / S6: Ultimate daily mathematical expansion targets.
2. The Integrated Precision HUD Panel
The system bypasses standard chart-clipping errors by embedding a stacked, comprehensive workspace dashboard in the top-right corner of your screen. This HUD continuously reads live price metadata to evaluate and display:
Trend Range Bias: Classifies the session macro structure as Higher Range, Lower Range, or Neutral.
Volatility Coiling Status: Classifies the pivot width as Wide or Narrow to instantly tell you whether you are in a range-fading or trend-breakout environment.
Suggested Play Actions: Tells you exactly what setup to watch for (e.g., Watch R4 for Outright Breakout Long) or shifts to bright yellow execution flags (TRIGGER ACTIVE) when levels break.
Pre-Calculated Target Prices: Explicitly states your Planned Entry Pivot Level and Planned Target Exit Level directly inside the table before the trade even triggers.
Institutional Filters: Provides live readouts of Daily Average True Range (ATR), Relative Volume (RVOL) to confirm big block-order breakouts, and an Institutional Net Flow Index tracking raw buy/sell delta pressure.
Chỉ báo