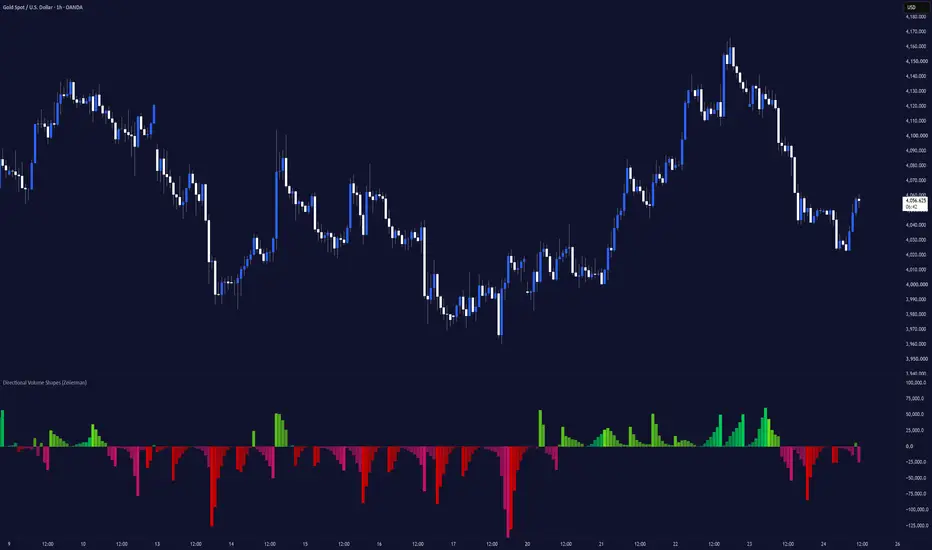
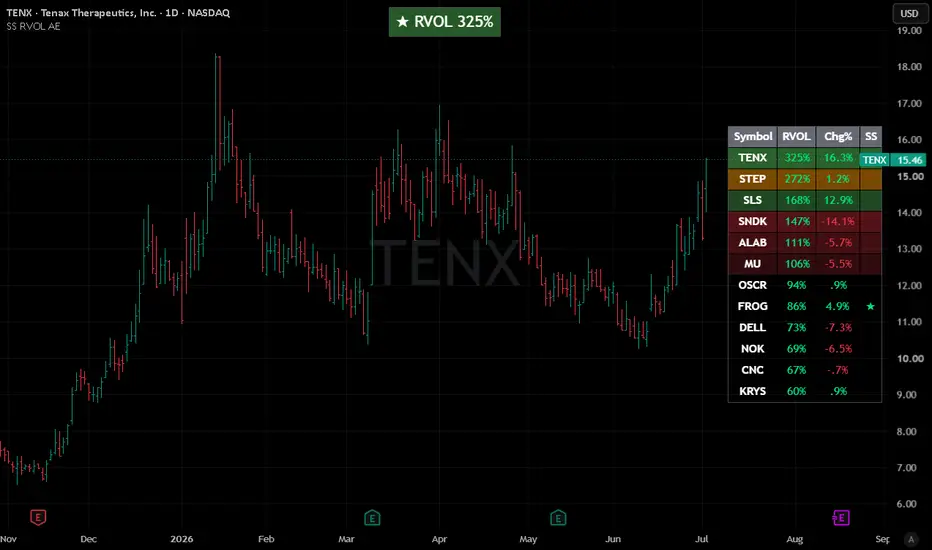
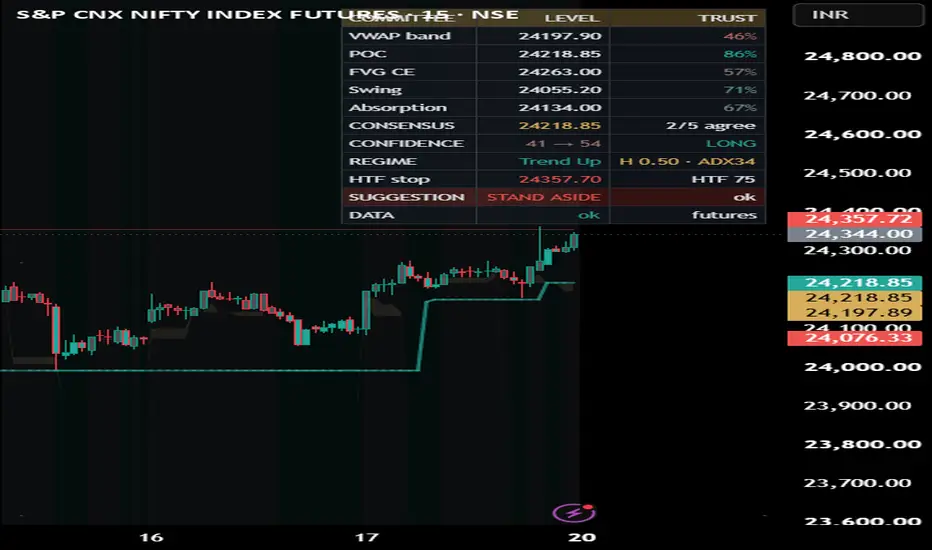
Echo Vector PVSRA Volume### Credits and licence
The starting point for the relative-volume and volume-spread classification framework was the open-source “Traders Reality PVSRA Volume Suite,” originally created by infernix with library integration by peshocore, under the Mozilla Public License 2.0.
This derivative is independently named and does not use the Traders Reality or Pattern Watchers names as its branding.
The imported library calculation has been replaced with script-level calculations. This implementation adds configurable volume tiers, price-extension filters, volume divergence, optional divergence lines, extreme-volume event detection, body-recovery measurements, expanded alerts, and simplified historical outcome tables.
### Overview
Echo Volume Structure is a volume-analysis indicator that classifies candles according to:
* reported volume;
* candle direction;
* candle range;
* volume multiplied by candle range;
* body size;
* price extension from a configurable EMA.
The classifications are displayed as colour-coded volume columns in a separate pane.
Users can optionally apply the same classification colours to the candles on the main price chart.
The script also includes:
* regular bullish and bearish volume divergence;
* divergence markers and configurable lines;
* extreme-volume event diamonds;
* body-recovery tracking;
* simplified divergence target/stop outcomes;
* recovery statistics;
* configurable alerts.
The indicator identifies when its mathematical conditions are present. It does not establish why the activity occurred and does not predict what price will do afterward.
### Data source
By default, the indicator uses OHLC and volume data from the active chart symbol and timeframe.
The requested values include:
* open;
* high;
* low;
* close;
* volume.
The data is requested with lookahead disabled.
### Symbol override
Users can optionally analyze data from a different symbol instead of the active chart symbol.
The override can also contain a combination of compatible feeds, such as multiple exchange symbols added together.
Adding several data feeds can increase processing requirements.
When symbol override is enabled, users should confirm that the selected source is meaningfully related to the active chart.
Differences in exchange activity, trading hours, price scale, market structure, and volume reporting can cause the classifications to differ from those produced by the chart symbol.
### Volume-spread calculation
The script calculates a volume-spread value by multiplying candle volume by the candle’s high-to-low range.
This allows the classification process to consider both:
* the amount of reported volume;
* the price range produced during that volume.
A candle may qualify for an elevated classification because its volume is unusually high, its volume-spread value is unusually large, or it meets a combination of volume, body-size, and price-extension conditions.
### Candle-classification hierarchy
The script applies a fixed priority hierarchy.
When a candle qualifies for more than one classification, the highest active tier determines its colour.
The hierarchy from highest to lowest is:
1. Echo Peak Up or Echo Valley Down;
2. Ultra Up or Ultra Down;
3. Echo Surge Up or Echo Surge Down;
4. Echo Pulse Up or Echo Pulse Down;
5. Normal Up or Normal Down.
The classifications are internal analytical categories. They are not measurements of trade quality and do not guarantee reversal or continuation.
### Default colour key
The default candle classifications and colours are:
* Echo Peak Up — bright green;
* Echo Valley Down — bright red;
* Ultra Up — dark green;
* Ultra Down — dark red;
* Echo Surge Up — lime green;
* Echo Surge Down — light red;
* Echo Pulse Up — blue;
* Echo Pulse Down — fuchsia;
* Normal Up — light grey;
* Normal Down — dark grey;
* Extreme Volume Event — yellow diamond;
* Bullish Volume Divergence — turquoise upward triangle;
* Bearish Volume Divergence — coral-red downward triangle.
All classification, divergence, and line colours can be adjusted in the indicator settings.
### Echo Peak Up — bright green
An Echo Peak Up candle is bright green by default.
It requires:
* an up candle;
* volume at or above the selected multiple of the longer-term average volume;
* a candle body above the selected multiple of its average body size;
* price above the selected EMA by more than the configured standard-deviation distance.
The longer-term volume, body, EMA, and deviation settings are independently configurable.
Echo Peak Up identifies an unusually large bullish candle occurring while price is extended above its recent mean.
It may be examined as possible climactic or blow-off activity, but it does not prove that a market top has formed.
Price may continue rising after an Echo Peak Up candle.
### Echo Valley Down — bright red
An Echo Valley Down candle is bright red by default.
It requires:
* a down candle;
* volume at or above the selected multiple of the longer-term average volume;
* a candle body above the selected multiple of its average body size;
* price below the selected EMA by more than the configured standard-deviation distance.
Echo Valley Down identifies an unusually large bearish candle occurring while price is extended below its recent mean.
It may be examined as possible climactic or exhaustion activity, but it does not prove that a market bottom has formed.
Price may continue falling after an Echo Valley Down candle.
### Ultra Up — dark green
An Ultra Up candle is dark green by default.
It occurs when:
* the candle closes above its open;
* volume reaches the selected Ultra multiple of the longer-term average;
* the candle does not meet all the additional body-size and price-extension requirements of Echo Peak Up.
Ultra Up identifies exceptionally high reported volume on an up candle relative to the selected baseline.
It does not determine whether the activity represents accumulation, distribution, continuation, short covering, or reversal.
### Ultra Down — dark red
An Ultra Down candle is dark red by default.
It occurs when:
* the candle closes at or below its open;
* volume reaches the selected Ultra multiple of the longer-term average;
* the candle does not meet all the additional body-size and price-extension requirements of Echo Valley Down.
Ultra Down identifies exceptionally high reported volume on a down candle relative to the selected baseline.
It does not determine whether the activity represents accumulation, distribution, liquidation, continuation, or reversal.
### Echo Surge Up — lime green
An Echo Surge Up candle is lime green by default.
It is an up candle that meets at least one of the following conditions:
* volume reaches the selected Surge multiple of the recent average volume;
* the candle’s volume-spread value reaches or exceeds the highest previous volume-spread value within the selected lookback.
The candle must not already qualify for Echo Peak Up or Ultra Up.
Echo Surge Up identifies elevated volume or volume-spread activity on an up candle.
It is not an automatic bullish entry signal and does not guarantee that price will continue rising.
### Echo Surge Down — light red
An Echo Surge Down candle is light red by default.
It is a down candle that meets at least one of the following conditions:
* volume reaches the selected Surge multiple of the recent average volume;
* the candle’s volume-spread value reaches or exceeds the highest previous volume-spread value within the selected lookback.
The candle must not already qualify for Echo Valley Down or Ultra Down.
Echo Surge Down identifies elevated volume or volume-spread activity on a down candle.
It is not an automatic bearish entry signal and does not guarantee that price will continue falling.
### Echo Pulse Up — blue
An Echo Pulse Up candle is blue by default.
It occurs when:
* the candle closes above its open;
* volume reaches the selected Pulse multiple of the recent average;
* the candle does not qualify for Echo Peak Up, Ultra Up, or Echo Surge Up.
Echo Pulse Up represents moderately elevated volume on an up candle relative to the selected lookback.
It does not guarantee that upward movement will continue.
### Echo Pulse Down — fuchsia
An Echo Pulse Down candle is fuchsia by default.
It occurs when:
* the candle closes at or below its open;
* volume reaches the selected Pulse multiple of the recent average;
* the candle does not qualify for Echo Valley Down, Ultra Down, or Echo Surge Down.
Echo Pulse Down represents moderately elevated volume on a down candle relative to the selected lookback.
It does not guarantee that downward movement will continue.
### Normal Up — light grey
A Normal Up candle is light grey by default.
It closes above its open but does not meet any enabled elevated-volume classification.
A normal classification does not mean that the candle is unimportant. It means only that the selected relative-volume and volume-spread thresholds were not reached.
### Normal Down — dark grey
A Normal Down candle is dark grey by default.
It closes at or below its open but does not meet any enabled elevated-volume classification.
A normal classification does not mean that the candle is unimportant. It means only that the selected relative-volume and volume-spread thresholds were not reached.
### How to interpret the colours
The colour describes the candle’s direction and the relative-volume tier detected by the script.
For example:
* bright green identifies Echo Peak Up;
* bright red identifies Echo Valley Down;
* dark green identifies Ultra Up;
* dark red identifies Ultra Down;
* lime green identifies Echo Surge Up;
* light red identifies Echo Surge Down;
* blue identifies Echo Pulse Up;
* fuchsia identifies Echo Pulse Down;
* light grey identifies Normal Up;
* dark grey identifies Normal Down.
The colour should be interpreted together with price location and market structure.
An elevated-volume up candle near resistance may have a different context from the same classification during a breakout.
An elevated-volume down candle near support may have a different context from the same classification during an established decline.
The colour identifies the configured mathematical condition. It does not identify the intent of market participants and is not an instruction to buy or sell.
### How to use the indicator
Apply the indicator to a liquid symbol with usable volume data.
A practical workflow is:
1. Review the broader price trend and market structure.
2. Observe the normal volume behaviour of the selected symbol and timeframe.
3. Identify where elevated-volume colours appear relative to support, resistance, breakouts, failed breakouts, and extended price movement.
4. Compare the direction of each classified candle with subsequent price behaviour.
5. Note whether the event is isolated or part of a sequence of elevated-volume candles.
6. Review any bullish or bearish divergence marker while accounting for its pivot-confirmation delay.
7. Inspect yellow extreme-volume diamonds and whether price later crosses their recovery level.
8. Use the historical tables only as simplified chart-based measurements.
9. Test alerts on the intended symbol and timeframe.
10. Combine the indicator with independent price, volatility, liquidity, and risk analysis.
Do not treat an individual colour, triangle, diamond, ratio, or alert as an automatic trade instruction.
### Example use of an Echo Peak Up candle
When a bright-green Echo Peak Up candle appears, consider:
* whether price is already extended above its recent mean;
* whether the candle appears near established resistance;
* whether the candle closes strongly or leaves a large wick;
* whether subsequent candles continue higher or fail to maintain progress;
* whether similar high-volume activity appeared earlier;
* whether a bearish divergence is also present.
The condition identifies unusual volume, body size, and price extension. It does not prove a reversal.
### Example use of an Echo Valley Down candle
When a bright-red Echo Valley Down candle appears, consider:
* whether price is already extended below its recent mean;
* whether the candle appears near established support;
* whether the candle closes strongly or leaves a large wick;
* whether subsequent candles continue lower or recover;
* whether similar high-volume activity appeared earlier;
* whether a bullish divergence is also present.
The condition identifies unusual volume, body size, and price extension. It does not prove a reversal.
### Example use of Surge and Pulse candles
Echo Surge and Echo Pulse candles identify lower relative-volume tiers than Echo Peak, Echo Valley, and Ultra candles.
A sequence of lime-green or blue up candles during a breakout can show repeated elevated activity.
A sequence of light-red or fuchsia down candles during a decline can show repeated elevated activity.
The same colours near failed breakouts or important support and resistance may have a different context.
The classifications describe relative volume and direction, not future price outcomes.
### Main-chart candle colouring
When main-chart candle colouring is enabled, the script applies the classification colour to the corresponding candles on the price chart.
When disabled, the original price-chart colours remain unchanged while the classified volume columns continue to appear in the indicator pane.
### Background preset
The Dark Background and Light Background options adjust the table text colour for visibility.
The preset does not change the candle-classification colour palette.
Individual candle and line colours can be changed separately.
### Volume moving average
An optional simple moving average can be displayed over the volume columns.
The moving-average period is configurable.
The visible moving average provides an additional reference for current volume, but it is separate from some of the internal classification averages.
Changing the visible moving-average period does not automatically change the internal Peak, Valley, Ultra, Surge, or Pulse thresholds.
### Regular volume divergence
The divergence module compares confirmed pivots in price with confirmed pivots in volume.
It identifies two regular divergence conditions:
* bullish volume divergence;
* bearish volume divergence.
The conditions show structural disagreement between price pivots and volume pivots.
They do not guarantee that price will reverse.
### Bullish volume divergence — turquoise upward triangle
A turquoise upward triangle marks a confirmed bullish volume divergence.
The condition requires:
* price to form a lower confirmed low;
* volume to form a higher confirmed low.
This means price reached a lower pivot while the volume pivot did not form a corresponding lower low.
Users may examine the condition together with:
* nearby support;
* reduced downward progress;
* candle structure;
* broader trend;
* subsequent volume classifications.
Price can continue lower after bullish volume divergence is confirmed.
### Bearish volume divergence — coral-red downward triangle
A coral-red downward triangle marks a confirmed bearish volume divergence.
The condition requires:
* price to form a higher confirmed high;
* volume to form a lower confirmed high.
This means price reached a higher pivot while the volume pivot did not form a corresponding higher high.
Users may examine the condition together with:
* nearby resistance;
* reduced upward progress;
* candle structure;
* broader trend;
* subsequent volume classifications.
Price can continue higher after bearish volume divergence is confirmed.
### Divergence pivot strength
The Divergence Pivot Strength setting is applied to both the left and right sides of each pivot.
Higher values generally produce:
* fewer pivots;
* broader pivot structures;
* later confirmation;
* fewer divergence markers.
Lower values generally produce:
* more pivots;
* narrower structures;
* earlier confirmation;
* greater sensitivity to short-term noise.
There is no universal pivot value that is suitable for every symbol and timeframe.
### Divergence confirmation delay
A divergence is not known on the exact historical pivot bar.
The script must wait for the selected number of right-side bars before the pivot can be confirmed.
Once confirmed, the triangle is displayed on the earlier pivot bar.
For example, a pivot strength of 5 requires five later bars before confirmation.
The marker therefore appears earlier on the historical chart than the time at which the condition became available.
### Divergence lines in the indicator pane
Optional panel lines connect the previous and current volume pivots associated with the divergence structure.
Users can configure:
* bullish line colour;
* bearish line colour;
* line width;
* solid, dashed, or dotted style.
These lines help users inspect the change in volume pivots.
They do not project future movement.
### Divergence lines on the price chart
Optional price-chart lines provide a visual reference between price points associated with the volume-pivot locations.
Users can configure their colour, width, and style independently from the panel lines.
These lines are visual aids and should not be interpreted as projected support, resistance, or a forecast of future price movement.
### Extreme Volume Event — yellow diamond
A yellow diamond identifies an Extreme Volume Event.
The condition requires a combination of:
* an already elevated-volume classification;
* volume at least four times the rolling average of recent qualifying elevated-volume candles;
* the highest volume within the recent 50-bar period;
* a candle range above the recent average range.
The rolling event-volume average becomes available only after the script has collected 30 qualifying elevated-volume observations.
The diamond identifies an unusually large volume-and-range event under the selected rules.
It does not prove:
* manipulation;
* institutional activity;
* accumulation;
* distribution;
* liquidation;
* an imminent reversal.
### Extreme-event recovery level
When an Extreme Volume Event occurs, the script calculates a configurable level inside the candle’s body.
At the default 50% setting, the recovery level is the midpoint between the candle’s open and close.
It is not the midpoint of the full high-to-low candle range.
A recovery is counted when closing price crosses the body-based level within the selected recovery lookback.
A wick touching the level without a qualifying close-to-close crossing does not count as a recovery.
A recorded recovery does not guarantee continued movement beyond the level.
### Recovery lookback
The Recovery Lookback setting controls how many bars are allowed for price to cross the active recovery level.
If the level is not crossed within the selected number of bars, that event is no longer tracked as unresolved.
The script tracks only one unresolved recovery event at a time.
If a new yellow-diamond event appears before the earlier event is resolved, the active recovery level is replaced by the newer event.
### Historical divergence outcome table
The left table displays:
* Wins;
* Losses;
* Ratio.
When no earlier hypothetical outcome is active, a confirmed bullish or bearish divergence creates a new measurement.
The script records the confirmation-bar closing price and calculates:
* a fixed percentage target;
* a fixed percentage stop.
For a bullish divergence:
* the target is above the recorded close;
* the stop is below the recorded close.
For a bearish divergence:
* the target is below the recorded close;
* the stop is above the recorded close.
The script records which threshold is detected first.
Only one hypothetical divergence outcome is tracked at a time.
A new divergence is ignored while an earlier outcome remains unresolved.
### Same-bar target and stop behaviour
The target is checked before the stop.
If both the target and stop are reached during the same chart bar, the script records the case as a win.
The script does not reconstruct the lower-timeframe path within that candle, so it cannot determine which level was actually reached first.
This is a material limitation of the table.
### Meaning of the win ratio
The displayed ratio is the number of recorded wins divided by the total number of recorded wins and losses.
It is a simplified historical chart measurement.
It is not equivalent to TradingView Strategy Tester results and does not model:
* commissions;
* slippage;
* spread;
* realistic order execution;
* position sizing;
* portfolio equity;
* liquidity;
* overlapping trades;
* all intrabar sequencing possibilities.
The ratio depends on:
* the symbol;
* timeframe;
* available chart history;
* divergence pivot strength;
* target percentage;
* stop percentage.
The displayed results do not imply future performance.
### Extreme-event recovery table
The right table displays:
* Recovered;
* Ratio.
Recovered is the number of yellow-diamond events for which closing price crossed the configured body-recovery level within the selected lookback.
The ratio is the number of recovered events divided by the total number of detected yellow-diamond events.
This is a simplified event measurement.
It is not:
* a reversal probability;
* an accuracy score;
* a trading win rate;
* evidence that future events will behave similarly.
### Alerts
Alerts are available for:
* any elevated-volume candle;
* Echo Peak Up;
* Echo Valley Down;
* Ultra Up or Ultra Down;
* Echo Surge Up or Echo Surge Down;
* Echo Pulse Up or Echo Pulse Down;
* bullish volume divergence;
* bearish volume divergence.
The general elevated-volume alert activates when any non-normal classification is detected.
### Current-bar behaviour
Volume, high, low, and close can continue changing while the current chart candle remains open.
As a result, candle classifications may appear, change tier, change colour, or disappear before the candle closes.
Extreme Volume Event conditions may also change while the current candle remains open.
Pivot divergence requires right-side confirmation, but the confirmation bar itself may still be open when the condition first becomes true.
Users seeking stable alerts should generally configure TradingView alerts for bar-close execution.
### Suggested starting settings
A practical starting process is:
1. Begin with the default settings on a liquid symbol.
2. Observe how frequently each colour appears.
3. Review the relationship between elevated-volume candles and nearby price structure.
4. Keep the default volume multiples until several historical examples have been inspected.
5. Enable chart-candle colouring only if it improves readability.
6. Enable the volume moving average for additional context.
7. Review divergence triangles while accounting for their confirmation delay.
8. Treat yellow diamonds as extreme-volume markers rather than proof of manipulation.
9. Treat both tables as simplified research measurements.
10. Test alerts before relying on them.
### Adjusting the volume tiers
Increase a tier’s volume multiple to make that classification less frequent.
Decrease the multiple to make it more frequent.
Changing the Echo Peak and Echo Valley body, EMA, or deviation settings affects how strictly the script defines price extension and candle size.
More restrictive values generally produce fewer classifications.
Less restrictive values generally produce more classifications.
Settings should be reviewed separately for each market and timeframe.
### What this implementation adds
Compared with the referenced open-source starting framework, this implementation adds or replaces:
* script-level volume calculations;
* script-level volume-spread calculations;
* configurable multi-tier candle classifications;
* longer-term extreme-volume thresholds;
* candle-body filters;
* EMA-extension filters;
* standard-deviation extension measurements;
* independently configurable classification colours;
* dark- and light-background table presets;
* optional main-chart candle colouring;
* regular price-versus-volume divergence;
* configurable divergence markers and lines;
* optional price-chart divergence references;
* Extreme Volume Event diamonds;
* body-based recovery measurements;
* recovery statistics;
* simplified divergence target/stop outcomes;
* expanded alert conditions.
These modules are combined to study relative volume, price response, divergence, and subsequent recovery within one indicator.
### Limitations
* Reported volume differs between exchanges, brokers, markets, and symbols.
* Some markets provide tick volume rather than centralized transaction volume.
* Combined or overridden data feeds can produce different results from the active chart.
* The classification tiers depend on configurable averages, lookbacks, and thresholds.
* An elevated-volume candle does not reveal the identity or intent of market participants.
* Echo Peak Up does not confirm a market top.
* Echo Valley Down does not confirm a market bottom.
* Ultra, Surge, and Pulse classifications are relative-volume categories, not trade-quality grades.
* Candle classifications may change before the current candle closes.
* Pivot divergence is delayed by the selected right-side confirmation length.
* Confirmed divergence markers are displayed on earlier pivot bars.
* Price-chart divergence lines are visual references and not projections.
* Extreme volume does not prove manipulation.
* Extreme-event detection requires sufficient qualifying historical samples.
* The recovery calculation uses body-based levels and closing-price crossings.
* Only one unresolved recovery event is tracked at a time.
* The historical tables are simplified measurements and not full strategy backtests.
* Only one unresolved divergence outcome is tracked at a time.
* Same-bar target and stop sequencing is not reconstructed.
* The outcome tracker checks the target before the stop.
* The indicator does not account for commissions, slippage, spread, liquidity, position sizing, or realistic execution.
* The indicator should not be used as the sole basis for a trading decision.
This indicator is an analytical tool and does not provide financial advice or guaranteed trading outcomes.
Chỉ báo