5EMA or SMA VWMA by Money farmer5 (EMA/SMA) + VWMA by Money farmer. It has 5 Moving Averages, which you can select as optional. It has Volume Weighted Moving Averages VWMA. Chỉ báocủa MahiReddyCập nhật 11
Mag 7 VWAP TableThe **Mag 7 VWAP Table** is a real-time monitoring dashboard for the "Magnificent Seven" stocks. It provides a clean, professional table on your chart showing whether each stock is trading above or below its daily VWAP, its current price, and its intraday performance compared to yesterday's close. --- ## **Indicator Overview** This script acts as a **market health dashboard**. By tracking the seven most influential stocks in the NASDAQ (AAPL, MSFT, GOOGL, AMZN, NVDA, META, TSLA), it gives traders an immediate sense of market sentiment. If the majority of these stocks are "ABOVE VWAP" and green, the broader market is likely in a strong bullish state. ### **Core Utility & Value** * **Institutional Alignment:** VWAP (Volume Weighted Average Price) is the primary benchmark used by institutional traders. Knowing if the Mag 7 are above or below this level tells you if big money is buying or selling the "generals" of the market. * **Screen Real Estate Efficiency:** Instead of opening seven different charts, you can monitor the most important tickers in the corner of your main trading screen. * **Performance Tracking:** Real-time percentage change allows you to spot which of the tech giants is leading or lagging during the session. --- ## **Key Technical Features** | Feature | Description | | --- | --- | | **Multi-Symbol Data** | Uses `request.security` to pull live data for all seven tickers simultaneously. | | **Precision VWAP** | Calculates VWAP from a **1-minute base** (configurable). This ensures the "Daily VWAP" is hyper-accurate and resets exactly at the session open. | | **Visual Alerts** | Uses a color-coded system (Teal/Red) for instant visual recognition of VWAP status. | | **Zero-Lag Table** | Built using the `table` object, which remains fixed on your screen regardless of where you scroll on the chart. | | **Version 6 Optimized** | Written in the latest **Pine Script v6**, ensuring maximum performance and compatibility with new TradingView features. | --- ## **How to Read the Table** 1. **Stock:** The ticker symbol (NASDAQ prefix removed for cleanliness). 2. **Price:** The current live market price of the asset. 3. **VWAP Status:** * **ABOVE VWAP (Teal):** Bullish. The stock is trading higher than the average price paid by all traders today, weighted by volume. * **BELOW VWAP (Red):** Bearish. The stock is underperforming its daily average. 4. **% Change:** The net gain or loss since yesterday's 4:00 PM EST close. Includes dynamic arrows (**▲/▼**) for quick reading. --- ## **Pro Tip for Usage** Since these stocks represent over **40% of the NASDAQ-100's weight**, use this table as a **confluence filter**. For example, if you are looking to take a "Long" trade on the QQQ or NQ futures, you would ideally want to see at least 5 out of the 7 stocks in this table showing **"ABOVE VWAP"**. Chỉ báocủa zakariya_elalj31
Mag 7 VWAP TableThe **Mag 7 VWAP Table** is a real-time monitoring dashboard for the "Magnificent Seven" stocks. It provides a clean, professional table on your chart showing whether each stock is trading above or below its daily VWAP, its current price, and its intraday performance compared to yesterday's close. --- ## **Indicator Overview** This script acts as a **market health dashboard**. By tracking the seven most influential stocks in the NASDAQ (AAPL, MSFT, GOOGL, AMZN, NVDA, META, TSLA), it gives traders an immediate sense of market sentiment. If the majority of these stocks are "ABOVE VWAP" and green, the broader market is likely in a strong bullish state. ### **Core Utility & Value** * **Institutional Alignment:** VWAP (Volume Weighted Average Price) is the primary benchmark used by institutional traders. Knowing if the Mag 7 are above or below this level tells you if big money is buying or selling the "generals" of the market. * **Screen Real Estate Efficiency:** Instead of opening seven different charts, you can monitor the most important tickers in the corner of your main trading screen. * **Performance Tracking:** Real-time percentage change allows you to spot which of the tech giants is leading or lagging during the session. --- ## **Key Technical Features** | Feature | Description | | --- | --- | | **Multi-Symbol Data** | Uses `request.security` to pull live data for all seven tickers simultaneously. | | **Precision VWAP** | Calculates VWAP from a **1-minute base** (configurable). This ensures the "Daily VWAP" is hyper-accurate and resets exactly at the session open. | | **Visual Alerts** | Uses a color-coded system (Teal/Red) for instant visual recognition of VWAP status. | | **Zero-Lag Table** | Built using the `table` object, which remains fixed on your screen regardless of where you scroll on the chart. | | **Version 6 Optimized** | Written in the latest **Pine Script v6**, ensuring maximum performance and compatibility with new TradingView features. | --- ## **How to Read the Table** 1. **Stock:** The ticker symbol (NASDAQ prefix removed for cleanliness). 2. **Price:** The current live market price of the asset. 3. **VWAP Status:** * **ABOVE VWAP (Teal):** Bullish. The stock is trading higher than the average price paid by all traders today, weighted by volume. * **BELOW VWAP (Red):** Bearish. The stock is underperforming its daily average. 4. **% Change:** The net gain or loss since yesterday's 4:00 PM EST close. Includes dynamic arrows (**▲/▼**) for quick reading. --- ## **Pro Tip for Usage** Since these stocks represent over **40% of the NASDAQ-100's weight**, use this table as a **confluence filter**. For example, if you are looking to take a "Long" trade on the QQQ or NQ futures, you would ideally want to see at least 5 out of the 7 stocks in this table showing **"ABOVE VWAP"**.Chỉ báocủa zakariya_elalj13
Whale Hunter V121. Overview Whale Hunter V12 is a specialized Pine Script indicator designed for high-precision scalping (1m, 5m timeframes) on Futures and Crypto markets. Unlike standard indicators that lag, V12 focuses on Volume Spread Analysis (VSA) and Order Flow to detect institutional "Whale" activity. Its "Precision Engine" filters out low-volatility churn and fake signals by enforcing strict volatility gates (ATR) and volume thresholds. 2. The Logic: How Scoring Works (0-12 Points) Every candle is analyzed and given a "Confluence Score" from 0 to 12. A signal is only generated if the score meets your minimum threshold (Default: 8). Component Max Points Logic A. Volume Spike 4 pts Measures relative volume vs. 20-period average. • 2.0x Vol = 2 pts • 3.0x Vol = 3 pts • 5.0x Vol = 4 pts (Whale) B. Trend (VWAP) 3 pts Checks alignment with Volume Weighted Average Price. • Buy above VWAP = +3 pts • Sell below VWAP = +3 pts C. Absorption Wick 3 pts Measures the rejection wick vs. candle body. • Wick > 1.5x Body = 1 pt • Wick > 50% Range = 2 pts • Wick > 65% Range = 3 pts (Hammer/Shooting Star) D. CVD Divergence 2 pts Checks if momentum contradicts price. • Price Lows lower + Volume Flow Higher = +2 pts (Bullish Divergence) E. Penalties -3 pts The Fakeout Killer: • Buying on a Red Candle = -3 pts • Selling on a Green Candle = -3 pts 3. Settings & Configuration You can customize the strictness of the engine in the indicator settings menu. A. Signal Precision Minimum Score to Show (Default: 8) 8-12: "Sniper Mode." Shows only high-probability setups trading with the trend (VWAP aligned). 6-7: "Scout Mode." Shows counter-trend reversals and riskier scalps. < 5: Not recommended (Too much noise). Ignore Small Candles (ATR %) (Default: 0.5) The "Churn Filter". It ignores any candle smaller than 50% of the average size. Increase to 0.8 if you are getting too many signals during flat/choppy markets. B. Volume Logic Strict Volume (Default: ON) When checked, the script blocks any signal with less than 2.0x average volume, regardless of the score. This ensures you only trade when Whales are actually present. 4. How to Read the Signals 🟢 Bullish Signal (Buy) Symbol: Green Triangle below the bar. Condition: Score ≥ 8. The Whale absorbed selling pressure (Wick) on high volume, likely creating a "Bear Trap." Ideal Setup: Price is Above the Blue Line (VWAP) + Green Arrow. Stop Loss: Just below the low of the signal candle (the wick). 🔴 Bearish Signal (Sell) Symbol: Red Triangle above the bar. Condition: Score ≥ 8. The Whale absorbed buying pressure (Wick) on high volume, likely creating a "Bull Trap." Ideal Setup: Price is Below the Blue Line (VWAP) + Red Arrow. Stop Loss: Just above the high of the signal candle. 🔵 Blue Line (VWAP) This is your "Trend Anchor." Do not Short if price is significantly above the Blue Line. Do not Long if price is significantly below the Blue Line. 5. Troubleshooting / FAQ Q: Why did a signal disappear? A: The script repaints only during the live candle. Once a candle closes, the signal is permanent. If a signal vanishes before close, it means the volume or price action changed last second (e.g., the candle turned Red, triggering the -3 penalty). Q: Why are there no signals on my chart? A: You are likely in a low-volume period (Lunch hour / Late night). The Strict Volume filter is doing its job by keeping you out of dead markets. Alternatively, lower the Minimum Score to 6. Q: Can I use this on 1-minute timeframes? A: Yes, but increase the ATR Filter to 0.6 or 0.7 to filter out the micro-noise common on 1m charts. Chỉ báocủa zakariya_elaljCập nhật 160
VWAP Timeframe Continuity (Multi-Period Anchored VWAP Alignment)Visualizes full timeframe continuity using anchored VWAPs from multiple periods — Yearly (12M), Quarterly (3M), Monthly, Weekly, Daily, 4H, 1H, 30m, and 15m (selectable). Green candles & upper composite line: Price above all selected VWAPs → strong bullish alignment Red candles & lower composite line: Price below all → strong bearish alignment Gray/neutral: Mixed signals Includes flip labels, customizable colors, and alerts when full continuity starts (up or down). Great for trend confirmation, avoiding counter-trend trades, and spotting institutional bias across horizons. Toggle timeframes in settings to match your style! (Pro tip: Longer anchors like Yearly/Quarterly carry more weight for swing/position trading.)Chỉ báocủa northfieldwhale31
SuperTrend - With Exits & Trade ZonesSuperTrend - With Exits & Trade Zones Overview An advanced trend-following indicator that combines pivot points with the SuperTrend methodology to create a complete trading system with entry signals, exit signals, and visual trade zones. This indicator adapts to market structure rather than just price action, providing more reliable trend identification. What Makes This Unique Unlike standard SuperTrend indicators that use moving averages, this version: Uses actual pivot points to calculate a dynamic center line Provides multiple entry mode options for different trading styles Shows clear exit signals (both trailing stop and take profit) Color-codes the entire chart into trade zones (Long, Short, No Trade) Eliminates guesswork about when to enter, exit, and stay out Features 📊 Core Indicator Components Pivot Point Detection: Identifies local highs and lows in price structure Dynamic Center Line: Weighted calculation using detected pivot points ATR-Based Bands: Volatility-adjusted upper and lower bands Trailing Stop Line: Adaptive stop-loss that follows the trend 🎯 Entry Signals Four entry modes to match your trading style: Immediate Mode ⚡ Signals right when the trailing stop breaks Fastest entries for aggressive traders Best for strong trending markets Aggressive Mode 🔥 (Recommended) Signals when price closes beyond break candle OR opens beyond it Balanced speed and confirmation Good for most market conditions Balanced Mode ⚖️ Requires entire candle to close beyond break level Moderate confirmation Reduces false breakouts Conservative Mode 🛡️ Waits for candle to open AND stay completely beyond break level Highest confirmation, slowest entries Best for choppy markets 🚪 Exit Signals Three exit strategies: Trailing Stop Exits when price crosses back through the trailing stop line Lets profits run in trending markets Protects gains when trend weakens Take Profit % Exits at predetermined profit target Locks in gains at specific percentage Good for range-bound markets Both Uses whichever exit comes first Combines profit protection with trend following Recommended for most traders 🎨 Visual Trade Zones Color-coded backgrounds eliminate confusion: 🟢 Light Green: Active LONG position 🔴 Light Red: Active SHORT position ⚫ Gray: NO TRADE ZONE (between exit and next signal) 📍 Additional Visual Elements Diamond markers: Show when trailing stop is first broken BUY/SELL labels: Clear entry signals in green/red EXIT markers: Gray X for stop loss, Orange X (TP) for take profit Pivot points: Optional display of detected highs/lows (H/L markers) Support/Resistance: Optional circles at pivot levels Settings & Parameters Basic Settings Pivot Point Period (default: 2) Controls sensitivity of pivot detection Lower = more pivots detected (more responsive) Higher = fewer pivots (more stable) ATR Factor (default: 3) Distance multiplier for trailing stop bands Lower = tighter stops (more signals, earlier exits) Higher = wider stops (fewer signals, longer trades) ATR Period (default: 10) Lookback period for volatility calculation Affects how quickly bands adapt to volatility changes Entry Configuration Entry Mode: Select from Immediate/Aggressive/Balanced/Conservative Determines how quickly the indicator generates signals after a trend break Exit Configuration Exit Method: Choose Trailing Stop, Take Profit %, or Both Take Profit % (default: 2%) Set your profit target as percentage of entry price Adjust based on volatility and timeframe Display Options Show Buy/Sell Labels: Toggle entry signal labels Show Exit Signals: Toggle exit markers Show Break Candles: Toggle diamond markers on trend breaks Show Pivot Points: Display H/L markers at pivot points Show PP Center Line: Display the dynamic center line Show Support/Resistance: Display circles at S/R levels How to Use For Swing Traders Set Entry Mode to "Balanced" or "Conservative" Use "Both" exit method with 3-5% take profit Enable all visual elements for complete market picture Trade only in direction of colored zones For Day Traders Set Entry Mode to "Aggressive" or "Immediate" Use "Trailing Stop" exit method to catch intraday trends Lower ATR Factor to 2-2.5 for tighter stops Watch for quick signals in the first 2 hours of trading For Position Traders Use higher timeframes (Daily/Weekly) Set Entry Mode to "Conservative" Increase Take Profit % to 5-10% Use larger ATR Factor (4-5) for wider stops General Trading Rules ✅ DO: Enter on BUY/SELL signals (green/red backgrounds) ✅ DO: Exit on EXIT/TP markers ❌ DON'T: Enter during gray NO TRADE ZONE ❌ DON'T: Counter-trend trade against the colored zone Alerts Set up the following alerts for automated trading notifications: Buy Signal: Triggers when long entry conditions are met Sell Signal: Triggers when short entry conditions are met Exit Long: Triggers when long position should be closed Exit Short: Triggers when short position should be closed Trailing Stop Broken: Triggers on initial trend change Best Practices Timeframe Selection 1-5 min: Scalping (use Immediate/Aggressive mode) 15-60 min: Day trading (use Aggressive/Balanced mode) 4H-Daily: Swing trading (use Balanced/Conservative mode) Weekly: Position trading (use Conservative mode) Risk Management Always use the EXIT signals - don't hold through gray zones Position size based on distance to trailing stop Never risk more than 1-2% per trade Consider wider stops on higher timeframes Market Conditions Trending markets: Use Aggressive mode, Trailing Stop exits Ranging markets: Use Conservative mode, Take Profit exits High volatility: Increase ATR Factor, use Both exits Low volatility: Decrease ATR Factor for tighter stops Technical Details Calculation Method Detect pivot highs and lows using specified period Calculate weighted center line: (previous_center × 2 + new_pivot) / 3 Calculate bands: Upper = Center - (ATR Factor × ATR), Lower = Center + (ATR Factor × ATR) Determine trend based on price position relative to bands Trail stop line follows the active trend direction Signal Logic Entry signals generated based on selected confirmation mode Position tracking maintains state from entry to exit Exit signals calculated from both trailing stop and take profit levels Trade zones update in real-time based on position state Limitations & Considerations Works best in trending markets; may generate false signals in tight ranges Not a holy grail - should be used with proper risk management Past performance does not guarantee future results Recommended to backtest on your specific instrument and timeframe Consider combining with volume analysis or other indicators for confirmation Version History v1.0: Initial release with entry signals and confirmation modes v1.1: Added exit signals (trailing stop and take profit) v1.2: Added color-coded trade zones (Long/Short/No Trade) Credits Original Pivot Point SuperTrend concept by LonesomeTheBlue Modified with exit signals and trade zone visualization License Mozilla Public License 2.0 Example Setups Conservative Swing Trading Pivot Point Period: 2 ATR Factor: 3 ATR Period: 10 Entry Mode: Conservative Exit Method: Both Take Profit %: 4% Aggressive Day Trading Pivot Point Period: 2 ATR Factor: 2.5 ATR Period: 10 Entry Mode: Aggressive Exit Method: Trailing Stop Position Trading Pivot Point Period: 3 ATR Factor: 4 ATR Period: 14 Entry Mode: Balanced Exit Method: Both Take Profit %: 8% Disclaimer: This indicator is for educational purposes only. Trading involves substantial risk. Always do your own research and never trade with money you cannot afford to lose.Chỉ báocủa TapaspattanaikCập nhật 396
CARIBEIndicador pirata para surcar el mar caribe y encontrar el tesoro Chỉ báocủa odelcastCập nhật 36
Key Zone$ - Support and Resistance0DTE Bounce Zones (6M) — Support & Resistance with VWAP, Volume, and Risk Management This indicator is built for intraday and 0DTE options trading, focused on high-quality bounce and rejection setups at historically proven support and resistance zones. It automatically identifies key zones from six months of historical price action and waits for real-time confirmation before signaling CALL or PUT opportunities. The goal is to reduce noise, avoid weak bounces, and provide clear, rules-based trade structure. ==================================================================== CORE FEATURES ==================================================================== Historical Support & Resistance Zones (6 Months) Zones are built using 15-minute pivot highs and lows. A zone must be tested at least 3 times to be considered valid. Nearby zones are merged automatically to reduce clutter. Zones extend forward in time and update dynamically. Support zones are shown in green, resistance zones in red. These are higher-quality structural levels, not same-day levels. ==================================================================== 0DTE-Focused Entry Logic Signals only trigger when price interacts with a confirmed zone and shows a strong rejection candle. Signals are limited to high-probability trading windows only. Market Open: 9:30–10:45 ET Market Close: 3:00–4:00 ET This avoids midday chop and focuses on periods with real momentum. ==================================================================== VWAP Confirmation (Strict) CALL setups require a VWAP reclaim. PUT setups require a VWAP loss. This aligns trades with institutional order flow instead of counter-trend noise. ==================================================================== MACD Momentum Filter MACD histogram behavior is used to confirm momentum direction and avoid taking bounces against the prevailing move. ==================================================================== ATR Candle Strength Filter The signal candle must be large enough relative to ATR. This filters out weak or indecisive candles that often fail with 0DTE. ==================================================================== Advanced Volume Confirmation (Relative Volume) Relative Volume (RVOL) is used instead of raw volume. Different RVOL thresholds are applied for CALLS versus PUTS. Higher RVOL is required for PUTS due to downside urgency. Lower RVOL is allowed for CALLS due to grind-up behavior. Separate RVOL thresholds are used for the market open and market close. This ensures signals only occur when real participation is present. ==================================================================== Built-In Risk Management (2:1 Reward/Risk) Every signal automatically calculates an entry, stop loss, and target. Stop loss is based on the zone edge with an ATR buffer. Targets default to a 2:1 reward-to-risk ratio. Entry, stop, and target levels are drawn directly on the chart and included in alerts. ==================================================================== Smart Alerts (CALLS & PUTS) Alerts trigger only when all conditions are met. Alerts include trade direction, entry price, stop price, target price, and RVOL information. Alerts are designed for 5-minute confirmation trading. To use alerts, select “Any alert() function call” when creating the alert. ==================================================================== INTENDED USE ==================================================================== 0DTE options trading. 5-minute chart confirmation. Index ETFs and liquid equities such as SPY, QQQ, IWM, and SPX. Traders who want aggressive entries with confirmation. Traders who value structure, volume, and risk control. ==================================================================== NOTES ==================================================================== This is not a prediction tool. Signals require discipline and confirmation. Best results come from trading only the highest-quality setups.Chỉ báocủa SE3922339
NeuraEdge ORB - Opening Range Breakout IndicatorOVERVIEW NeuraEdge ORB is an open-source Opening Range Breakout indicator that automates the classic 15-minute ORB strategy. The indicator tracks the first 15 minutes of market action (9:30-9:45 AM ET), identifies breakouts above or below this range, and generates trading signals with automated stop loss and take profit calculations. The Opening Range Breakout concept is based on the observation that the initial price action after market open often establishes directional bias for the trading session, as institutional order flow and overnight gap reactions manifest during this window. CORE METHODOLOGY Opening Range Construction: The indicator uses session-based time detection to identify the 9:30-9:45 AM Eastern Time window. During this period, it tracks the highest high and lowest low to establish the opening range boundaries. The range is marked complete when the 15-minute window closes. Calculation process: OR High = Maximum high value during the 15-minute window OR Low = Minimum low value during the 15-minute window OR Midpoint = (OR High + OR Low) / 2 Range Size = OR High - OR Low (compared to 14-period ATR for context) Breakout Detection: The indicator identifies breakouts using close-price confirmation to reduce false signals from wicks: Bullish breakout: Close above OR High (with previous close at or below OR High) Bearish breakout: Close below OR Low (with previous close at or above OR Low) The indicator tracks whether each direction has already broken to prevent duplicate signals on the same range. Entry Type Logic: Two entry methodologies are supported: Breakout Mode - Signals immediately upon range break. Enters on the breakout bar when close confirms direction. Retest Mode - Waits for price to break the range, then pullback to touch the range level before entering. Cancels if price moves too far beyond midpoint. This provides better entry prices with tighter stop losses. Volume Confirmation: Optional volume filter compares current bar volume to 20-period simple moving average. Requires volume > 1.2x average to validate breakout strength and filter low-conviction moves. Fair Value Gap (FVG) Integration: Optional confluence filter that checks for unfilled FVG in the breakout direction: Bullish FVG detected when: current bar's low > two bars ago high (creating gap) Bearish FVG detected when: current bar's high < two bars ago low (creating gap) Minimum FVG size: 0.3x ATR to filter noise FVG considered filled when price retraces to gap midpoint Signals only generate when an unfilled FVG exists in the breakout direction, adding institutional order flow confluence. Risk Management Calculations: Three stop loss placement methods: Opposite Side - SL at opposite end of opening range (classic ORB approach) Midpoint - SL at range midpoint (tighter risk, lower reward potential) ATR Based - SL at 1.5x ATR from entry (adaptive to volatility) Take profit calculated as: Entry ± (Entry - Stop Loss) × Risk:Reward Ratio Default 1.5:1 R:R ratio, adjustable from 1.0 to 5.0. Performance Tracking: The indicator maintains a trade history using Pine Script's type system: Records entry price, stop loss, take profit, and direction for each signal Tracks outcome when price hits stop loss or take profit levels Auto-closes after 80 bars if neither level hit Calculates rolling win rate from last 50 trades maximum Displays W/L record in real-time dashboard VISUAL COMPONENTS Opening Range Box: Semi-transparent blue box drawn from range start bar to current bar + 20, showing the established range boundaries visually. Range Levels: Green line at OR High (potential long entry level) Red line at OR Low (potential short entry level) Gray dotted line at OR Midpoint (reference level) All lines extend 50 bars forward for anticipation. Trade Signals: Green up arrow with "LONG ORB Break" label below price Red down arrow with "SHORT ORB Break" label above price Dashed lines showing SL and TP levels extending 30 bars Small labels marking SL and TP endpoints Real-Time Dashboard: Top-right panel displaying: OR formation status (Forming / Complete / Waiting) Current OR High, Low, and Range size (with ATR multiple) Breakout status (Long / Short / None) Volume status (High / Normal) FVG presence (Bull / Bear / None) Entry settings (Breakout/Retest, R:R, SL type) Win rate percentage and W/L record PRACTICAL APPLICATION Ideal Market Conditions: Liquid instruments: SPY, QQQ, IWM, high-volume stocks Recommended timeframes: 1-minute or 5-minute charts for precise entries Most effective during trending days with clear directional bias Range size between 0.5-1.5x ATR typically provides best risk:reward Usage Workflow: Apply indicator at market open (9:30 AM ET) Observe range formation during first 15 minutes Wait for "Complete" status in dashboard Monitor for breakout signals with volume/FVG confirmation Enter on signal, place stop loss and take profit as marked Avoid taking opposing signals on same day (trend following approach) Retest vs Breakout Selection: Use Breakout mode on high-momentum days with strong overnight gaps Use Retest mode on slower days or when seeking better entry prices Retest mode reduces signal frequency but improves entry quality Time-of-Day Considerations: The indicator includes a trading cutoff setting (default 3:00 PM ET) to avoid late-day chop and reduced liquidity. First-hour breakouts (10:00-11:00 AM) historically show strongest follow-through. SETTINGS & CUSTOMIZATION Display Options: Toggle signals, opening range box, and dashboard independently Clean visual design to reduce chart clutter Opening Range Settings: Opening range duration (5-60 minutes in 5-minute increments) Default 15 minutes aligns with classic ORB methodology Trading cutoff hour (10-16, representing 10:00 AM - 4:00 PM ET) Entry Configuration: Entry type (Breakout / Retest) Volume confirmation toggle (requires 1.2x average volume) FVG confluence toggle (requires unfilled gap in breakout direction) Risk Management: Stop loss placement (Opposite Side / Midpoint / ATR Based) Risk:reward ratio (1.0 - 5.0, default 1.5) Future: Trail stop after partial TP (currently placeholder) Alert System: Five alert conditions available: Opening Range Complete ORB Long Signal ORB Short Signal Breakout Up (range broken, regardless of signal) Breakout Down (range broken, regardless of signal) BEST PRACTICES Recommended Usage: Focus on highly liquid instruments with tight spreads Use 1-5 minute charts for entry precision Respect calculated stop losses (range defines maximum risk) Typically 1-2 quality setups per day maximum Consider overall market trend (SPY/QQQ direction) Risk Considerations: Very small ranges (< 0.3x ATR) prone to false breakouts Very large ranges (> 2x ATR) may indicate gap day requiring adjusted expectations Low volume breakouts fail more frequently Avoid trading both directions on same day (pick strongest setup) IMPORTANT DISCLOSURES This indicator is provided free and open-source for educational purposes. The Opening Range Breakout strategy is a well-documented public domain trading concept. This implementation adds automation, visual clarity, and optional confluence filters. No indicator guarantees profitable trades. Past performance does not predict future results. Traders are responsible for their own trading decisions and risk management. Always use appropriate position sizing and never risk more than you can afford to lose.Chỉ báocủa Darkmatter513Cập nhật 116
Timeframe-Independent Anchored VWAPAn anchored VWAP (Volume Weighted Average Price) that produces identical values (down to the tick!) across different timeframes (unlike, for example, TradingView's built-in Anchored VWAP). Advantages This indicator calculates identical values whether you view it on 1m, 5m, 15m, or any other timeframe within reasonable ranges. Even challenging non-integer timeframe ratios like calculating on 2m while viewing on 3m are handled perfectly. In High or Low mode, VWAP will anchor precisely at the selected candle's high/low. As usual for AVWAP, up to 3 standard deviation bands are supported. How to Use Setting the Anchor: When the indicator is added, select your anchor time. This is typically placed at a significant swing high/low or session open. Source Selection: Choose whether to anchor from High, Low, or Close price. Calculation Timeframe: Select the timeframe used for VWAP calculation. For intraday trading (1m-1H charts): Just keep the default setting (1m) For swing trading (4H-D charts): Use 5m or 15m calculation timeframe For position trading (D-W charts): Use 1H calculation timeframe Important: Lower calculation timeframes provide more precise data but may hit Pine Script's bar limit on very long timeframes Standard Deviation Bands: Enable additional band sets as needed for your trading style. Technical Implementation The indicator achieves timeframe independence through the following algorithm: Lower Timeframe Sampling: Uses Pine Script's request.security_lower_tf() to retrieve bar data at the specified calculation timeframe, regardless of the viewing timeframe. This provides consistent data resolution across all chart timeframes. Anchor Detection: Scans the lower timeframe data to identify the exact bar containing the selected anchor price. The algorithm handles both simple cases (where anchor falls on a complete bar) and complex cases (where anchor falls within a split bar in non-integer timeframe ratios like calculating on 2m while viewing on 3m). FIFO Buffer Management: Maintains a First-In-First-Out buffer of lower timeframe bars. On each chart bar: Adds new lower timeframe bars to the buffer Processes exactly one period worth of bars (matching the viewing timeframe) Removes processed bars from the buffer This approach ensures consistent calculation regardless of viewing timeframe. First Bar Initialization: On the anchor bar, processes only the single anchor bar to ensure the VWAP starts exactly at the anchor price. Subsequent bars process the full period, maintaining mathematical accuracy. VWAP Calculation: Applies the standard volume-weighted average price formula: VWAP = Σ(Price × Volume) / Σ(Volume) StdDev = √(Σ(Price² × Volume) / Σ(Volume) - VWAP²) All calculations accumulate from the anchor point forward. Visual Continuity: For edge cases where the anchor falls in an incomplete bar (e.g., calculating on 2m while viewing on 3m), displays the anchor price as a visual placeholder until the actual calculation begins on the next bar. This ensures the line always starts visually at the anchor point.Chỉ báocủa StefanReich44
Cross-Exchange VWAP with VAH/VALThis indicator calculates a cross‑exchange VWAP by aggregating price and volume data from up to four major crypto exchanges: Coinbase, Binance, Bybit, and OKX. It also derives Value Area High (VAH) and Value Area Low (VAL) using a volume‑weighted standard deviation around VWAP. What this indicator does Aggregates price × volume and volume from multiple exchanges for the same asset Calculates a single, unified VWAP reflecting broader market activity rather than a single venue Computes VAH and VAL as: VAH = VWAP + k × σ VAL = VWAP − k × σ where σ is the volume‑weighted standard deviation and k is user‑configurable Exchanges supported Coinbase (default quote: USD) Binance (default quote: USDT) Bybit (default quote: USDT) OKX (default quote: USDT) Each exchange can be enabled/disabled individually, and symbol overrides are supported (e.g. BTCUSDT, BTCUSDT.P, ETHUSD). VWAP anchoring options You can choose how VWAP and Value Area reset: Daily (UTC session) Weekly Monthly None (fully cumulative) Manual reset via input toggle This makes it suitable for intraday, swing, and higher‑timeframe analysis. Value Area configuration Standard deviation multiplier (k) is configurable k = 1.0 → ~68% band (default) k ≈ 1.036 → ~70% band (normal assumption) Optional shaded VAL–VAH area for quick visual context Note: VAH/VAL are derived from VWAP ± σ, not from a full volume‑profile histogram. This approach is computationally efficient and stable for real‑time trading. Optional status table An optional table (top‑right) displays: Enabled exchanges Active trading pairs per exchange Volume availability status Useful for quickly validating data coverage. Intended use cases Institutional‑style VWAP analysis across venues Reducing single‑exchange bias in crypto trading Identifying fair value, mean reversion zones, and acceptance areas Intraday execution and swing trade context Notes & limitations Availability of symbols may vary by exchange (use symbol overrides if needed) Crypto sessions are UTC‑based for daily resets Not a true Market Profile / volume‑at‑price VA calculationChỉ báocủa pivottrader8813
NY VWAP 2std to 3std Probabilities + Exit ZonesHow it works: Time buckets Early: 10:30 – 12:00 Mid: 12:00 – 14:00 Late: 14:00 – 16:00 Bands 2σ band (s2up / s2dn) → this is where the “potential breakout” starts. 3σ band (s3up / s3dn) → this is the “target” for the 2→3σ move. Counting logic If during a given bucket, the price touches the 2σ band, it counts as a 2σ hit. If after that, in the same bucket, the price also touches the 3σ band, it counts as a 3σ hit. Probability calculation \text{Probability 2→3σ} = \frac{\text{# of 3σ hits}}{\text{# of 2σ hits}} \times 100 For example, if in the late session the lower 2σ band is hit 10 times, and of those 10 times, 6 eventually hit the lower 3σ band, the script will show 60%. Labels / lines On the chart, Upper/Lower 2→3σ probabilities are displayed per bucket. So yes: “Late Lower 2σ → 3σ: 60%” means: if price touches the lower 2σ band in the late session, historically, 60% of those touches continued to the 3σ band. ⚠ Important caveats: These are historical probabilities, not predictions. Small sample sizes in a bucket can make percentages unstable early in the day. The script only counts session NY bars (0930–1600) and ignores pre-10:30 hits to reduce opening volatility noise.Chỉ báocủa seanhillis974
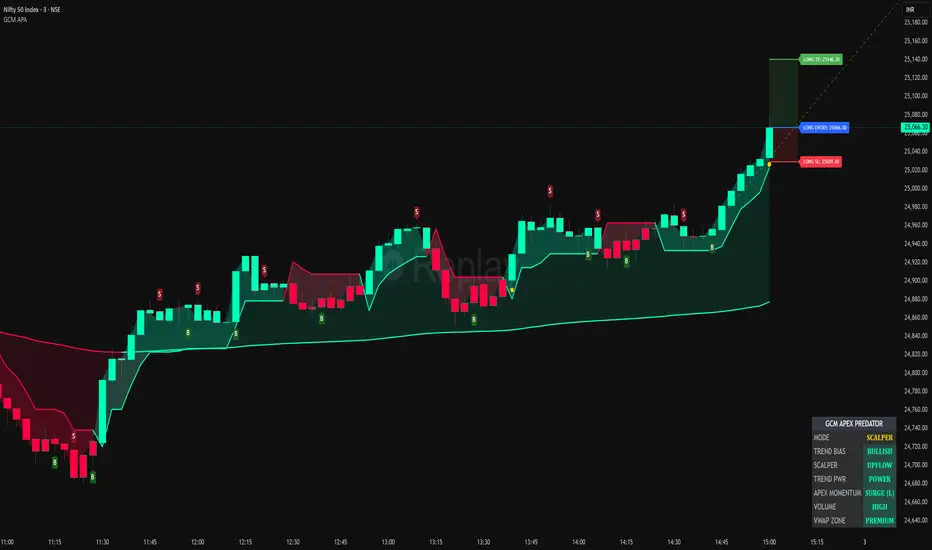
VWAP Gravity Oscillator (VGO) (Intraday Only)VWAP Gravity Oscillator (VGO) The VWAP Gravity Oscillator (VGO) is an intraday analytical indicator designed to quantify price displacement from VWAP and the rate of change of that displacement. The indicator models VWAP as a statistical equilibrium level and evaluates: Price deviation from VWAP (Delta) Momentum and acceleration of that deviation via MACD This framework enables assessment of trend persistence versus mean-reversion pressure in intraday price action. Methodology VWAP Delta Measures the signed distance between price and VWAP, representing directional bias relative to equilibrium. MACD on Delta Captures the first- and second-order dynamics of VWAP deviation, highlighting acceleration, deceleration, and potential inflection points. Zero Line Represents price–VWAP equilibrium. Crossings may indicate regime transitions. Interpretation Guidelines Positive Delta Price is trading above VWAP with positive directional bias. Negative Delta Price is trading below VWAP with negative directional bias. Increasing MACD Expansion of VWAP deviation (trend reinforcement). Decreasing or reversing MACD Contraction of VWAP deviation (mean-reversion risk). Intended Applications Intraday trend validation Early detection of trend exhaustion Mean-reversion risk assessment Filtering low-conviction or balanced market conditions Implementation Notes Designed exclusively for intraday timeframes Automatically suppressed on higher-timeframe charts Intended as a contextual analysis tool, not a standalone signal generator Conceptual Summary VGO evaluates whether price is diverging from, stabilising around, or reverting toward VWAP by analysing both displacement and its rate of change.Chỉ báocủa gokul4tradingCập nhật 1139
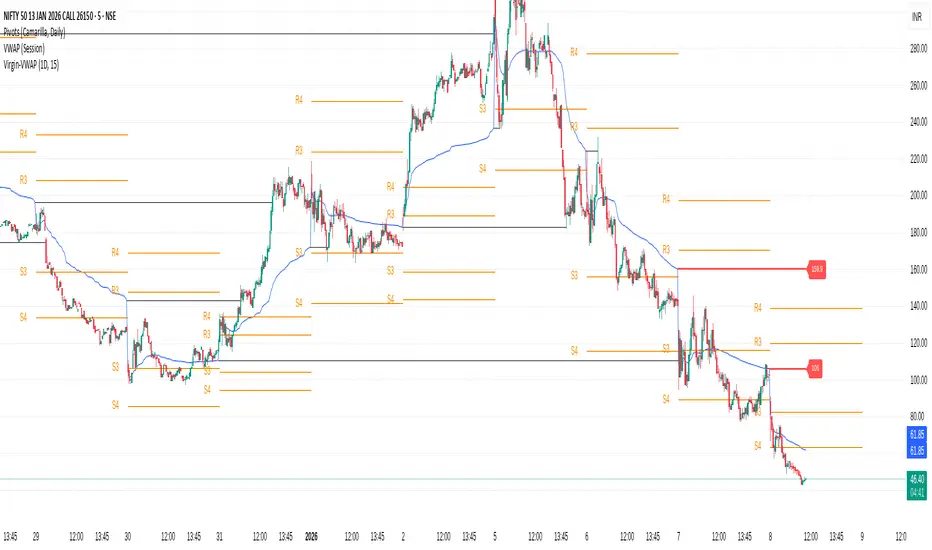
Virgin-VWAPThis draws the Virgin levels of VWAP. It gives a visual representation of Volume-Weighted Gap Map. Visual "Fill": It looks like a "Gap Fill" indicator. The lines will look like rectangles or "beams" shooting across the chart, stopping exactly where the market "filled" that price level. Trimmed lines: The virgin line gets trimmed once touched. This tells you: "This level was hit, it might still be support/resistance, but the 'Virgin' status is gone." Terminal Labels: A vigin vwap lines carries the price label so ones can see the strike's value at a glance. Clean Forward Space: Because the lines stop when touched, your "future" chart (the empty space to the right) won't be cluttered with old lines that are no longer relevant. You will only see the lines for levels that haven't been hit yet extending into the empty space. Was built for NSE options in mind, seeing those "beams" of historical value stop exactly where price met them is a powerful way to visualize where the market has found "fair value" versus where there are still "unfilled orders." PS: Built with Gemini 3!! Chỉ báocủa gokoffline52
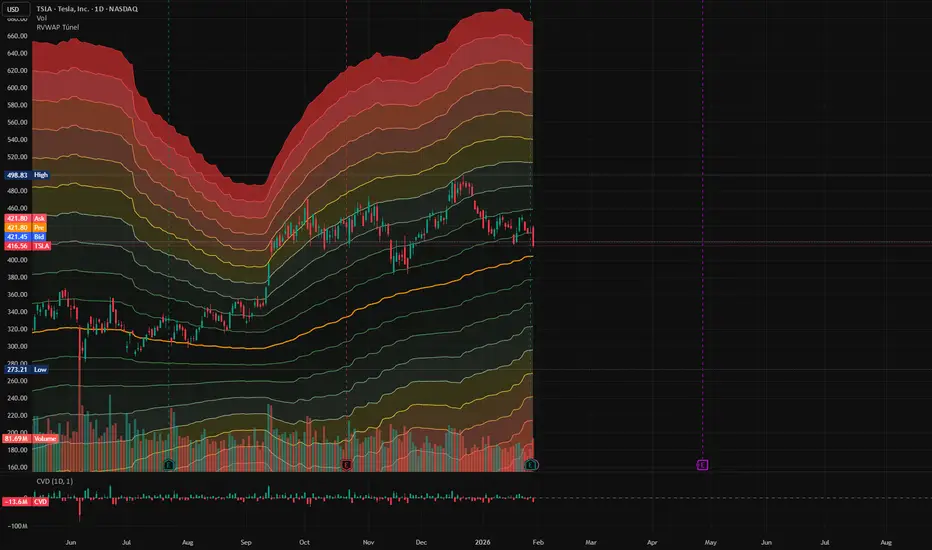
Volume-Weighted Hybrid Channel [Capitalize Labs]Volume-Weighted Hybrid Channel (VWHC) is a channel-only indicator designed to visualise mean and volatility structure using a blended framework. It combines a configurable mean engine (SuperSmoother, EMA, SMA, or RMA) with an anchored VWAP component, then builds a four-level band ladder around a hybrid mean using a hybrid width that blends a range engine (ATR or true range variants) with anchored, volume-weighted standard deviation. The result is a smooth, adaptive channel intended to help us contextualise price location and volatility expansion or contraction relative to the hybrid mean. The indicator supports Weekly or Session anchoring for the VWAP and sigma components, and includes optional transition smoothing after anchor resets to reduce visual stepping. Band levels are user-defined (with automatic ordering enforcement), and optional gradient fills can be enabled for clearer zone recognition. An optional Band Occupancy Table is included to show how frequently price closes inside each zone, either over a rolling lookback or since the most recent anchor reset. This table is informational only and does not generate signals. This script is an indicator, not a strategy. It does not place trades, generate alerts, or provide entry or exit instructions. Outputs depend on chart symbol, timeframe, and data quality, including volume availability. The channel is designed to be non-repainting in the sense that it uses confirmed bar data and does not use forward-looking logic; however, like all indicators, the current bar can update until it closes. Risk Warning This material is educational research only and does not constitute financial advice, investment recommendation, or a solicitation to buy or sell any instrument. Foreign exchange and CFDs are complex, leveraged products that carry a high risk of rapid losses; leverage amplifies both gains and losses, and you should not trade with funds you cannot afford to lose. Market conditions can change without notice, and news or illiquidity may cause gaps and slippage; stop-loss orders are not guaranteed. The analysis presented does not take into account your objectives, financial situation, or risk tolerance. Before acting, assess suitability in light of your circumstances and consider seeking advice from a licensed professional. Past performance and back-tested or hypothetical scenarios are not reliable indicators of future results, and no outcome or level mentioned here is assured. You are solely responsible for all trading decisions, including position sizing and risk management. No external links, promotions, or contact details are provided, in line with TradingView House Rules. Disclaimer Use of this indicator is at our own discretion and risk. It is a visual analysis tool and should be validated through independent testing and a documented trading plan before being used in live decision-making.Chỉ báocủa CapitalizeLabs27
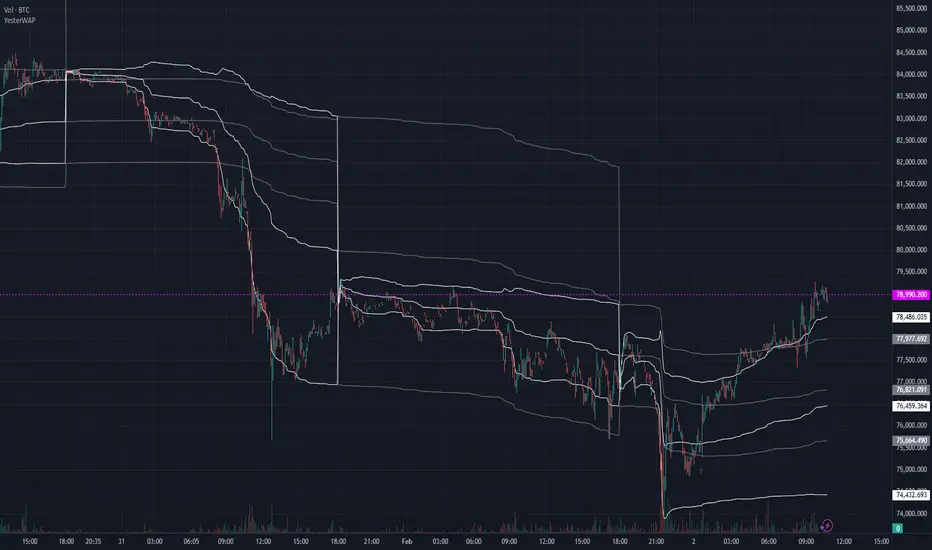
VWAP Pro [Capitalize Labs]VWAP Pro is a volume weighted average price indicator designed to provide structured price context across Session, Weekly, and Monthly anchors. It allows users to define custom session templates and apply multiple band calculation methods to help frame price behavior relative to volume weighted levels. The indicator supports Session, Week, and Month anchor periods. Session anchoring can be aligned to user defined templates including RTH, ETH, London, New York, Asia, or a fully custom session, all based on the instrument’s exchange time zone. This allows VWAP to reset at meaningful market boundaries rather than fixed calendar times. VWAP Pro includes three band calculation methods: volume weighted standard deviation, fixed tick distance based on the instrument’s minimum tick size, and ATR based distance. Up to three band levels can be enabled independently, with configurable multipliers and visual settings. A warm up system is included to manage band behavior immediately after a VWAP reset. Bands can either be hidden during the warm up period and appear at full width once complete, or gradually expand from zero to full width over the defined number of bars. The VWAP line itself always plots immediately. Optional prior period reference levels are available for the previous Session, Week, and Month VWAP. These levels represent only fully completed periods and do not update during the current active period. Display of these levels depends on sufficient historical data being loaded to cover the full prior period. The indicator requires valid volume data. Symbols that do not provide volume are not supported. All session definitions and settings should be reviewed and adjusted to match the specific instrument being analyzed. Risk Warning This indicator is provided for educational and analytical purposes only and does not constitute financial advice, an investment recommendation, or a solicitation to buy or sell any financial instrument. Trading involves significant risk and market conditions can change rapidly. Losses can exceed expectations and the use of this indicator does not guarantee any specific outcome or performance. You are solely responsible for your trading decisions, risk management, and compliance with applicable regulations. Past market behavior or indicator signals are not reliable indicators of future results.Chỉ báocủa CapitalizeLabs35
VWAP & EMA9 Cross AlertVWAP & EMA9 Cross Alert Alerts when the 9EMA crossed VWAP with above average volumeChỉ báocủa JulesGornick27
The Systemtable viewed bullish/bearish indicator. uses 9 & 20 ema crossings along with macd & rsi to identify the bullish/bearish trend. ability to toggle vwaps + emas. Goal to consolidate the various indicators for users that don't pay for premium ++Chỉ báocủa MrPeanut626Cập nhật 1142
Chart Wolf WLR Toolkit (VWAP + PDH/PDL + Kill Zone)Overview This indicator is a single, unified trading framework that combines context → levels → confirmation → execution into one workflow. It is not a “mashup” of unrelated indicators — each component feeds the next step of the decision process so you can make the same type of decision every day with less chart clutter. What makes it original Most indicators independently display signals (trend, sessions, levels, etc.). This script is original in that it links components into a structured sequence: Context (where and when): identifies market session/time context and key reference zones. Key Levels (what matters): plots specific levels that price reacts to (e.g., previous day levels, value area levels, VWAP / anchors, etc.). Confirmation (why now): requires price behavior to confirm acceptance/rejection around those levels instead of firing signals randomly. Execution (how to trade it): provides clear entry/exit visualization and risk reference points once confirmation conditions are met. How it works (conceptual logic) The script follows a simple cause-and-effect model: Reference levels define “decision areas” (places where liquidity and reactions commonly happen). Price interacting with a decision area triggers state tracking (e.g., approaching level → testing level → rejection/acceptance). A signal only appears when a complete sequence occurs (example: sweep/test → rejection/acceptance confirmation → continuation cue). Optional filters (session, volatility, trend bias, etc.) reduce low-quality signals by requiring trades to occur in the intended conditions. How to use it (step-by-step) Choose your market & timeframe Recommended: use a higher timeframe for context, lower timeframe for entries. Example workflow: 15m for context + 5m/1m for execution. Mark the decision areas Use the plotted levels as “zones of interest.” Your job is to wait for price to interact with these zones. Wait for confirmation Only take signals that occur at or near decision areas. If price is chopping in the middle (between key levels), avoid trading. Execute with defined risk Stops should be placed beyond the rejection/sweep point or beyond the decision zone (depending on your strategy). Targets can be the next major level plotted by the script. Settings (what to adjust) Session filter: turn on if you only trade specific hours (e.g., NY open). Level visibility: hide levels you don’t use to reduce clutter. Signal strictness: increase strictness to reduce frequency and improve quality; decrease for more signals. Alerts: enable alerts for confirmed signals only (recommended). Best practices This tool performs best when you treat signals as confirmation, not “auto-trades.” Always prioritize trades that occur at major levels during high-liquidity hours. Backtest your market/timeframe combo before using it live. Notes / limitations Like all indicators, it does not predict the future; it organizes decision-making around recurring market behaviors. Signals can appear during news volatility; consider disabling trading during major scheduled events.Chỉ báocủa maybachmoody30
Volume-Weighted Price Z-Score [QuantAlgo]🟢 Overview The Volume-Weighted Price Z-Score indicator quantifies price deviations from volume-weighted equilibrium using statistical standardization. It combines volume-weighted moving average analysis with logarithmic deviation measurement and volatility normalization to identify when prices have moved to statistically extreme levels relative to their volume-weighted baseline, helping traders and investors spot potential mean reversion opportunities across multiple timeframes and asset classes. 🟢 How It Works The indicator's core methodology lies in its volume-weighted statistical approach, where price displacement is measured through normalized deviations from volume-weighted price levels: volumeWeightedAverage = ta.vwma(priceSource, lookbackPeriod) logDeviation = math.log(priceSource / volumeWeightedAverage) volatilityMeasure = ta.stdev(logDeviation, lookbackPeriod) The script uses logarithmic transformation to capture proportional price changes rather than absolute differences, ensuring equal treatment of percentage moves regardless of price level: rawZScore = logDeviation / volatilityMeasure zScore = ta.ema(rawZScore, smoothingPeriod) First, it establishes the volume-weighted baseline which gives greater weight to price levels where significant trading occurred, creating a more representative equilibrium point than simple moving averages. Then, the logarithmic deviation measurement converts the price-to-average ratio into a normalized scale: logDeviation = math.log(priceSource / volumeWeightedAverage) Next, statistical normalization is achieved by dividing the deviation by its own historical volatility, creating a standardized z-score that measures how many standard deviations the current price sits from the volume-weighted mean. Finally, EMA smoothing filters noise while preserving the signal's responsiveness to genuine market extremes: rawZScore = logDeviation / volatilityMeasure zScore = ta.ema(rawZScore, smoothingPeriod) This creates a volume-anchored statistical oscillator that combines price-volume relationship analysis with volatility-adjusted normalization, providing traders with probabilistic insights into market extremes and mean reversion potential based on standard deviation thresholds. 🟢 Signal Interpretation ▶ Positive Values (Above Zero): Price trading above volume-weighted average indicating potential overvaluation relative to volume-weighted equilibrium = Caution on longs, potential mean reversion downward = Short/sell opportunities ▶ Negative Values (Below Zero): Price trading below volume-weighted average indicating potential undervaluation relative to volume-weighted equilibrium = Caution on shorts, potential mean reversion upward = Long/buy opportunities ▶ Zero Line Crosses: Mean reversion transitions where price crosses back through volume-weighted equilibrium, indicating shift from overvalued to undervalued (or vice versa) territory ▶ Extreme Positive Zone (Above +2.5σ default): Statistically rare overvaluation representing 98.8%+ confidence level deviation, indicating extremely stretched bullish conditions with high mean reversion probability = Strong correction warning/short signal ▶ Extreme Negative Zone (Below -2.5σ default): Statistically rare undervaluation representing 98.8%+ confidence level deviation, indicating extremely stretched bearish conditions with high mean reversion probability = Strong buying opportunity signal ▶ ±1σ Reference Levels: Moderate deviation zones (±1 standard deviation) marking common price fluctuation boundaries where approximately 68% of price action occurs under normal distribution ▶ ±2σ Reference Levels: Significant deviation zones (±2 standard deviations) marking unusual price extremes where approximately 95% of price action should be contained under normal conditions 🟢 Features ▶ Preconfigured Presets: Three optimized parameter sets accommodate different analytical approaches, instruments and timeframes. "Default" provides balanced statistical measurement suitable for swing trading and daily/4-hour analysis, offering deviation detection with moderate responsiveness to price dislocations. "Fast Response" delivers heightened sensitivity optimized for intraday trading and scalping on 15-minute to 1-hour charts, using shorter statistical windows and minimal smoothing to capture rapid mean reversion opportunities as they develop. "Smooth Trend" offers conservative extreme identification ideal for position trading on daily to weekly charts, employing extended statistical periods and heavy noise filtering to isolate only the most significant market extremes. ▶ Built-in Alerts: Seven alert conditions enable comprehensive automated monitoring of statistical extremes and mean reversion events. Extreme Overbought triggers when z-score crosses above the extreme threshold (default +2.5σ) signaling rare overvaluation, Extreme Oversold activates when z-score crosses below the negative extreme threshold (default -2.5σ) signaling rare undervaluation. Exit Extreme Overbought and Exit Extreme Oversold alert when prices begin reverting from these statistical extremes back toward the mean. Bullish Mean Reversion notifies when z-score crosses above zero indicating shift to overvalued territory, while Bearish Mean Reversion triggers on crosses below zero indicating shift to undervalued territory. Any Extreme Level provides a combined alert for any extreme threshold breach regardless of direction. These notifications allow you to capitalize on statistically significant price dislocations without continuous chart monitoring. ▶ Color Customization: Six visual themes (Classic, Aqua, Cosmic, Ember, Neon, plus Custom) accommodate different chart backgrounds and visual preferences, ensuring optimal contrast for identifying positive versus negative deviations across trading environments. The adjustable fill transparency control (0-100%) allows fine-tuning of the gradient area prominence between the z-score line and zero baseline, with higher opacity values creating subtle background context while lower values produce bold deviation emphasis. Optional bar coloring extends the z-score gradient directly to the indicator pane bars, providing immediate visual reinforcement of current deviation magnitude and direction without requiring reference to the plotted line itself. *Note: This indicator requires volume data to function correctly, as it calculates deviations from a volume-weighted price average. Tickers with no volume data or extremely limited volume will not produce meaningful results, i.e., the indicator may display flat lines, erratic values, or fail to calculate properly. Using this indicator on assets without volume data (certain forex pairs, synthetic indices, or instruments with unreported/unavailable volume) will produce unreliable or no results at all. Additionally, ensure your chart has sufficient historical data to cover the selected lookback period, e.g., using a 100-bar lookback on a chart with only 50 bars of history will yield incomplete or inaccurate calculations. Always verify your chosen ticker has consistent, accurate volume information and adequate price history before applying this indicator.Chỉ báocủa QuantAlgo1313790
BB + RSI Div + Volume + VWAP (4H Perp Short Alert) - SafeThis Indicator use Bollinger Band + RSI Div + Volumne + VWAP for shorting Mid and Small Cap token in 4H timeframeChỉ báocủa unemployedceoCập nhật 2252
deKoder | VWAP | Volume Weighted Average PriceAn advanced, open-source Volume Weighted Average Price indicator with multi-period anchoring, standard deviation bands, previous period value area extension, comprehensive alerts, and enhanced visual context. This script is a significant upgrade over standard VWAP implementations (including TradingView's built-in VWAP (the basis for this script) and typical community versions). It is designed for experienced intraday, swing, and positional traders who require precise, context-aware mean reference levels with minimal chart clutter. Key Features & Trading Value 1 | Previous Period Value Area Extension Automatically extends the prior anchor period's VWAP and ±1σ bands into the current period as reference lines. Optional translucent fill between the previous ±1σ bands creates a clear "previous value area" zone. Why it matters : The edges of the prior period's value area often act as dynamic support/resistance or mean reversion zones. This visual persistence eliminates manual drawing and provides immediate context for reactions at prior fair value zones. These are especially powerful on intraday charts when using Daily/Weekly/Quarterly anchors. 2 | Comprehensive Approach Alerts Configurable proximity-based alerts trigger when price approaches (from either side) any plotted level: current VWAP, all six deviation bands (±1σ, ±2σ, ±3σ), and previous period VWAP/±1σ value area. Adjustable trigger percentage and minimum bar cooldown prevent alert spam during consolidation. Why it matters : Enables hands-off monitoring of potential mean reversion setups, deviation extremes, or breakout/rejection candidates without constant screen watching. 3 | Additional Professional-Grade Enhancements Flexible Anchor Periods : Daily, Weekly, Monthly, Quarterly (default), Yearly, Decade, Century, plus event-based resets (Earnings, Dividends, Splits). Intelligent Visibility Controls : Hide entire indicator on selected higher timeframes (1H and above). Dynamic distance filter removes off-screen levels (based on % from price). Limit plotting to last X bars for performance and clarity. Real-Time Info Table : Displays current anchor, timeframe, and rounded live values for VWAP and all bands, enabling fast access to precise level values for order placement. Fully customisable position, text size, font (monospace option), and price level decimal rounding. Right-Side Labels with Tooltips : Clean, minimal labels at current levels with hover tooltips allow you to quickly identify the level without cluttering the chart. Customizable Styling : Independently adjustable colours for VWAP and each deviation band pair. Offset support for forward/backward shifting. Recommended Use Cases Intraday Scalping/Mean Reversion : 5m–15m charts with Daily anchor + previous value area as primary reference. Swing Entries : Higher timeframes (1H–4H) using Weekly or Quarterly VWAP for bias, with previous quarter's value area as major confluence. Deviation Trading : Watch for price interaction with ±2σ/±3σ bands combined with approach alerts for potential exhaustion. Institutional Benchmarking : Quarterly/Yearly anchors approximate common institutional VWAP reset periods. Additional Notes Source fixed to hlc3 (industry standard for VWAP). Enjoy cleaner, more contextual VWAP analysis. | | deKoder | | Released December 2025 | Open Source // IF THIS FREE(!) VWAP SCRIPT — OR ANY OF ITS FRIENDS — HAS HELPED YOU BANK SOME COINS... // A COFFEE, LUNCH, OR A FEW SATS GOES A LONG WAY TOWARDS KEEPING THE LIGHTS ON // COFFEE KEEPS THE PINE FLOWING 😉❤️ | FR33FA11 // SOL: 2N8HWPAHSC7Z8SLyneMrZp234UAP9HCtQX7wNXw7LKQC // ETH: 0xE770D254DC579d1db7bA2fe74376b7009527356B // BTC: bc1qd8j3awht5yrjtnvt5dagxldzhaesc83sftype3 // POLYGON: 0xE770D254DC579d1db7bA2fe74376b7009527356B // HYPE: 0xE770D254DC579d1db7bA2fe74376b7009527356BChỉ báocủa FR33FA11Cập nhật 33