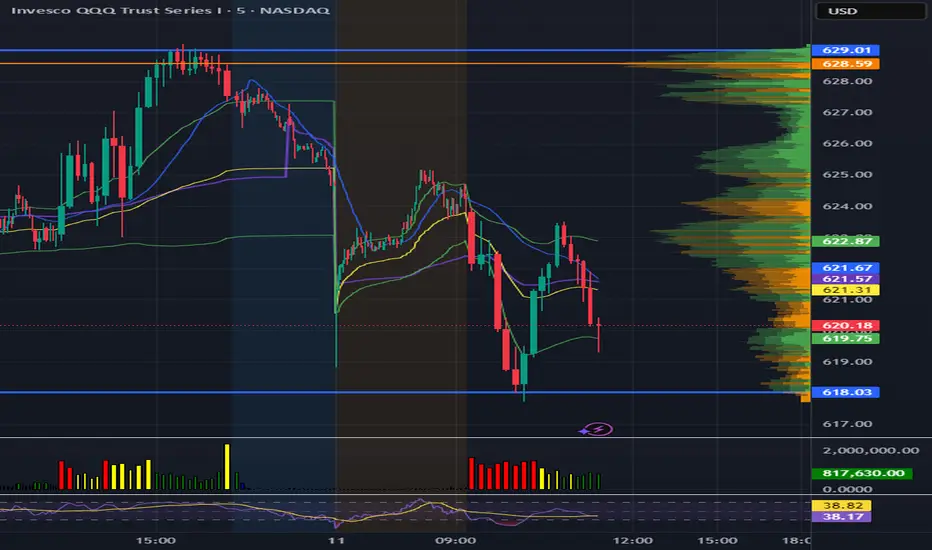
VWAP & EMA9 Cross AlertVWAP & EMA9 Cross Alert Alerts when the 9EMA crossed VWAP with above average volumeChỉ báocủa JulesGornick34
The Systemtable viewed bullish/bearish indicator. uses 9 & 20 ema crossings along with macd & rsi to identify the bullish/bearish trend. ability to toggle vwaps + emas. Goal to consolidate the various indicators for users that don't pay for premium ++Chỉ báocủa MrPeanut626Cập nhật 1142
Chart Wolf WLR Toolkit (VWAP + PDH/PDL + Kill Zone)Overview This indicator is a single, unified trading framework that combines context → levels → confirmation → execution into one workflow. It is not a “mashup” of unrelated indicators — each component feeds the next step of the decision process so you can make the same type of decision every day with less chart clutter. What makes it original Most indicators independently display signals (trend, sessions, levels, etc.). This script is original in that it links components into a structured sequence: Context (where and when): identifies market session/time context and key reference zones. Key Levels (what matters): plots specific levels that price reacts to (e.g., previous day levels, value area levels, VWAP / anchors, etc.). Confirmation (why now): requires price behavior to confirm acceptance/rejection around those levels instead of firing signals randomly. Execution (how to trade it): provides clear entry/exit visualization and risk reference points once confirmation conditions are met. How it works (conceptual logic) The script follows a simple cause-and-effect model: Reference levels define “decision areas” (places where liquidity and reactions commonly happen). Price interacting with a decision area triggers state tracking (e.g., approaching level → testing level → rejection/acceptance). A signal only appears when a complete sequence occurs (example: sweep/test → rejection/acceptance confirmation → continuation cue). Optional filters (session, volatility, trend bias, etc.) reduce low-quality signals by requiring trades to occur in the intended conditions. How to use it (step-by-step) Choose your market & timeframe Recommended: use a higher timeframe for context, lower timeframe for entries. Example workflow: 15m for context + 5m/1m for execution. Mark the decision areas Use the plotted levels as “zones of interest.” Your job is to wait for price to interact with these zones. Wait for confirmation Only take signals that occur at or near decision areas. If price is chopping in the middle (between key levels), avoid trading. Execute with defined risk Stops should be placed beyond the rejection/sweep point or beyond the decision zone (depending on your strategy). Targets can be the next major level plotted by the script. Settings (what to adjust) Session filter: turn on if you only trade specific hours (e.g., NY open). Level visibility: hide levels you don’t use to reduce clutter. Signal strictness: increase strictness to reduce frequency and improve quality; decrease for more signals. Alerts: enable alerts for confirmed signals only (recommended). Best practices This tool performs best when you treat signals as confirmation, not “auto-trades.” Always prioritize trades that occur at major levels during high-liquidity hours. Backtest your market/timeframe combo before using it live. Notes / limitations Like all indicators, it does not predict the future; it organizes decision-making around recurring market behaviors. Signals can appear during news volatility; consider disabling trading during major scheduled events.Chỉ báocủa maybachmoody31
Volume-Weighted Price Z-Score [QuantAlgo]🟢 Overview The Volume-Weighted Price Z-Score indicator quantifies price deviations from volume-weighted equilibrium using statistical standardization. It combines volume-weighted moving average analysis with logarithmic deviation measurement and volatility normalization to identify when prices have moved to statistically extreme levels relative to their volume-weighted baseline, helping traders and investors spot potential mean reversion opportunities across multiple timeframes and asset classes. 🟢 How It Works The indicator's core methodology lies in its volume-weighted statistical approach, where price displacement is measured through normalized deviations from volume-weighted price levels: volumeWeightedAverage = ta.vwma(priceSource, lookbackPeriod) logDeviation = math.log(priceSource / volumeWeightedAverage) volatilityMeasure = ta.stdev(logDeviation, lookbackPeriod) The script uses logarithmic transformation to capture proportional price changes rather than absolute differences, ensuring equal treatment of percentage moves regardless of price level: rawZScore = logDeviation / volatilityMeasure zScore = ta.ema(rawZScore, smoothingPeriod) First, it establishes the volume-weighted baseline which gives greater weight to price levels where significant trading occurred, creating a more representative equilibrium point than simple moving averages. Then, the logarithmic deviation measurement converts the price-to-average ratio into a normalized scale: logDeviation = math.log(priceSource / volumeWeightedAverage) Next, statistical normalization is achieved by dividing the deviation by its own historical volatility, creating a standardized z-score that measures how many standard deviations the current price sits from the volume-weighted mean. Finally, EMA smoothing filters noise while preserving the signal's responsiveness to genuine market extremes: rawZScore = logDeviation / volatilityMeasure zScore = ta.ema(rawZScore, smoothingPeriod) This creates a volume-anchored statistical oscillator that combines price-volume relationship analysis with volatility-adjusted normalization, providing traders with probabilistic insights into market extremes and mean reversion potential based on standard deviation thresholds. 🟢 Signal Interpretation ▶ Positive Values (Above Zero): Price trading above volume-weighted average indicating potential overvaluation relative to volume-weighted equilibrium = Caution on longs, potential mean reversion downward = Short/sell opportunities ▶ Negative Values (Below Zero): Price trading below volume-weighted average indicating potential undervaluation relative to volume-weighted equilibrium = Caution on shorts, potential mean reversion upward = Long/buy opportunities ▶ Zero Line Crosses: Mean reversion transitions where price crosses back through volume-weighted equilibrium, indicating shift from overvalued to undervalued (or vice versa) territory ▶ Extreme Positive Zone (Above +2.5σ default): Statistically rare overvaluation representing 98.8%+ confidence level deviation, indicating extremely stretched bullish conditions with high mean reversion probability = Strong correction warning/short signal ▶ Extreme Negative Zone (Below -2.5σ default): Statistically rare undervaluation representing 98.8%+ confidence level deviation, indicating extremely stretched bearish conditions with high mean reversion probability = Strong buying opportunity signal ▶ ±1σ Reference Levels: Moderate deviation zones (±1 standard deviation) marking common price fluctuation boundaries where approximately 68% of price action occurs under normal distribution ▶ ±2σ Reference Levels: Significant deviation zones (±2 standard deviations) marking unusual price extremes where approximately 95% of price action should be contained under normal conditions 🟢 Features ▶ Preconfigured Presets: Three optimized parameter sets accommodate different analytical approaches, instruments and timeframes. "Default" provides balanced statistical measurement suitable for swing trading and daily/4-hour analysis, offering deviation detection with moderate responsiveness to price dislocations. "Fast Response" delivers heightened sensitivity optimized for intraday trading and scalping on 15-minute to 1-hour charts, using shorter statistical windows and minimal smoothing to capture rapid mean reversion opportunities as they develop. "Smooth Trend" offers conservative extreme identification ideal for position trading on daily to weekly charts, employing extended statistical periods and heavy noise filtering to isolate only the most significant market extremes. ▶ Built-in Alerts: Seven alert conditions enable comprehensive automated monitoring of statistical extremes and mean reversion events. Extreme Overbought triggers when z-score crosses above the extreme threshold (default +2.5σ) signaling rare overvaluation, Extreme Oversold activates when z-score crosses below the negative extreme threshold (default -2.5σ) signaling rare undervaluation. Exit Extreme Overbought and Exit Extreme Oversold alert when prices begin reverting from these statistical extremes back toward the mean. Bullish Mean Reversion notifies when z-score crosses above zero indicating shift to overvalued territory, while Bearish Mean Reversion triggers on crosses below zero indicating shift to undervalued territory. Any Extreme Level provides a combined alert for any extreme threshold breach regardless of direction. These notifications allow you to capitalize on statistically significant price dislocations without continuous chart monitoring. ▶ Color Customization: Six visual themes (Classic, Aqua, Cosmic, Ember, Neon, plus Custom) accommodate different chart backgrounds and visual preferences, ensuring optimal contrast for identifying positive versus negative deviations across trading environments. The adjustable fill transparency control (0-100%) allows fine-tuning of the gradient area prominence between the z-score line and zero baseline, with higher opacity values creating subtle background context while lower values produce bold deviation emphasis. Optional bar coloring extends the z-score gradient directly to the indicator pane bars, providing immediate visual reinforcement of current deviation magnitude and direction without requiring reference to the plotted line itself. *Note: This indicator requires volume data to function correctly, as it calculates deviations from a volume-weighted price average. Tickers with no volume data or extremely limited volume will not produce meaningful results, i.e., the indicator may display flat lines, erratic values, or fail to calculate properly. Using this indicator on assets without volume data (certain forex pairs, synthetic indices, or instruments with unreported/unavailable volume) will produce unreliable or no results at all. Additionally, ensure your chart has sufficient historical data to cover the selected lookback period, e.g., using a 100-bar lookback on a chart with only 50 bars of history will yield incomplete or inaccurate calculations. Always verify your chosen ticker has consistent, accurate volume information and adequate price history before applying this indicator.Chỉ báocủa QuantAlgo1616821
BB + RSI Div + Volume + VWAP (4H Perp Short Alert) - SafeThis Indicator use Bollinger Band + RSI Div + Volumne + VWAP for shorting Mid and Small Cap token in 4H timeframeChỉ báocủa unemployedceoCập nhật 2257
deKoder | VWAP | Volume Weighted Average PriceAn advanced, open-source Volume Weighted Average Price indicator with multi-period anchoring, standard deviation bands, previous period value area extension, comprehensive alerts, and enhanced visual context. This script is a significant upgrade over standard VWAP implementations (including TradingView's built-in VWAP (the basis for this script) and typical community versions). It is designed for experienced intraday, swing, and positional traders who require precise, context-aware mean reference levels with minimal chart clutter. Key Features & Trading Value 1 | Previous Period Value Area Extension Automatically extends the prior anchor period's VWAP and ±1σ bands into the current period as reference lines. Optional translucent fill between the previous ±1σ bands creates a clear "previous value area" zone. Why it matters : The edges of the prior period's value area often act as dynamic support/resistance or mean reversion zones. This visual persistence eliminates manual drawing and provides immediate context for reactions at prior fair value zones. These are especially powerful on intraday charts when using Daily/Weekly/Quarterly anchors. 2 | Comprehensive Approach Alerts Configurable proximity-based alerts trigger when price approaches (from either side) any plotted level: current VWAP, all six deviation bands (±1σ, ±2σ, ±3σ), and previous period VWAP/±1σ value area. Adjustable trigger percentage and minimum bar cooldown prevent alert spam during consolidation. Why it matters : Enables hands-off monitoring of potential mean reversion setups, deviation extremes, or breakout/rejection candidates without constant screen watching. 3 | Additional Professional-Grade Enhancements Flexible Anchor Periods : Daily, Weekly, Monthly, Quarterly (default), Yearly, Decade, Century, plus event-based resets (Earnings, Dividends, Splits). Intelligent Visibility Controls : Hide entire indicator on selected higher timeframes (1H and above). Dynamic distance filter removes off-screen levels (based on % from price). Limit plotting to last X bars for performance and clarity. Real-Time Info Table : Displays current anchor, timeframe, and rounded live values for VWAP and all bands, enabling fast access to precise level values for order placement. Fully customisable position, text size, font (monospace option), and price level decimal rounding. Right-Side Labels with Tooltips : Clean, minimal labels at current levels with hover tooltips allow you to quickly identify the level without cluttering the chart. Customizable Styling : Independently adjustable colours for VWAP and each deviation band pair. Offset support for forward/backward shifting. Recommended Use Cases Intraday Scalping/Mean Reversion : 5m–15m charts with Daily anchor + previous value area as primary reference. Swing Entries : Higher timeframes (1H–4H) using Weekly or Quarterly VWAP for bias, with previous quarter's value area as major confluence. Deviation Trading : Watch for price interaction with ±2σ/±3σ bands combined with approach alerts for potential exhaustion. Institutional Benchmarking : Quarterly/Yearly anchors approximate common institutional VWAP reset periods. Additional Notes Source fixed to hlc3 (industry standard for VWAP). Enjoy cleaner, more contextual VWAP analysis. | | deKoder | | Released December 2025 | Open Source // IF THIS FREE(!) VWAP SCRIPT — OR ANY OF ITS FRIENDS — HAS HELPED YOU BANK SOME COINS... // A COFFEE, LUNCH, OR A FEW SATS GOES A LONG WAY TOWARDS KEEPING THE LIGHTS ON // COFFEE KEEPS THE PINE FLOWING 😉❤️ | FR33FA11 // SOL: 2N8HWPAHSC7Z8SLyneMrZp234UAP9HCtQX7wNXw7LKQC // ETH: 0xE770D254DC579d1db7bA2fe74376b7009527356B // BTC: bc1qd8j3awht5yrjtnvt5dagxldzhaesc83sftype3 // POLYGON: 0xE770D254DC579d1db7bA2fe74376b7009527356B // HYPE: 0xE770D254DC579d1db7bA2fe74376b7009527356BChỉ báocủa FR33FA11Cập nhật 34
Open Interest Weighted Average Price [Arjo]Open Interest Weighted Average Price , or OIWAP , is a simple visual indicator that shows the average price of an asset based on changes in open interest . Instead of using trading volume like VWAP, this indicator gives more weight to prices where new futures contracts are being added or removed . This helps highlight the price levels where traders are actively building or closing positions. The indicator shows: A main line that represents the average price weighted by open interest changes. Upper and lower bands (standard deviation bands) that show how far the price moves away from this average. OIWAP is mainly useful for NSE futures markets , where open interest data is available. It helps traders visually understand where most market participation and positioning are taking place relative to price . Concepts: Applies statistical concepts, including weighted averaging and standard deviation, to open interest data Uses the absolute change in open interest as a weighting factor for each price point Creates a dynamic average that reflects where significant open interest activity has occurred during a given period Standard deviation bands are computed from this weighted average to show the statistical spread of prices around the OIWAP line Resets calculations based on user-selected time periods (daily, weekly, monthly, or session-based) Allows for fresh analysis at regular intervals Similar concept to volume-weighted average price (VWAP) indicators, but uses open interest changes as the weighting component Features: Weighted Average: Calculates a central line based on contract activity. Flexible Anchors: Allows users to choose the reset period for the calculation. Volatility Bands: Displays outer and mid-bands to visualize price stretches. Data Check: Built-in alerts notify you if Open Interest data is missing for a symbol. Visual Zones: Color-coded areas help identify price location at a glance. How To Use When you add the indicator to your chart, you will see: A main OIWAP line — the open-interest-weighted price level Mid-bands around the line (±0.5 standard deviations) Outer bands farther away (±2.0 standard deviations) Shaded background zones between these lines You can: Change the reset period to see how the average behaves over different time ranges Adjust the timeframe for open-interest data Turn mid-bands on or off Adjust colors and styles to improve readability Conclusion The OIWAP indicator serves as an educational tool for visualizing the relationship between price movements and open interest activity in futures markets Presents a weighted average price line along with statistical deviation bands Offers a structured framework for chart analysis Customizable settings allow users to adapt the display to their analytical preferences Maintains focus on visual interpretation rather than directional predictions Functions as a supplementary charting overlay that may complement other forms of technical and fundamental analysis Disclaimer This indicator is for educational and visual-analysis purposes only. It does not provide trading signals, financial advice, or guaranteed outcomes . You should perform your own research and consult a licensed financial professional when needed. All trading decisions are solely the responsibility of the user.Chỉ báocủa ARJO_2019Cập nhật 22151
Intraday Sentiment DynamicsThe purpose of this script is to create a structured model of intraday sentiment by analyzing how price behaves relative to VWAP. Instead of treating VWAP deviation as a simple overbought or oversold measure, the script aims to understand the dynamics behind that deviation — how quickly sentiment is shifting, whether that shift is strengthening or weakening, and when abrupt changes in behaviour occur. Its goal is to provide a standardized, volatility‑adjusted framework that helps traders identify trend continuation, trend exhaustion, mean‑reversion setups, and early regime shifts. To achieve this, the script begins by calculating the difference between the bar’s midpoint and VWAP. This raw deviation is then standardized using a rolling mean and standard deviation, producing a z‑score that expresses how far price is from VWAP in statistical terms. Standardization removes volatility bias, session drift, and asset‑specific scaling issues, making the signal comparable across different market conditions. A weighted moving average smooths this standardized deviation to reduce noise and prepare it for slope‑based analysis. The core of the script is a slope‑normalization mechanism that measures how the standardized VWAP deviation changes over time. For each bar, the script computes the slope over a user‑defined length, separates positive and negative slope events, and maintains these in arrays that track their recent behaviour. From these arrays, it calculates average magnitudes and standard deviations, allowing it to normalize the current slope into a consistent, volatility‑adjusted scale. This ensures that both small and extreme slope events are interpreted meaningfully. This normalization function is applied recursively to generate three higher‑order derivatives. The first derivative, velocity, represents the rate at which sentiment is moving toward or away from VWAP. The second derivative, acceleration, measures whether this movement is strengthening or weakening. The third derivative, jerk, captures sudden changes in acceleration and serves as an early indicator of shifts in market behaviour. Together, these derivatives form a multi‑layered behavioural model that reveals the internal structure of intraday sentiment. The script visualizes these components using distinct color families and filled regions that highlight positive and negative behaviour. Background shading reinforces the dominant direction of each derivative, making it easy to see when sentiment is building, fading, or reversing. The standardized VWAP deviation is plotted alongside these derivatives, and horizontal lines at ±1, ±2, and ±3 standard deviations provide a statistical frame of reference for identifying extreme conditions. In practical trading terms, the indicator helps identify strong continuation environments when velocity, acceleration, and jerk align in the same direction. It highlights early signs of trend exhaustion when jerk flips before acceleration, often preceding reversals. It supports mean‑reversion trades when VWAP deviation reaches extreme levels and the derivative chain begins to weaken. It also detects regime shifts when jerk spikes, helping traders avoid traps during sudden liquidity events or fake breakouts. By converting VWAP deviation into a structured, derivative‑based model, the script provides a clear and actionable view of intraday sentiment dynamics. Chỉ báocủa chriskokal1Cập nhật 33
[ASFX] Free Automatic VWAPsAutomatic VWAP & Key Levels Overview This indicator is designed to help traders evaluate VWAP interactions in context, rather than treating every VWAP touch as a trade opportunity. It combines VWAP with a momentum-based directional filter to highlight situations where price interaction with VWAP is supported by broader intraday momentum. This indicator also shows you the initial balance and opening range each day. Concept and Originality VWAP is commonly used as an institutional reference level, but VWAP alone does not distinguish between meaningful acceptance/rejection and random intraday chop. This script addresses that limitation by conditioning VWAP interactions with a momentum filter. Signals are only displayed when price location and momentum alignment occur together, allowing traders to focus on higher-quality VWAP reactions instead of monitoring multiple indicators separately. How It Works • VWAP is used as the primary price reference level. • A momentum filter evaluates directional bias and participation. • Visual signals appear only when price is interacting with VWAP and momentum confirms acceptance or rejection in the same direction. • No signals are shown during low-momentum or sideways conditions around VWAP. How to Use This indicator is best used as a confirmation tool, not as a standalone trading system. It is intended to assist traders in filtering VWAP-based trade ideas by highlighting when conditions are aligned versus when price is simply chopping around VWAP. Markets and Timeframes • Designed for index futures such as ES and NQ • Optimized for intraday trading • Works best on lower timeframes (1–5 minute charts) Limitations • Not predictive • Not a complete trading strategy • Does not replace price action analysis, trade management, or risk control • Signals should be evaluated alongside market structure and contextChỉ báocủa austinsilverfx66880
Volume Weighted Average Price @Marx_CapitalSimple VWAP indicator edited to not connect the lines between sessions for a cleaner look without vertical lines at session ends. Session end and start times are customizable.Chỉ báocủa Marx_CapitalCập nhật 24
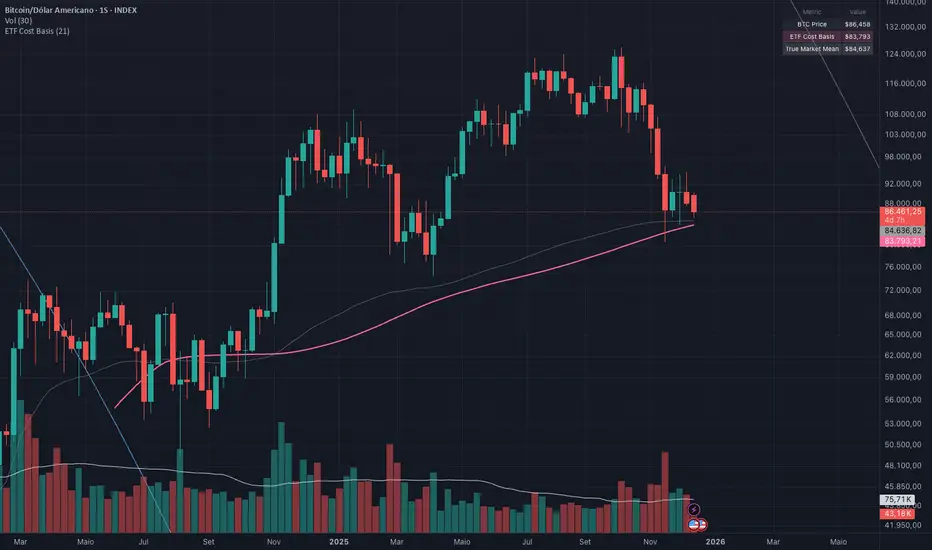
BTC ETF Average Inflow Cost BasisConcept Since the historic launch of Bitcoin Spot ETFs on January 11, 2024, institutional flows have become a major driver of price action. This indicator aims to visualize the aggregate Cost Basis (average entry price) of the major Bitcoin ETFs relative to the underlying asset. It serves as an on-chain proxy for institutional positioning, helping traders identify critical support levels where ETF inflows have historically concentrated. How it Works The script aggregates daily volume data from the top Bitcoin ETFs (IBIT, FBTC, ARKB, GBTC, BITB) and compares it against the Bitcoin price (BTCUSDT). ETF Cost Basis (Pink Line): This is calculated as a Cumulative Volume-Weighted Average Price (VWAP), anchored specifically to the ETF launch date (Jan 11, 2024). Formula: It accumulates (BTC Price * Total ETF Volume) and divides it by the Cumulative Total ETF Volume. This creates a dynamic level representing the "breakeven" price for the aggregate volume traded through these funds. True Market Mean (Gray Line): This represents the simple cumulative average of the Bitcoin price since the ETF launch date. It acts as a neutral baseline for the post-ETF market era. How to Use Institutional Support: The Cost Basis line often acts as a strong dynamic support level during corrections. When price revisits this level, it suggests the market is returning to the average institutional entry price. Trend Filter: Price > Cost Basis: The market is in a net profit state relative to ETF flows (Bullish/Trend continuation). Price < Cost Basis: The market is in a net loss state (Bearish/Capitulation risk). Confluence: The intersection of the Cost Basis and the True Market Mean can signal pivotal moments of trend reset. Features Data Aggregation: Pulls data from 5 major ETFs via request.security without repainting (using closed bars). Dashboard: Includes a table in the top-right corner displaying real-time values for Price, Cost Basis, and Market Mean. Customization: You can toggle individual ETF Moving Averages in the settings (disabled by default due to price scale differences between BTC and ETF shares). Disclaimer This tool is for educational purposes only and attempts to estimate institutional cost basis using volume proxies. It does not represent financial advice. Chỉ báocủa carlosbucci63
QUANT TRADING ENGINE [PointAlgo]Quant Trading Engine is a quantitative market-analysis indicator that combines multiple statistical factors to study trend behavior, mean reversion, volatility, execution efficiency, and market stability. The indicator converts raw price behavior into standardized signals to help evaluate directional bias and risk conditions in a systematic way. This script focuses on factor alignment and regime awareness, not prediction certainty. Design Philosophy Markets move through different regimes such as trending, ranging, volatile expansion, and instability. This indicator attempts to model these regimes by blending: Momentum strength Mean-reversion pressure Volatility risk Trend filtering Execution context (VWAP) Correlation structure Each component is normalized and combined into a single Quant Alpha framework. Factor Construction 1. Momentum Factor Measures directional strength using percentage price change over a rolling window. Standardized using mean and standard deviation. Represents trend continuation pressure. 2. Mean Reversion Factor Measures deviation from a longer moving average. Standardized to identify stretched conditions. Designed to capture counter-trend behavior. Directional Clamping Mean-reversion signals are dynamically restricted: No counter-trend buying during downtrends. No counter-trend selling during uptrends. Allows both sides only in neutral regimes. This prevents conflicting signals in strong trends. 3. Volatility Factor Uses realized volatility derived from price changes. Penalizes environments where volatility deviates significantly from its norm. Acts as a risk adjustment rather than a directional driver. 4. Composite Quant Alpha The final Quant Alpha is a weighted blend of: Momentum Mean reversion (trend-clamped) Volatility risk The composite is standardized into a Z-score, allowing consistent interpretation across instruments and timeframes. Signal Logic Buy signal occurs when Quant Alpha crosses above zero. Sell signal occurs when Quant Alpha crosses below zero. Zero-cross logic is used to represent shifts from negative to positive statistical bias and vice versa. Signals reflect statistical regime change, not trade instructions. Volatility Smile Context Measures price deviation from its statistical distribution. Identifies skewed conditions where upside or downside volatility becomes dominant. Highlights extreme deviations that may imply elevated derivative risk. Exotic Risk Conditions Detects sudden price expansion combined with volatility spikes. Highlights environments where execution and risk become unstable. Visual background cues are used for awareness only. Execution Context (VWAP) Measures price distance from VWAP. Used to assess execution efficiency rather than direction. Helps identify stretched conditions relative to average traded price. Correlation Structure Evaluates short-term return correlations. Detects when price behavior becomes less predictable. Flags structural instability rather than trend direction. Visualization The indicator plots: Quant Alpha (scaled) with directional coloring Volatility smile deviation Price vs VWAP distance Correlation structure Signal markers indicate Quant Alpha zero-cross events and risk conditions. Dashboard A compact dashboard summarizes: Trend filter state Quant Alpha polarity and value Individual factor readings Current action state (Buy / Sell / Wait / Risk) The dashboard provides a real-time snapshot of internal model conditions. Usage Notes Designed for analytical interpretation and research. Best used alongside price action and risk management tools. Factor behavior depends on instrument liquidity and volatility. Not optimized for illiquid or irregular markets. Disclaimer This script is provided for educational and analytical purposes only. It does not provide financial, investment, or trading advice. All outputs should be independently validated before making any trading decisions.Chỉ báocủa pointalgo117
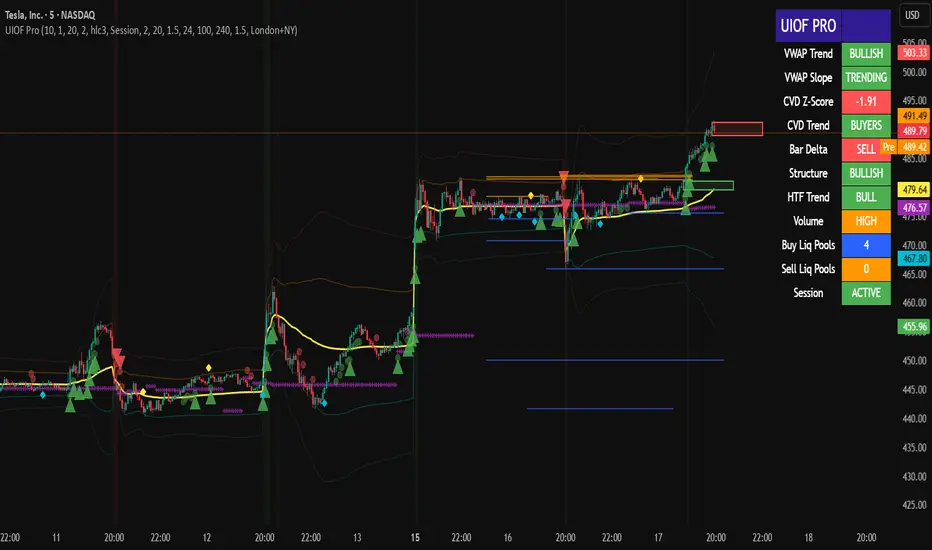
Ultimate Institutional Order Flow Pro [Pointalgo]Ultimate Institutional Order Flow (UIOF Pro) Ultimate Institutional Order Flow (UIOF Pro) is a multi-component market analysis indicator designed to study order flow behavior, liquidity interaction, volatility structure, and session-based participation. It integrates several commonly used market structure and order-flow concepts into a single visual framework. This script focuses on context and alignment, not on isolated signals. Core Objective The indicator aims to identify areas where price, volume, liquidity, and structure appear aligned in the same direction. It does this by combining: VWAP behavior Volume participation Cumulative delta analysis Liquidity pool interaction Order blocks and fair value gaps Market structure shifts Session and higher-timeframe confirmation VWAP & Volatility Framework Calculates VWAP using session, weekly, or monthly anchors. Optional VWAP standard-deviation bands visualize price dispersion. VWAP slope and price position are used to classify directional bias. VWAP is treated as a dynamic equilibrium reference rather than a signal. Cumulative Volume Delta (CVD) Estimates buy and sell pressure based on intrabar price movement. Tracks cumulative delta and a smoothed delta average. Uses delta change normalization to highlight abnormal activity. Detects potential delta divergences when price and participation differ. CVD is used to assess whether participation supports or contradicts price movement. Liquidity Zones & Sweeps Identifies recent swing highs and lows as potential liquidity pools. Tracks buy-side and sell-side liquidity areas. Flags conditions where price sweeps liquidity beyond recent extremes. Liquidity interaction is treated as context, not prediction. Order Blocks 1. Detects potential bullish and bearish order blocks using: Candle structure Volatility thresholds Volume confirmation 2.Highlights areas where strong participation followed opposing price movement. Order blocks are visual reference zones and do not imply guaranteed reactions. Fair Value Gaps (FVG) Identifies imbalance zones where price moves without overlapping structure. Filters gaps using ATR-based size conditions. Visual shading is used to highlight imbalance areas. These zones may represent inefficient price movement requiring further interaction. Volume Profile & Point of Control (POC) Builds a simplified volume profile over a configurable lookback window. Determines the price level with the highest traded volume (POC). POC is used as a reference for acceptance or rejection behavior. Market Structure Evaluates recent highs and lows to identify structure breaks. Classifies directional structure as bullish, bearish, or neutral. Structure is used as a directional filter rather than a trigger. Multi-Timeframe Confirmation Optional higher-timeframe confirmation aligns lower-timeframe behavior with broader context. Prevents analysis from relying on isolated timeframe conditions. Session Filtering 1. Allows analysis to be limited to specific trading sessions. 2. Helps reduce signals during low-participation periods. 3. Session logic affects signal eligibility, not calculations. Signal Logic Signals are generated only when multiple independent conditions align, including: Liquidity interaction Order block presence VWAP bias Delta confirmation Structure alignment Volume participation Optional higher-timeframe confirmation Active trading session Strong continuation conditions are also highlighted when price, volume, and participation remain aligned. Signals represent confluence states, not trade instructions. Dashboard Summary A real-time dashboard summarizes: VWAP bias and slope CVD strength and direction Delta behavior Market structure state Higher-timeframe context Volume conditions Liquidity pool counts Session activity This provides a high-level snapshot of market conditions without manual calculation. Alerts are available for: Institutional alignment conditions Strong continuation pressure Liquidity sweeps Delta divergences Alerts are informational and reflect internal indicator states only. Usage Notes Designed for analytical interpretation and market study. Best used alongside price action and risk management methods. Performance depends on instrument liquidity and volume quality. All visual elements can be individually enabled or disabled. Disclaimer This script is provided for educational and analytical purposes only. It does not provide financial, investment, or trading advice. All outputs should be independently verified before making trading decisions.Chỉ báocủa pointalgo271
Liquidity Levels Pro Tool - thewallranka Liquidity Levels Pro Tool is a market-structure and liquidity-mapping indicator designed to help discretionary futures and index traders identify statistically relevant price levels where reactions, continuations, or liquidity sweeps are more likely to occur. This script is a decision-support tool, not a signal generator. It does not issue buy/sell alerts or predict future price movement. Instead, it organizes and scores liquidity information so traders can make their own contextual decisions. What this indicator does The script continuously detects and maintains liquidity zones derived from price pivots, then evaluates those zones using multiple structural and contextual factors: Repeated price interaction (touches) Freshness (time since last interaction) Confluence with key reference levels Reaction behavior after contact Session relevance (RTH vs overnight) Market regime (trend vs mean reversion) Time-of-day effects (open, midday, power hour) Only the most relevant zones—based on a dynamic scoring system—are displayed to reduce chart clutter and focus attention on levels that have historically mattered. Core components 1. Liquidity Zones Zones are built from pivot highs and lows and expanded into areas using a configurable tick-based padding. Nearby zones are merged to avoid redundancy. Each zone is continuously evaluated and assigned a score (0–100) reflecting its relative importance. 2. Zone Scoring (No Lookahead) Zone scores are based on: Number of confirmed interactions Recency of the last touch Confluence with prior day/week levels, VWAP, and Opening Range Reaction quality after touches (speed and follow-through) Session alignment (zones that “work” in the current session are favored) Penalties after liquidity sweeps Zones are not forward-looking and do not rely on future data. 3. Context Engine The script classifies the current environment using VWAP slope and distance: Trend (up or down) Mean reversion Mixed/transition Time-of-day context (Open, Midday, Power Hour) is also tracked internally and influences zone scoring. This context is displayed in the HUD to support situational awareness, not automated decisions. 4. Liquidity Sweeps Optional sweep detection highlights situations where price trades beyond a zone and closes back inside, indicating potential stop runs or failed breakouts. Sweeps are rate-limited and applied conservatively to avoid visual noise. 5. Trade Planning Levels (Optional) When enabled, the script highlights the nearest high-quality liquidity level above and below price based on score thresholds. These are intended as reference targets, not trade entries or exits. HUD (Heads-Up Display) The on-chart HUD summarizes: Key reference levels (prior day/week, Opening Range) Nearest strong liquidity above/below price Market regime and time-of-day context Distance to levels (ticks or points) The HUD is fully optional, positionable, and includes resizable modes (Small / Medium / Large) to fit different chart layouts. How to use this tool This indicator is best used as part of a discretionary trading process, for example: Identifying areas where price is more likely to react or pause Framing trades around higher-quality structure instead of arbitrary levels Filtering setups based on session and regime context Managing expectations near known liquidity rather than chasing price It is intentionally designed not to provide trade signals. Limitations and important notes This script does not predict outcomes or guarantee reactions High-scoring zones can still fail Liquidity behavior is context-dependent and probabilistic No performance claims or backtested results are provided The indicator should not be used in isolation Past behavior does not imply future results. Chart and usage notes The script is intended for standard time-based charts Recommended for liquid futures and index products Use a clean chart for clarity when publishing or sharing No external indicators are required Final note Liquidity Levels Pro (Tool) — v6 is designed to organize complex market structure into a clear, readable framework, allowing traders to focus on execution and risk management rather than raw level detection. This script reflects an analytical approach to intraday liquidity and structure, not an automated trading system.Chỉ báocủa thewallranka342
Colby Cheese VWAP Setup [v2.0]🔧 Core Refactors • Imbalance function fixed: • Removed invalid usage. • Now uses for past bar references. • Bias checks are handled outside the function with proper series indexing. • Bias alignment: • Added and so CHoCH signals only fire when price change agrees with EMA bias. • Swing reset: • After a valid CHoCH, and reset to so stale levels don’t keep firing. • Line/label management: • CHoCH lines and labels now reuse persistent IDs (, ) instead of spamming new objects every trigger. ✨ New Features • Anticipation mode: • Blue “Anticipate” lines/labels drawn when delta + bias align before CHoCH confirmation. • Helps you see potential setups earlier. • Entry zone lines: • Solid green/red lines drawn at entry levels when is enabled. • Separate from FRVP dashed zones. • Stop‑loss lines: • Orange dotted lines drawn opposite the entry zone when is enabled. • Gives a visual risk marker. 🎨 Visual Consistency • Candle coloring simplified: white candles only when CHoCH triggers. • FRVP zones remain dashed lines with “Enter” labels. • Anticipation zones are blue solid lines. • Entry zones are solid green/red. • Stop‑loss lines are orange dotted.Chỉ báocủa dscottmuller16
WOLFGATEWOLFGATE is a clean, session-aware market structure and regime framework designed to help traders contextualize price action using widely accepted institutional references. The indicator focuses on structure, momentum alignment, and mean interaction, without generating trade signals or predictions. This script is built for clarity and decision support. It provides a consistent way to evaluate market conditions across different environments while remaining flexible to individual trading styles. What This Indicator Displays Momentum & Structure Averages 9 EMA — Short-term momentum driver 21 EMA — Structural control and trend confirmation 200 SMA — Primary regime boundary 400 SMA (optional) — Deep regime / macro bias reference These averages are intended to help assess directional alignment, trend strength, and structural consistency. Session VWAP (Institutional Mean) Session-based VWAP with a clean daily reset Default session: 09:30–16:00 ET Uses HLC3 as the VWAP source for balanced price input Rendered in a high-contrast institutional blue for visibility VWAP can be used to evaluate mean interaction, acceptance, or rejection during the active session. How to Use WOLFGATE This framework is designed for context, not signals. Traders may use WOLFGATE to: Identify bullish or bearish market regimes Evaluate momentum alignment across multiple time horizons Observe price behavior relative to VWAP Maintain directional bias during trending conditions Avoid low-quality conditions when structure is misaligned The indicator does not generate buy or sell signals and does not include alerts or automated execution logic. Important Notes Volume must be added separately using TradingView’s built-in Volume indicator (Volume cannot be embedded directly into this script due to platform limitations.) This script is intended for educational and analytical purposes only No financial advice is provided Users are responsible for their own risk management and trade decisionsChỉ báocủa Capitalwithluke69
NQ Futures VWAP on QQQOverlay NQ1 vwap for QQQ Track NQ future's vwap on your QQQ chart to scale with optional bandsChỉ báocủa detwiler23
Student Alpha VWAPStudent Alpha VWAP is a flexible, anchor-based VWAP tool designed for traders who want deeper control over intraday and higher-timeframe volume-weighted trend analysis. The indicator supports multiple anchor types—including Sessions, Weeks, Months, Quarters, Years, and event-based anchors such as Earnings, Dividends, and Splits—allowing VWAP to automatically reset at meaningful market intervals. The script includes up to three optional VWAP bands. These can be calculated using standard deviation or percentage-based distance, making the tool adaptable for volatility modeling, mean-reversion strategies, or structural trend assessment. Bands and colors are fully customizable, while an optional filter hides VWAP on 1D+ charts for cleaner high-timeframe layouts. Features include: • Event-aware VWAP anchoring (Earnings / Dividends / Splits) • Standard deviation or percentage-based VWAP bands • Three independent band multipliers with visual fills • Automatic timeframe and period detection • Offset controls and full plot toggle options This tool aims to give traders a more adaptable, context-aware version of VWAP that fits both systematic and discretionary workflows.Chỉ báocủa harshkapse0227
VWAP-Anchored MACD [BOSWaves]VWAP-Anchored MACD - Volume-Weighted Momentum Mapping With Zero-Line Filtering Overview The VWAP-Anchored MACD delivers a refined momentum model built on volume-weighted price rather than raw closes, giving you a more grounded view of trend strength during sessions, weeks, or months. Instead of tracking two EMAs of price like a standard MACD, this tool reconstructs the MACD engine using anchored VWAP as the core input. The result is a momentum structure that reacts to real liquidity flow, filters out weak crossovers near the zero line, and visualizes acceleration shifts with clear, high-contrast gradients. This indicator acts as a precise momentum map that adapts in real time. You see how weighted price is accelerating, where valid crossovers form, and when trend conviction is strong enough to justify execution. It uses gradient line coloring to show bullish or bearish momentum, histogram shading to highlight energy shifts, cross dots to mark valid crossovers, optional buy/sell diamonds for execution cues, and candle coloring to display trend strength at a glance. Theoretical Foundation Traditional MACD compares the difference between two exponential moving averages of price. This variant replaces price with anchored VWAP, making the calculation sensitive to actual traded volume across your chosen period (Session, Week, or Month). Three principles drive the logic: Anchored VWAP Momentum : Price is weighted by volume and aggregated across the selected anchor. The fast and slow VWAP-EMAs then expose how liquidity-corrected momentum is expanding or contracting. Zero-Line Distance Filtering : Crossover signals that occur too close to the zero line are removed. This eliminates the common MACD problem of generating weak, directionless signals in choppy phases. Directional Visualization : MACD line, signal line, histogram, candle colors, and optional diamond markers all react to shifts in VWAP-momentum, giving you a clean structural read on market pressure. Anchoring VWAP to session, weekly, or monthly resets creates a systematic framework for tracking how capital flow is driving momentum throughout each trading cycle. How It Works The core engine processes momentum through several mapped layers: VWAP Aggregation : Price × volume is accumulated until the anchor resets. This creates a continuous, liquidity-corrected VWAP curve. MACD Construction : Fast and slow VWAP-EMAs define the MACD line, while a smoothed signal line identifies edges where momentum shifts. Zero-Line Distance Filter : MACD and signal must both exceed a threshold distance from zero for a crossover to count as valid. This prevents fake crossovers during compression. Visual Momentum Layers : It uses gradient line coloring to show bullish or bearish momentum, histogram shading to highlight energy shifts, cross dots to mark valid crossovers, optional buy/sell diamonds for execution cues, and candle coloring to display trend strength at a glance. This layered structure ensures you always know whether momentum is strengthening, fading, or transitioning. Interpretation You get a clean, structural understanding of VWAP-based momentum: Bullish Phases : MACD > Signal, histogram expands, candles turn bullish, and crossovers occur above the threshold. Bearish Phases : MACD < Signal, histogram drives lower, candles shift bearish, and downward crossovers trigger below the threshold. Neutral/Compression : Both lines remain near the zero boundary, histogram flattens, and signals are suppressed to avoid noise. This creates a more disciplined version of MACD momentum reading - less noise, more conviction, and better alignment with liquidity. Strategy Integration Trend Continuation : Use VWAP-MACD crossovers that occur far from the zero line as higher-conviction entries. Zero-Line Rejection : Watch for histogram contractions near zero to anticipate flattening momentum and potential reversal setups. Session/Week/Month Anchors : Session anchor works best for intraday flows. Weekly or monthly anchor structures create cleaner macro momentum reads for swing trading. Signal-Only Execution : Optional buy/sell diamonds give you direct points to trigger trades without overanalyzing the chart. This indicator slots cleanly into any momentum-following system and offers higher signal quality than classic MACD variants due to the volume-weighted core. Technical Implementation Details VWAP Reset Logic : Session (D), Week (W), or Month (M) Dynamic Fast/Slow VWAP EMAs : Fully configurable lengths, smoothing and anchor settings MACD/Signal Line Framework : Traditional structure with volume-anchored input Zero-Line Filtering : Adjustable threshold for structural confirmation Dual Visualization Layers : MACD body + histogram + crosses + candle coloring Optimized Performance : Lightweight, fast rendering across all timeframes Optimal Application Parameters Timeframes: 1- 15 min : Short-term momentum scalping and rapid trend shifts 30- 240 min : Balanced momentum mapping with clear structural filtering Daily : Macro VWAP regime identification Suggested Configuration: Fast Length : 12 Slow Length : 26 Signal Length : 9 Zero Threshold : 200 - 500 depending on asset range These suggested parameters should be used as a baseline; their effectiveness depends on the asset volatility, liquidity, and preferred entry frequency, so fine-tuning is expected for optimal performance. Performance Characteristics High Effectiveness: Assets with strong intraday or session-based volume cycles Markets where volume-weighted momentum leads price swings Trend environments with strong acceleration Reduced Effectiveness: Ultra-choppy markets hugging the VWAP axis Sessions with abnormally low volume Ranges where MACD naturally compresses Disclaimer The VWAP-Anchored MACD is a structural momentum tool designed to enhance directional clarity - not a guaranteed predictor. Performance depends on market regime, volatility, and disciplined execution. Use it alongside broader trend, volume, and structural analysis for optimal results. Chỉ báocủa BOSWavesCập nhật 2020 1.9 K
VWAP From Pivots Lows and Highs This script starts automatically VWAP from pivot lows and highs. Parameter allows you to enable up to 3 VWAP (default). If you use 3, the VWAP from the last three pivots point will be drawn. If you use 1, just the last pivot point will be used. You can also just enable VWAPs starting from pivot lows or highs. Let me know if there are any problems. Chỉ báocủa Wised123Cập nhật 99883
Algo & Dark Pool Activity - Find Hidden LiquidityThe script is designed to highlight potential algorithmic buying pressure and dark pool accumulation proxies on a TradingView chart. It overlays signals directly on price bars so you can visually spot when unusual activity may be occurring. Chỉ báocủa alexh116666185
Triple ATR Adaptive MAs + VWAP Option + Clouds + Candle Trend V2Another one of my experiences ... combining things... 📘 Indicator Description – Triple ATR Adaptive Moving Averages with VWAP Influence This indicator plots three adaptive moving averages whose behavior changes dynamically based on market volatility (ATR) and optionally VWAP deviation. Because they adapt in real time to both volatility and VWAP pressure, their movement, slope, and reaction speed differ significantly from traditional moving averages. 🔶 1. ATR-Adaptive Moving Averages Each of the three MAs uses a custom adaptive formula: ATR (Average True Range) is measured over a chosen period. Higher ATR → more volatility → the MA becomes more reactive and moves closer to price. Lower ATR → stable market → the MA becomes smoother and slower. This creates a volatility-aware smoothing factor, making the MA expand, contract, and respond to market conditions in ways a classic SMA, EMA, or HMA cannot. 🔷 2. Optional VWAP Influence Each MA has an independent toggle allowing it to be influenced by VWAP. When enabled: The MA is gently “pulled” toward VWAP. The strength of this attraction is determined by the VWAP Influence parameter (0–1). This causes the moving averages to behave differently from normal MAs: In trending markets, the ATR and price push the MA away from VWAP. In mean-reverting or balanced conditions, VWAP pulls the MA back toward fair value. The result is an MA that reflects both trend pressure and fair-value pressure. 🔶 3. Visual Behavior: Non-Traditional Movement Because each MA is simultaneously influenced by volatility, trend magnitude, and VWAP deviation, their shape is often very distinct from normal moving averages. They may: Respond faster during high volatility Flatten out earlier during consolidation Curve toward VWAP when price becomes extended Separate or compress depending on ATR strength This is intentional and essential, since the goal is to show: ✔ Volatility expansion ✔ Trend exhaustion ✔ Overextended price relative to VWAP ✔ Dynamic trend confirmation Rather than simply smoothing past price. 🔷 4. Three Independent Adaptive Lines Each of the three moving averages has: Its own ATR length Its own sensitivity multiplier Its own optional VWAP influence Its own color and trail This allows the user to combine: a fast volatility-adaptive trend line a mid-range adaptive baseline a slow adaptive long-trend MA All adapting independently to volatility and VWAP conditions. 🔶 5. Optional Candle Coloring The indicator can color candles according to trend strength derived from the fast/slow MAs. Stronger trends produce more vivid colors. Neutral or conflicting trends produce softer colors. This adds a visual layer to identify: Trend direction Trend strength Volatility state Market compression at a glance. 📌 Summary This indicator does not behave like standard SMAs or EMAs because each line dynamically adapts to: 🔸 ATR (volatility) 🔸 VWAP (fair value) This makes the indicator extremely responsive to market conditions while still reducing noise during stable phases. It provides a more realistic, context-aware, and intelligent representation of price behavior compared to traditional moving averages.Chỉ báocủa ueuitoCập nhật 67